 🏷️ Likely Rental
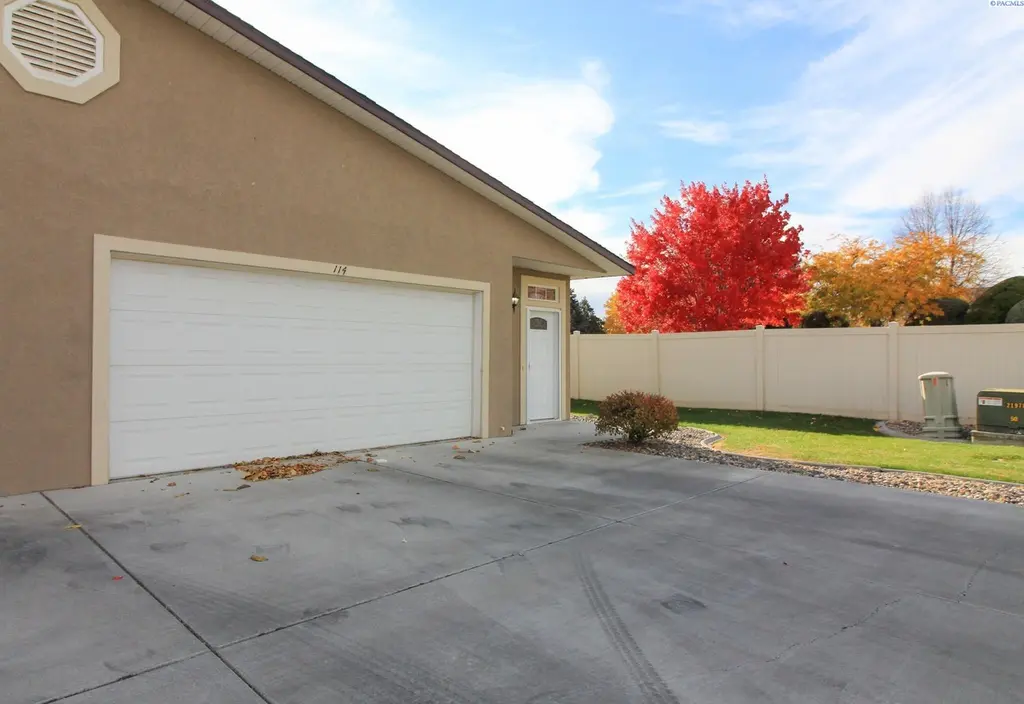
114 S Tweedt Pl · Kennewick, WA
Flood risk 1/10 · Minimal
- FEMA flood zone
- X
- Chance of flooding over 30 yrs
- 0.0%
- Est. flood insurance / yr
- $507 – $1,088
Fire risk 1/10 · Minimal
- Est. fire insurance / yr
- $604 – $1,122
Heat risk 5/10 · Moderate
- Hot days now (above 99°F)
- 7 days/yr
- Hot days in 30 yrs
- 15 days/yr
Wind risk 1/10 · Minimal
- Chance of severe wind over 30 yrs
- —
Air-quality risk 8/10 · Major
- Unhealthy air days now
- 14 days/yr
- Unhealthy air days in 30 yrs
- 15 days/yr
Risk factors via First Street. Map © Google.
Why this score? — see what drove the D+ grade
The composite is a weighted blend of 9 inputs, each scored 0–100. Each bar is that input's sub-score; the figure is the points it added to the 100-point composite (weight × sub-score).
- Cash flow +15.0/30.0
- ARV discount +7.5/15.0
- 1% rule +5.0/10.0
- DSCR +5.0/10.0
- Schools +4.6/10.0
- Livability +3.9/5.0
- Rent growth +3.3/5.0
- Condition / age +2.5/5.0
- Appreciation +0.0/10.0
$1,695
🖨 Deal sheet 📄 Offer letter ✓ Due diligence
Listing remarks MLS
2 Bed/2 Bath Towhouse in Kennewick Applications and Viewing Requests accepted from OUR WEBSITE ONLY: 2 bed, 2 bath townhome. 1,020sqft. in Kennewick Interior: * Hard surface flooring throughout the home * Open main living space * Eat-at bar in kitchen, stone countertops, & lots of cabinet/counterspace * Primary has attached bath with standing shower, soaking tub, and a walk-in closet * Washer & dryer provided Exterior: * Attached 2-car garage with lots of storage cabinets and epoxy floors * Concrete back patio Additional Lease Information: * 1 year lease term * Pet friendly with approval & fee/rent Deposit & Fees Include: $1,356 Refundable Deposit $239 Inspection Fee Amenities: HOA Provided Landscaping
Key facts
- Stone countertops
- Walk-in closet
- Soaking tub
Tags
Property features AI
Exterior
- Parking: Two covered parking spaces; Two total garage spaces (attached garage)
- Home design: Townhouse; Single-story / one level; New construction
- Construction: Built as new construction
- Exterior features: Lot approximately 0.09 acres; Zoned single family residential; Located in The Highlands subdivision
Interior
- Bathrooms: Two full bathrooms
- Interior features: No basement
Neighborhood map
What this means for you Summary
Snapshot
- This is a 3-bed/2.0-bath townhouse listed at $2k.
Deal economics
- At list price, monthly cash flow is $1k ($16k/yr) — positive.
- The deal already cash-flows at list — no discount required.
- Meets the 1% rule at list price ($2k rent vs $2k).
- Cap rate 972.2% vs local median 3.3% in Kennewick — top-decile yield for the area; either an underpriced asset or a hidden risk that comps aren't pricing in. Stress-test before assuming the spread holds.
Location & tenants
- Location reads 78/100 on livability (#131 in WA, #2,599 nationally) — a middle-class / working-renter tenant base. Strengths: commute A+, housing A+, health & safety A; Watch: schools D+, amenities D+, crime F.
- Kennewick School District (urban): math 43% / reading 58% proficiency, ranked #141 of 291 in WA (top 48%) — acceptable for families but not a draw, mixed tenant base, ~2y average lease.
- Market conditions: Rents rising (+3.4%/yr); 286 active listings in the ZIP; 40 comparable units currently listed for rent nearby; rentals at typical pace (median 21d on market — plan ~3-4 weeks tenant-placement turnaround); 40% of comp listings sitting > 30 days — soft ceiling on asking rent; 1,532 units permitted in Benton County in 2024 (389 in 5+ unit buildings).
- This rent runs 33% of the median local income ($63k/yr) — at the standard rent-burdened threshold; future hikes will face affordability resistance.
Forward outlook
- Local home prices are declining (-3.0%/yr); year-one equity from $11 of loan paydown is wiped out by about $51 of value loss. Plan a longer hold.
- Benton County population projected at +32% by 2050 — long-run rental-demand tailwind backs the buy-and-hold thesis.
- At projected returns (-3.0% appreciation + 3.4% rent growth), your $475 cash investment doubles in ~1 year — after that, you're playing with house money.
Negotiation context
- Only 14 days on market — expect competitive offers; lowballing is unlikely to land.
- 5 sale attempts since 17y ago with the ask held roughly flat each time — persistent listings suggest the price (not the market) is what's stuck; bring a comps-based counter.
Risks & watch-outs
- Climate carrying-cost: extreme-heat days projected 7→15/yr by 2055 (HVAC capex compounding) — expect insurance premiums to compound above CPI over the hold.
Questions for the listing agent
- Is there a deadline driving the sale (1031 exchange, divorce, estate, relocation)? That informs how much negotiation room exists.
- Schools are D-rated, which usually means shorter tenancies and higher turnover. Who's the typical renter profile here, and what's been the actual vacancy rate?
- Crime grade is F in this area — have there been break-ins, vandalism, or insurance claims at this property in the last 3 years? What carrier currently insures it and at what premium?
- The area grade is low — what's the realistic commute time and amenity access for the typical tenant pool here? Any planned neighborhood developments (good or bad) we should know about?
- What's the average days-on-market for RENTAL listings here right now (not sales)? A rising rental-DOM trend means longer vacancies and softer asking-rent achievability than the comps imply.
- What's the recent tenant-quality profile in this submarket — average credit score on applications, eviction rate, late-payment / NSF rate, and stable-employment percentage? A property-management company in the area should have these aggregated.
- How much new for-sale + rental construction is in the pipeline within 1–3 miles? Heavy new supply typically softens prices + rents 12–24 months out; constrained supply supports both.
Investment metrics
- 1% rule
- 102.76% ✓
- Cap rate
- 972.19%
- Cash-on-cash
- 3449.64%
- DSCR
- 154.49
- GRM
- 0.1
CMA / ARV
- ARV (on-the-fly)
- $226,440
- Comps found
- 8
Show comp detail 8 sales within ~0.75 mi
| Address | Dist | Beds/Ba | Sqft | Sold | Price | $/sf | Match |
|---|---|---|---|---|---|---|---|
| 114 S Tweedt Pl | 0.00mi | 2/2.0 (-1) | 1,020 (0%) | 12mo | $1,595 | $2 | 85 |
| 4203 W Kennewick Ave., Apt. 17 Ave #17 | 0.05mi | 2/1.0 (-1) | 902 (-12%) | 2mo | $200,000 | $222 | 67 |
| 4203 W Kennewick #12 Ave #12 | 0.05mi | 3/1.5 | 1,152 (+13%) | 8mo | $260,000 | $226 | 67 |
| 4203 W Kennewick Ave #3 Ave #3 | 0.05mi | 3/1.5 | 1,152 (+13%) | 11mo | $250,000 | $217 | 65 |
| 4203 W Kennewick Ave #27 | 0.05mi | 3/1.5 | 1,152 (+13%) | 19mo | $243,000 | $211 | 58 |
| 107 S Tweedt Pl | 0.03mi | 2/2.0 (-1) | 1,162 (+14%) | 17mo | $325,000 | $280 | 56 |
| 4227 W Klamath Ave | 0.66mi | 3/2.0 | 1,100 (+8%) | 1mo | $299,000 | $272 | 56 |
| 4203 W Kennewick Ave #36 Ave #36 | 0.05mi | 2/1.0 (-1) | 902 (-12%) | 21mo | $190,000 | $211 | 51 |
Match score weights: distance 35% · size 25% · config 20% · recency 20%. Top-matched comps best support the ARV.
Projected returns pro-forma
-3.0% appreciation · 3.39% rent growth · sell at horizon
- IRR
- —
- Equity multiple
- 185.01×
- Total profit
- $87,333
- Equity at exit
- $253
- IRR
- —
- Equity multiple
- 403.20×
- Total profit
- $190,884
- Equity at exit
- $147
Cash invested: $475 (down + closing). Projections, not guarantees.
Landlord ↔ Tenant lean methodology
- Overall (STATE)
- 28 Tenant-Leaning
- State Washington
- 28 Tenant-Leaning · D+8
- County
- — inherits STATE
- City
- — inherits STATE
ZIP-level market 99336
- Rents YoY
- 3.4%
- Active inventory
- 286
- Price-to-rent
- 0.1×
Monthly cashflow live
- Estimated rent
- $1,742 high interval (Pro) →
- Mortgage (P&I)
- −$9
- Tax est. 1.5%
- −$2 /mo · $25/yr
- Insurance
- −$1
- HOA
- −$0
- Vacancy / Maint / Mgmt
- −$366
- Net cashflow
- $1,364
Break-even live
UW: 25.0% down · 7.5% · 30yr · 1.5% tax · 5.0% vac · 8.0% maint · 8.0% mgmt
Financing live
Cash to close
- Down payment
- $424
- Closing costs
- $51
- Reserves months
- —
- Total cash needed
- —
Loan-product check · same deal, 3 products live
Conventional
25% down · 7.5% · 30yr
- Down + closing
- —
- Monthly P&I
- —
- Monthly cashflow
- —
- DSCR
- —
- Eligible?
- —
Personal DTI + credit; lowest rate.
DSCR
20% down · 8.5% · 30yr
- Down + closing
- —
- Monthly P&I
- —
- Monthly cashflow
- —
- DSCR
- —
- Eligible?
- —
No personal income docs; deal must DSCR.
Hard money
10% down · 12.0% · 12mo
- Down + closing
- —
- Monthly P&I
- —
- Monthly cashflow
- —
- DSCR
- —
- Eligible?
- —
Short-term bridge; refi at stabilization.
Rent comps 40 comps
| Address | Beds | Baths | Sqft | Rent | $/sqft | DOM | Units | Dist |
|---|---|---|---|---|---|---|---|---|
| 108 S Tweedt Pl Kennewick, WA | 2.0 | 2.0 | 1258 | $1,795 | $1.43 | 43d | 1 | 0.03mi |
| 4215 W 2nd Ave Kennewick, WA | 3.0 | 2.0 | 1348 | $2,595 | $1.93 | 43d | 1 | 0.06mi |
| 4108 W Albany Ave Unit A-D Kennewick, WA | 2.0 | 1.5 | 945 | $1,395 | $1.48 | 43d | 1 | 0.17mi |
| 200 S Union St Kennewick, WA | 2.0 | 1.0–1.5 | 860 | $1,348 | $1.57 | 13d | 2 | 0.19mi |
| 3703 W Kennewick Ave Kennewick, WA | 1.0–2.0 | 1.0 | 782 | $1,594 | $2.04 | 13d | 8 | 0.31mi |
| E 6th Ave Kennewick, WA | 2.0 | 1.0 | 1100 | $1,500 | $1.36 | 43d | 1 | 0.38mi |
| 12 S Morain St Kennewick, WA | 1.0–3.0 | 1.0 | 604 | $1,599 | $2.65 | 13d | 3 | 0.39mi |
| 440 N Volland St Kennewick, WA | 1.0–3.0 | 1.0–1.5 | 958 | $1,600 | $1.67 | 13d | 7 | 0.40mi |
| 400 S Morain St #7 Kennewick, WA | 3.0 | 2.5 | 1100 | $1,500 | $1.36 | 21d | 1 | 0.46mi |
| 4421 W Hood Ave Kennewick, WA | 2.0 | 1.5 | 942 | $1,412 | $1.50 | 13d | 3 | 0.46mi |
| 717 S Union St Kennewick, WA | 3.0 | 1.0 | 1340 | $1,895 | $1.41 | 43d | 1 | 0.48mi |
| 445 N Volland St Kennewick, WA | 1.0–2.0 | 1.0 | 735 | $1,294 | $1.76 | 13d | 7 | 0.48mi |
| 318 N Arthur St Kennewick, WA | 2.0–3.0 | 2.0 | 1113 | $1,975 | $1.77 | 13d | 1 | 0.48mi |
| 3708 W 6th Ave Unit B Kennewick, WA | 2.0 | 1.0 | 918 | $1,325 | $1.44 | 43d | 1 | 0.49mi |
| 455 S Morain St Kennewick, WA | 2.0 | 1.0 | 775 | $1,950 | $2.52 | 43d | 1 | 0.51mi |
| 609 N Tweedt St Kennewick, WA | 2.0 | 1.0 | 950 | $1,295 | $1.36 | 13d | 1 | 0.53mi |
| 3887 W 7th Ave Unit B-230 Kennewick, WA | 3.0 | 2.0 | 1262 | $1,850 | $1.47 | 21d | 1 | 0.53mi |
| 460 N Arthur St Kennewick, WA | 2.0 | 1.0–2.0 | 749 | $1,700 | $2.27 | 13d | 7 | 0.55mi |
| 325 S Johnson St Kennewick, WA | 2.0 | 1.5 | 1100 | $1,495 | $1.36 | 43d | 1 | 0.61mi |
| 3426 W 7th Ave Unit A130 Kennewick, WA | 2.0 | 2.0 | 1000 | $1,650 | $1.65 | 43d | 1 | 0.63mi |
| 3426 W 7th Ave Kennewick, WA | 2.0 | 2.0 | 1000 | $1,600 | $1.60 | 21d | 1 | 0.63mi |
| 465 N Arthur St Kennewick, WA | 2.0 | 1.0 | 717 | $1,550 | $2.16 | 43d | 1 | 0.66mi |
| 3120 W 4th Ave Kennewick, WA | 2.0 | 1.0 | 963 | $1,550 | $1.61 | 13d | 1 | 0.66mi |
| 5100 W Clearwater Ave Kennewick, WA | 1.0–3.0 | 1.0–2.0 | 1068 | $1,843 | $1.72 | 13d | 6 | 0.66mi |
| 3120 W 4th Ave Unit 360 Kennewick, WA | 2.0 | 1.0 | 963 | $1,550 | $1.61 | 43d | 1 | 0.66mi |
| 3120 W 4th Ave Apt 120 Kennewick, WA | 2.0 | 1.0 | 963 | $1,625 | $1.69 | 13d | 1 | 0.66mi |
| 507 N Arthur St Kennewick, WA | 1.0–2.0 | 1.0 | 809 | $1,399 | $1.73 | 13d | 6 | 0.68mi |
| 801 N Tweedt St Kennewick, WA | 1.0–2.0 | 1.0 | 779 | $1,350 | $1.73 | 21d | 3 | 0.69mi |
| 3320 W 9th Ave Unit 30 Kennewick, WA | 2.0 | 2.0 | 1200 | $1,400 | $1.17 | 43d | 1 | 0.72mi |
| 530 N Edison St Kennewick, WA | 1.0–2.0 | 1.0 | 700 | $1,657 | $2.37 | 13d | 11 | 0.73mi |
| 720 N Arthur St Kennewick, WA | 3.0 | 1.5 | 1200 | $1,545 | $1.29 | 13d | 9 | 0.73mi |
| N Johnson St Kennewick, WA | 2.0 | 1.5 | 1100 | $1,450 | $1.32 | 21d | 3 | 0.77mi |
| 4711 W Metaline Ave Kennewick, WA | 1.0–2.0 | 1.0 | 777 | $1,525 | $1.96 | 21d | 7 | 0.77mi |
| 3119 W 7th Ave Unit C120 Kennewick, WA | 3.0 | 2.5 | 1500 | $2,050 | $1.37 | 21d | 1 | 0.81mi |
| 3119 W 7th Ave Kennewick, WA | 3.0 | 2.5 | 1500 | $2,050 | $1.37 | 13d | 1 | 0.81mi |
| 3113 W 7th Ave Unit D110 Kennewick, WA | 2.0 | 2.5 | 1000 | $1,750 | $1.75 | 13d | 1 | 0.83mi |
| 100 N Irving Pl Unit H202 Kennewick, WA | 2.0 | 1.0 | 858 | $1,395 | $1.63 | 44d | 1 | 0.88mi |
| 100 N Irving Pl Unit C203 Kennewick, WA | 2.0 | 1.0 | 858 | $1,275 | $1.49 | 44d | 1 | 0.88mi |
| 100 N Irving Pl Unit H101 Kennewick, WA | 3.0 | 1.5 | 1120 | $1,699 | $1.52 | 44d | 1 | 0.88mi |
| 100 N Irving Pl Unit K101 Kennewick, WA | 3.0 | 1.5 | 1120 | $1,700 | $1.52 | 44d | 1 | 0.88mi |
Listing history 11 events
-
2026-06-15days on market $1,695 Active 14 DOM
-
2026-06-14days on market $1,695 Active 12 DOM
-
2026-06-13days on market $1,695 Active 11 DOM
-
2026-06-10days on market $1,695 Active 9 DOM
-
2026-06-09days on market $1,695 Active 8 DOM
-
2026-06-08days on market $1,695 Active 7 DOM
-
2026-06-07days on market $1,695 Active 6 DOM
-
2026-06-05days on market $1,695 Active 3 DOM
-
2026-06-03days on market $1,695 Active 2 DOM
-
2026-06-02remarks 687-char remark
-
2026-06-02$1,695 Active 1 DOM
ⓘ Source: listings_history table (triggers on properties + properties_extension) + one-shot
backfill from property_details.listing_events for pre-trigger history.
Climate risk First Street
- Flood 1/10 Low FEMA zone X · 0% chance over 30 yrs
- Wildfire 1/10 Low
- Heat 5/10 Major 7 d/yr ≥99°F today · 15 d/yr by 30 yrs out
- Wind 1/10 Low
- Air quality 8/10 Severe 14 unhealthy d/yr today · 15 by 30 yrs out
Nearby sold comps map
Loading sold comps map…
Walkable amenities ~0.75 mi
Loading nearby amenities…
Taxation est. · year 1
- Rental income
- $20,902
- − Mortgage interest
- −$95
- − Property taxes
- −$25
- − Insurance
- −$8
- − Repairs & maintenance
- −$1,672
- − Management
- −$1,672
- − Depreciation
- −$49
- Taxable income
- $17,379
- Est. tax owed @ 24.0%
- −$4,171
- After-tax cash flow
- $12,201/yr
For passive investors: Depreciation is non-cash, so a rental often shows a tax loss while cash-flowing — sheltering income. Rental losses are passive: they offset passive income freely, and up to $25,000/yr can offset ordinary (W-2) income if you actively participate and your MAGI is under $100k (phasing out to $0 by $150k); unused losses carry forward. On sale, claimed depreciation is recaptured at up to 25%, and gains may owe capital-gains tax (a 1031 exchange can defer both). Figures are a year-1 estimate at your 24.0% rate — not tax advice; consult a CPA.
Schools (NCES district)
- District
- Kennewick School District
- NCES district ID
- 5303930
- Math proficiency
- 43% ▼ -1.00%
- Reading proficiency
- 58% ▬ 0.00%
- Median HH income
- $54,191
- Composite
- 45.56/100
- National rank
- #5667
- State rank
- #141 of 291 in WA
Livability — Kennewick
- Score
- 78/100
- State rank
- #131
- US rank
- #2599
Category grades
Schools grade is shown separately in the Schools card above.
Census & demographics
- Census place
- Kennewick, WA
- County
- Benton County · 186,895 people
- City population
- 104,655
- Metro
- Kennewick-Richland, WA
- Population (ZIP)
- 50,735
- Household income
- $62,527
- Rent vs Own
- Severe rent burden
- 2605.0
Population outlook (Benton County) Hauer SSP2
- Today (2025)
- 219,421 people
- By 2030
- 233,813 · +6.6%
- By 2040
- 262,134 · +19.5%
- By 2050
- 290,100 · +32.2%
- By 2075
- 363,525 · +65.7%
- By 2100
- 418,667 · +90.8%
Race, ethnicity, and origin ACS 2023
- Neighborhood character
- Diverse neighborhood (Simpson 0.56)
- Race & ethnicity
- White 55% Hispanic / Latino 37% Two or more races 15% Black 3% Asian 2% Native American 1%
- Hispanic origin (detail)
- Mexican 31% Cuban 2%
- Common ancestry
- Portuguese 4% Slovak 3% Romanian 1%
- Foreign-born
- 16% · Canada, Jamaica
- Languages at home
- 68% English-only · Spanish 29% Arabic 1%
Political lean MEDSL · Benton
- 2024 margin
- Strong R (+21.9) · D 37.7% · R 59.6% · Other 2.7%
- 2008→2024 swing
- +4.2pp toward D · 2008: -26.1pp · 2024: -21.9pp
- All cycles
- 2024: R+21.9 2020: R+21.0 2016: R+26.6 2012: R+27.0 2008: R+26.1
Not yet ingested
- Civics
- —
Market trends
- HPI YoY
- ▼ -408.26%
- Current HPI
- 256.1143
- Rent YoY
- ▲ 3.39%
- Metro
- Kennewick-Richland, WA
- State GDP YoY
- ▲ 4.65%
- F500 in state
- 22
Industry mix (Fortune 500 HQ in WA)
| Industry | F500 HQs | Revenue |
|---|---|---|
| Retail | 2 | $269B |
|
||
| Technology / Retail | 1 | $638B |
|
||
| Technology | 1 | $245B |
|
||
| Telecommunications | 1 | $38B |
|
||
| Food / Beverage | 1 | $36B |
|
||
| Automotive / Trucks | 1 | $34B |
|
||
Price history
-98.7% since first listed12 events — show timeline
- 2026-06-01 Listed $1,695 PACMLS
- 2025-06-20 Sold (MLS) $1,595 PACMLS
- 2025-05-13 Listed $1,595 PACMLS
- 2024-12-02 Sold (MLS) $1,595 PACMLS
- 2024-11-18 Listed $1,595 PACMLS
- 2012-05-09 Sold (Public Records) $129,900 Public Records
- 2012-05-09 Sold (MLS) $129,900 PACMLS
- 2011-12-09 Listed $129,900 PACMLS
- 2009-11-25 Sold (Public Records) $136,925 Public Records
- 2009-11-25 Sold (MLS) $136,925 PACMLS
- 2009-02-11 Sold (Public Records) $54,360 Public Records
- 2009-01-01 Listed $131,900 PACMLS
Property tax history
+2.8%/yrLatest (2026): $1,952 · -7.9% YoY. Source: county tax records.
Cash-flow waterfall
monthlySold comps — $/sqft
last 12 mo · ≤1 miLoading sold comps…