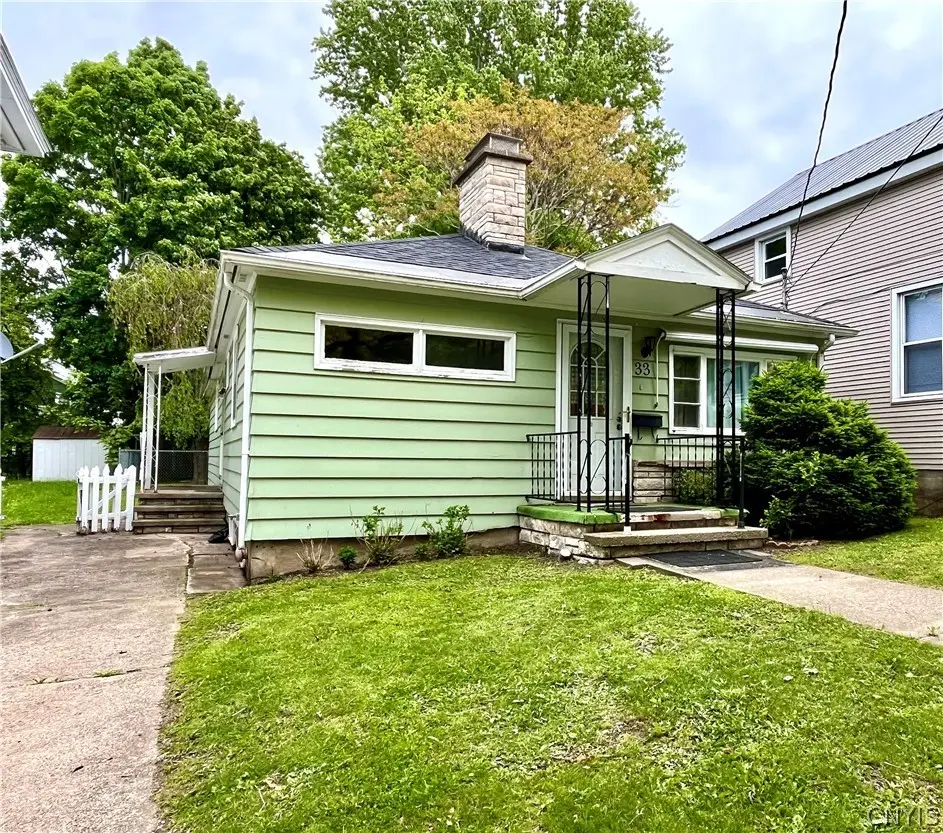
33 W 9th St · Oswego, NY
Flood risk 1/10 · Minimal
- FEMA flood zone
- X (unshaded)
- Chance of flooding over 30 yrs
- 0.0%
- Est. flood insurance / yr
- $473 – $860
Fire risk 3/10 · Minor
- Est. fire insurance / yr
- $691 – $1,283
Heat risk 2/10 · Minimal
- Hot days now (above 93°F)
- 7 days/yr
- Hot days in 30 yrs
- 17 days/yr
Wind risk 1/10 · Minimal
- Chance of severe wind over 30 yrs
- 0.0%
Air-quality risk 2/10 · Minimal
- Unhealthy air days now
- 2 days/yr
- Unhealthy air days in 30 yrs
- 2 days/yr
Risk factors via First Street. Map © Google.
Why this score? — see what drove the B grade
The composite is a weighted blend of 9 inputs, each scored 0–100. Each bar is that input's sub-score; the figure is the points it added to the 100-point composite (weight × sub-score).
- Cash flow +30.0/30.0
- DSCR +10.0/10.0
- 1% rule +8.3/10.0
- ARV discount +5.5/15.0
- Rent growth +5.0/5.0
- Appreciation +3.9/10.0
- Schools +3.8/10.0
- Livability +3.8/5.0
- Condition / age +2.5/5.0
$129,900
🖨 Deal sheet 📄 Offer letter ✓ Due diligence
Listing remarks
You will enjoy Easy One floor Living in this Terrific City RANCH with CHARM! This home has so much to offer including: Spacious Living Room with a Real Wood burning fireplace & Mantel, Hardwood flooring, built in shelving and cabinets, and lead glass window! There are two nicely sized bedrooms, a first floor laundry area, Huge country kitchen with space to eat in, and lots of real wood cabinets for lots of storage space. The BONUS ROOM has sliders to the back yard and could be a family room/den or make it a third bedroom if that meets your needs. The Roof is NEW (10/2025) and there is a Full Dry Basement too! PLUS * * * Outside you will find a pleasant fully fenced yard with mat
Key facts
- Huge country kitchen
- One floor living
- Fully fenced yard
Tags
Property features AI
Exterior
- Parking: No garage
- Utilities: Electricity connected; Public water connected; Sewer connected
- Home design: Single-story; Existing construction; Facing information not provided
- Construction: Wood siding; Asphalt shingle roof; Block foundation; Resale condition; Built previously (existing)
- Exterior features: Concrete driveway; Open patio; Patio; Porch
Interior
- Kitchen: Eat-in kitchen
- Bedrooms: 2 main-level bedrooms
- Flooring: Ceramic tile; Hardwood; Vinyl; Varies
- Bathrooms: 1 full bathroom (main level)
- Heating & cooling: Gas heating; Baseboard heating; Hot water heating
- Interior features: Ceiling fan(s); Eat-in kitchen; Separate/formal living room; Sliding glass door(s); Sliding doors; Bedroom on main level; Has basement (full)
- Laundry & utility: Main-level laundry
Neighborhood map
What this means for you Summary
Snapshot
- This is a 3-bed/1.0-bath single-family listed at $130k.
Deal economics
- At list price, monthly cash flow is $515 ($6k/yr) — positive.
- The deal already cash-flows at list — no discount required.
- Meets the 1% rule at list price ($2k rent vs $130k).
- Recommended offer: $128k (1.5% below list) — sets the bar for market timing.
- Cap rate 11.1% vs local median 8.8% in Oswego — meaningfully above typical; check what's discounted (condition, days-on-market, listing class) to confirm the premium yield is real.
Location & tenants
- Location reads 75/100 on livability (#265 in NY, #4,189 nationally) — a middle-class / working-renter tenant base. Strengths: cost of living A+, housing A+, health & safety A+; Watch: schools D+, crime F, commute F.
- Oswego City School District (town): math 39% / reading 51% proficiency, ranked #465 of 590 in NY (top 79%) — families likely to look elsewhere, expect single-tenant / working-renter base with shorter leases.
- Market conditions: Rents rising fast (+19.2%/yr); 168 active listings in the ZIP; 17 comparable units currently listed for rent nearby; rentals at typical pace (median 14d on market — plan ~3-4 weeks tenant-placement turnaround); 172 units permitted in Oswego County in 2024 (27 in 5+ unit buildings).
- This rent runs 32% of the median local income ($65k/yr) — at the standard rent-burdened threshold; future hikes will face affordability resistance.
Forward outlook
- Local home prices are declining (-2.2%/yr); year-one equity from $898 of loan paydown is wiped out by about $3k of value loss. Plan a longer hold.
- Oswego County population projected at -23% by 2050 — secular population decline; favor cash flow + early exit over multi-decade hold.
- At projected returns (-2.2% appreciation + 8.0% rent growth), your $36k cash investment doubles in ~6 years — after that, you're playing with house money.
Negotiation context
- It's been on market 20 days — a 2% lower offer ($128k) is reasonable based on typical stale-listing flexibility.
Questions for the listing agent
- Built in 1960 — when were the roof, HVAC, electrical panel, plumbing, and water heater last replaced?
- Is there a deadline driving the sale (1031 exchange, divorce, estate, relocation)? That informs how much negotiation room exists.
- Schools are D-rated, which usually means shorter tenancies and higher turnover. Who's the typical renter profile here, and what's been the actual vacancy rate?
- Crime grade is F in this area — have there been break-ins, vandalism, or insurance claims at this property in the last 3 years? What carrier currently insures it and at what premium?
- What's the average days-on-market for RENTAL listings here right now (not sales)? A rising rental-DOM trend means longer vacancies and softer asking-rent achievability than the comps imply.
- What's the recent tenant-quality profile in this submarket — average credit score on applications, eviction rate, late-payment / NSF rate, and stable-employment percentage? A property-management company in the area should have these aggregated.
- How much new for-sale + rental construction is in the pipeline within 1–3 miles? Heavy new supply typically softens prices + rents 12–24 months out; constrained supply supports both.
Investment metrics
- 1% rule
- 1.33% ✓
- Cap rate
- 11.05%
- Cash-on-cash
- 17.00%
- DSCR
- 1.76
- GRM
- 6.3
CMA / ARV
- ARV (on-the-fly)
- $124,320
- Comps found
- 12
Show comp detail 12 sales within ~0.75 mi
| Address | Dist | Beds/Ba | Sqft | Sold | Price | $/sf | Match |
|---|---|---|---|---|---|---|---|
| 70 Liberty St | 0.26mi | 3/1.0 | 1,155 (+4%) | 2mo | $127,000 | $110 | 80 |
| 9 SW 9th St | 0.15mi | 3/2.0 | 1,050 (-5%) | 2mo | $137,000 | $130 | 78 |
| 33 1/2 Dublin St | 0.28mi | 3/1.0 | 1,178 (+6%) | 6mo | $113,700 | $97 | 71 |
| 68 Bronson St | 0.44mi | 2/1.0 (-1) | 1,108 (-0%) | 4mo | $165,000 | $149 | 71 |
| 94 Niagara St | 0.59mi | 3/1.0 | 1,108 (-0%) | 3mo | $135,000 | $122 | 70 |
| 20 Governor St | 0.39mi | 3/1.0 | 1,187 (+7%) | 8mo | $165,000 | $139 | 64 |
| 41 W Van Buren St | 0.51mi | 2/1.5 (-1) | 1,038 (-6%) | 1mo | $100,000 | $96 | 57 |
| 87 W 9th St | 0.46mi | 3/1.0 | 1,198 (+8%) | 12mo | $52,500 | $44 | 55 |
| 171 W Seneca St | 0.29mi | 4/2.0 (+1) | 1,247 (+12%) | 9mo | $119,000 | $95 | 49 |
| 78 Varick St | 0.70mi | 2/2.0 (-1) | 1,180 (+6%) | 4mo | $132,500 | $112 | 44 |
| 258 W Fifth St | 0.55mi | 2/1.0 (-1) | 1,215 (+10%) | 12mo | $75,000 | $62 | 44 |
| 57 Varick St | 0.74mi | 3/1.0 | 1,257 (+13%) | 10mo | $143,000 | $114 | 35 |
Match score weights: distance 35% · size 25% · config 20% · recency 20%. Top-matched comps best support the ARV.
Projected returns pro-forma
-2.25% appreciation · 8.0% rent growth · sell at horizon
- IRR
- 15.5%
- Equity multiple
- 1.69×
- Total profit
- $24,968
- Equity at exit
- $23,733
- IRR
- 26.4%
- Equity multiple
- 4.00×
- Total profit
- $109,002
- Equity at exit
- $18,874
Cash invested: $36,372 (down + closing). Projections, not guarantees.
Landlord ↔ Tenant lean methodology
- Overall (STATE)
- 15 Strongly Tenant-Friendly
- State New York
- 15 Strongly Tenant-Friendly · D+10
- County
- — inherits STATE
- City
- — inherits STATE
ZIP-level market 13126
- Home prices YoY
- -0.8%
- Rents YoY
- 19.2%
- Active inventory
- 168
- Price-to-rent
- 6.3×
Monthly cashflow live
- Estimated rent
- $1,722 high interval (Pro) →
- Mortgage (P&I)
- −$681
- Tax from tax record
- −$109 /mo · $1,313/yr
- Insurance
- −$54
- HOA
- −$0
- Vacancy / Maint / Mgmt
- −$362
- Net cashflow
- $515
Break-even live
UW: 25.0% down · 7.5% · 30yr · 1.5% tax · 5.0% vac · 8.0% maint · 8.0% mgmt
Financing live
Cash to close
- Down payment
- $32,475
- Closing costs
- $3,897
- Reserves months
- —
- Total cash needed
- —
Loan-product check · same deal, 3 products live
Conventional
25% down · 7.5% · 30yr
- Down + closing
- —
- Monthly P&I
- —
- Monthly cashflow
- —
- DSCR
- —
- Eligible?
- —
Personal DTI + credit; lowest rate.
DSCR
20% down · 8.5% · 30yr
- Down + closing
- —
- Monthly P&I
- —
- Monthly cashflow
- —
- DSCR
- —
- Eligible?
- —
No personal income docs; deal must DSCR.
Hard money
10% down · 12.0% · 12mo
- Down + closing
- —
- Monthly P&I
- —
- Monthly cashflow
- —
- DSCR
- —
- Eligible?
- —
Short-term bridge; refi at stabilization.
Rent comps 17 comps
| Address | Beds | Baths | Sqft | Rent | $/sqft | DOM | Units | Dist |
|---|---|---|---|---|---|---|---|---|
| 6 Lathrop St Oswego, NY | 3.0 | 1.0 | 1100 | $1,725 | $1.57 | 14d | 1 | 0.13mi |
| 95 Ontario St Unit 2 Oswego, NY | 2.0 | 1.0 | 749 | $1,300 | $1.74 | 14d | 1 | 0.17mi |
| 141 W Cayuga St Oswego, NY | 4.0 | 1.0 | 1311 | $2,100 | $1.60 | 14d | 1 | 0.18mi |
| 135 W Mohawk St Oswego, NY | 3.0 | 1.0 | 1103 | $1,700 | $1.54 | 14d | 1 | 0.18mi |
| 161 W Bridge St Unit A Oswego, NY | 4.0 | 2.0 | 1400 | $2,240 | $1.60 | 14d | 1 | 0.23mi |
| 153 W Seneca St Unit 1 Oswego, NY | 2.0 | 1.5 | 1000 | $1,540 | $1.54 | 44d | 1 | 0.28mi |
| 188 W Bridge St Oswego, NY | 4.0 | 1.0 | 1008 | $1,800 | $1.79 | 14d | 1 | 0.31mi |
| 39 W 6th St Unit 2-A Oswego, NY | 3.0 | 1.0 | 1500 | $1,725 | $1.15 | 14d | 1 | 0.32mi |
| 164 W Schuyler St Unit A Oswego, NY | 3.0 | 2.0 | 1400 | $1,755 | $1.25 | 14d | 1 | 0.36mi |
| 165 W 3rd St Unit 3 Oswego, NY | 2.0 | 1.0 | 1000 | $1,445 | $1.45 | 44d | 1 | 0.36mi |
| 165 W 3rd St Unit 4 Oswego, NY | 2.0 | 1.0 | 1000 | $1,495 | $1.50 | 14d | 1 | 0.36mi |
| 25 W Mohawk St Unit TH Oswego, NY | 3.0 | 1.0 | 1150 | $1,745 | $1.52 | 44d | 1 | 0.38mi |
| 188 W 2nd St Unit 1 Oswego, NY | 2.0 | 1.0 | 900 | $1,695 | $1.88 | 21d | 1 | 0.39mi |
| 188 W 2nd St Unit 6 Oswego, NY | 2.0 | 1.0 | 800 | $1,595 | $1.99 | 21d | 1 | 0.39mi |
| 23 W Mohawk St Unit 3 Oswego, NY | 2.0 | 1.0 | 800 | $1,595 | $1.99 | 44d | 1 | 0.39mi |
| 64 E 5th St Unit 1 Oswego, NY | 2.0 | 1.0 | 900 | $1,300 | $1.44 | 44d | 1 | 0.83mi |
| 14 Pond Path Oswego, NY | 3.0 | 1.5 | 1408 | $2,300 | $1.63 | 14d | 1 | 1.30mi |
Listing history 14 events
-
2026-06-18days on market $129,900 Active 20 DOM
-
2026-06-17days on market $129,900 Active 19 DOM
-
2026-06-16days on market $129,900 Active 18 DOM
-
2026-06-15days on market $129,900 Active 17 DOM
-
2026-06-14days on market $129,900 Active 15 DOM
-
2026-06-13days on market $129,900 Active 14 DOM
-
2026-06-10days on market $129,900 Active 12 DOM
-
2026-06-08days on market $129,900 Active 10 DOM
-
2026-06-07pricedays on market $129,900 Active 9 DOM
-
2026-06-02days on market $139,900 Active 4 DOM
-
2026-06-01days on market $139,900 Active 3 DOM
-
2026-05-31days on market $139,900 Active 2 DOM
-
2026-05-30remarks 695-char remark
-
2026-05-30$139,900 Active 1 DOM
ⓘ Source: listings_history table (triggers on properties + properties_extension) + one-shot
backfill from property_details.listing_events for pre-trigger history.
Tax reassessment forecast NY · Partial reset (capped growth)
- Current annual tax
- $1,313 · $109/mo
- Projected year-2 tax
- $1,754 · $146/mo
- Expected delta
- +$441/yr (+$37/mo · 33.6%)
ⓘ Screening estimate from a state-policy table — verify with the county assessor before closing.
Climate risk First Street
- Flood 1/10 Low FEMA zone X (unshaded) · 0% chance over 30 yrs
- Wildfire 3/10 Moderate
- Heat 2/10 Low 7 d/yr ≥93°F today · 17 d/yr by 30 yrs out
- Wind 1/10 Low 0% chance of damaging wind over 30 yrs
- Air quality 2/10 Low 2 unhealthy d/yr today · 2 by 30 yrs out
Nearby sold comps map
Loading sold comps map…
Walkable amenities ~0.75 mi
Loading nearby amenities…
Taxation est. · year 1
- Rental income
- $20,659
- − Mortgage interest
- −$7,276
- − Property taxes
- −$1,313
- − Insurance
- −$650
- − Repairs & maintenance
- −$1,653
- − Management
- −$1,653
- − Depreciation
- −$3,779
- Taxable income
- $4,336
- Est. tax owed @ 24.0%
- −$1,041
- After-tax cash flow
- $5,144/yr
For passive investors: Depreciation is non-cash, so a rental often shows a tax loss while cash-flowing — sheltering income. Rental losses are passive: they offset passive income freely, and up to $25,000/yr can offset ordinary (W-2) income if you actively participate and your MAGI is under $100k (phasing out to $0 by $150k); unused losses carry forward. On sale, claimed depreciation is recaptured at up to 25%, and gains may owe capital-gains tax (a 1031 exchange can defer both). Figures are a year-1 estimate at your 24.0% rate — not tax advice; consult a CPA.
Schools (NCES district)
- District
- Oswego City School District
- NCES district ID
- 3622050
- Math proficiency
- 39% ▼ -7.00%
- Reading proficiency
- 51% ▲ 9.00%
- Median HH income
- $45,835
- Composite
- 38.2/100
- National rank
- #4257
- State rank
- #465 of 590 in NY
Livability — Oswego
- Score
- 75/100
- State rank
- #265
- US rank
- #4189
Category grades
Schools grade is shown separately in the Schools card above.
Census & demographics
- Census place
- Oswego, NY
- County
- Oswego County · 36,495 people
- City population
- 36,495
- Metro
- Syracuse, NY
- Population (ZIP)
- 36,495
- Household income
- $65,346
- Rent vs Own
- Severe rent burden
- 1341.0
Population outlook (Oswego County) Hauer SSP2
- Today (2025)
- 114,465 people
- By 2030
- 109,968 · -3.9%
- By 2040
- 99,205 · -13.3%
- By 2050
- 87,979 · -23.1%
- By 2075
- 65,100 · -43.1%
- By 2100
- 47,117 · -58.8%
Race, ethnicity, and origin ACS 2023
- Neighborhood character
- Predominantly White (87%)
- Race & ethnicity
- White 87% Hispanic / Latino 5% Two or more races 5% Black 2% Asian 2%
- Hispanic origin (detail)
- Mexican 1% Puerto Rican 2%
- Common ancestry
- Romanian 6% Lithuanian 4% Italian 2%
- Foreign-born
- 3% · Canada
- Languages at home
- 93% English-only · Spanish 3% Other Asian/Pacific 1% Other Indo-European 1%
Political lean MEDSL · Oswego
- 2024 margin
- Strong R (+24.2) · D 37.9% · R 62.1%
- 2008→2024 swing
- -26.6pp toward R · 2008: 2.5pp · 2024: -24.2pp
- All cycles
- 2024: R+24.2 2020: R+20.2 2016: R+23.2 2012: D+7.9 2008: D+2.5
Not yet ingested
- Civics
- —
Market trends
- HPI YoY
- ▼ -2.25%
- Current HPI
- 295.5134
- Rent YoY
- ▲ 19.18%
- Metro
- Syracuse, NY
- State GDP YoY
- ▲ 2.60%
- F500 in state
- 92
Industry mix (Fortune 500 HQ in NY)
| Industry | F500 HQs | Revenue |
|---|---|---|
| Financial Services | 10 | $950B |
|
||
| Consumer Goods | 9 | $162B |
|
||
| Insurance | 4 | $225B |
|
||
| Telecommunications | 2 | $144B |
|
||
| Pharmaceuticals | 2 | $112B |
|
||
| Media / Entertainment | 2 | $69B |
|
||
Price history
1 event — show timeline
- 2026-05-29 Listed $139,900 CNYIS
Property tax history
+11.1%/yrLatest (2025): $1,313 · +10.8% YoY. Source: county tax records.
Cash-flow waterfall
monthlySold comps — $/sqft
last 12 mo · ≤1 miLoading sold comps…