 Triplex
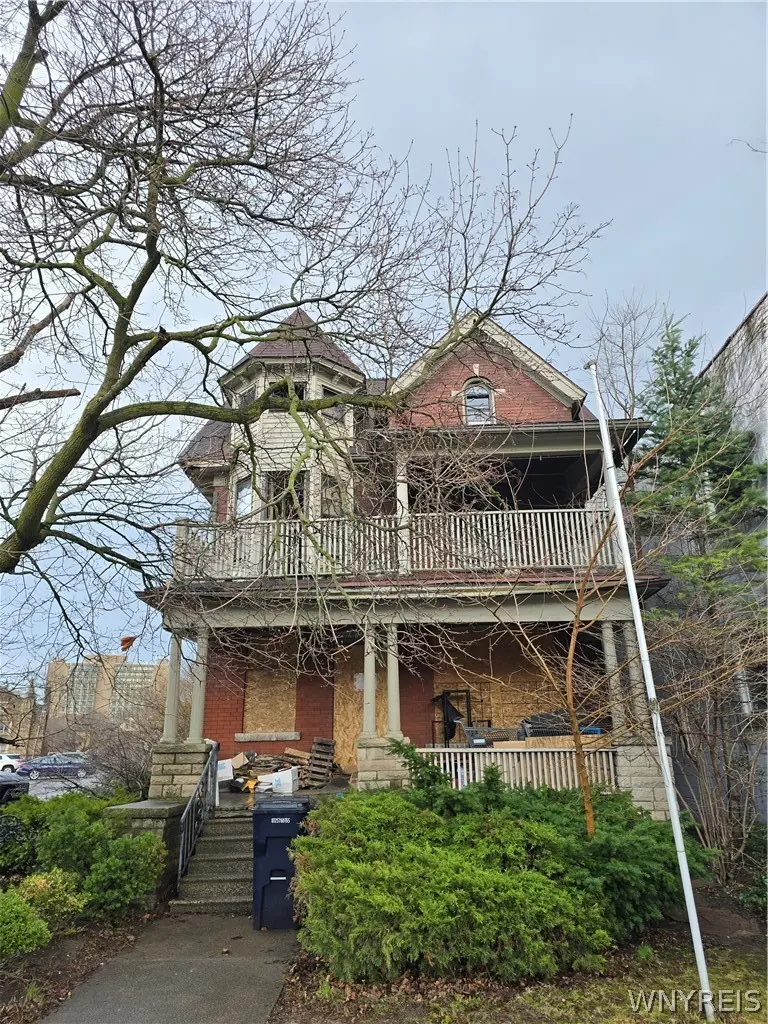
729 Main St · Niagara Falls, NY
Flood risk 1/10 · Minimal
- FEMA flood zone
- X (unshaded)
- Chance of flooding over 30 yrs
- 0.0%
- Est. flood insurance / yr
- $473 – $860
Fire risk 3/10 · Minor
- Est. fire insurance / yr
- $691 – $1,283
Heat risk 2/10 · Minimal
- Hot days now (above 94°F)
- 7 days/yr
- Hot days in 30 yrs
- 15 days/yr
Wind risk 1/10 · Minimal
- Chance of severe wind over 30 yrs
- —
Air-quality risk 2/10 · Minimal
- Unhealthy air days now
- 1 days/yr
- Unhealthy air days in 30 yrs
- 2 days/yr
Risk factors via First Street. Map © Google.
Why this score? — see what drove the A- grade
The composite is a weighted blend of 9 inputs, each scored 0–100. Each bar is that input's sub-score; the figure is the points it added to the 100-point composite (weight × sub-score).
- Cash flow +30.0/30.0
- 1% rule +10.0/10.0
- DSCR +10.0/10.0
- Appreciation +10.0/10.0
- ARV discount +7.5/15.0
- Rent growth +4.7/5.0
- Livability +3.0/5.0
- Schools +2.5/10.0
- Condition / age +2.5/5.0
$99,999
🖨 Deal sheet (PDF) 📄 Offer letter ✓ Due diligence
Multi-family units
County records classify this as Multi-Family (2-4 Unit). Listing-text estimate: 3 units. confirmed
Listing remarks MLS
Here's a massive beautifully reserved 100-year-old brick three-family property located at 729 Main Street in Niagara Falls, NY. Each of the three units features several rooms bedrooms, 1 full bathroom, a spacious living room, and a formal dining room. Two units offer private porches, while the third includes a walk-off balcony perfect for outdoor relaxation. This property is equipped with four electric meters, eight gas lines and three gas meters, three boilers, three hot water tanks, one brand-new furnace, and newer PEX and PVC plumbing lines. Situated right beside Niagara Falls City Hall, this prime location offers incredible convenience and investment potential. The American Falls Bridge to Canada is just 3 minutes away, the Niagara Falls Aquarium is 2 minutes away, and Goat Island at Niagara Falls State Park is only an 8-minute drive. Not to mention, just one block away from great tourist shops, restaurants, bars and amusement and entertainment venues. Ideal for short-term rental opportunities, owner-occupants, or traditional investment purposes. A rare chance to own a versatile multi-family property in the heart of the resurging city of Niagara Falls.
Key facts
- Three boilers
- Four gas meters
- Private porches
Tags
Neighborhood map
What this means for you Summary
Snapshot
- This is a 3 × 3-bed/1.0-bath units multifamily listed at $100k.
Deal economics
- At list price, monthly cash flow is $2k ($30k/yr) — positive. Per door: $825/mo.
- The deal already cash-flows at list — no discount required.
- Meets the 1% rule at list price ($4k rent vs $100k).
- Recommended offer: $97k (3.0% below list) — sets the bar for market timing.
- Cap rate 36.0% vs local median 7.7% in Niagara Falls — top-decile yield for the area; either an underpriced asset or a hidden risk that comps aren't pricing in. Stress-test before assuming the spread holds.
Location & tenants
- Location reads 60/100 on livability (#956 in NY) — a middle-class / working-renter tenant base. Strengths: cost of living A+, housing A+; Watch: schools F, crime F, amenities F.
- Niagara Falls City School District (urban): math 26% / reading 34% proficiency, ranked #578 of 590 in NY (top 98%) — families likely to look elsewhere, expect single-tenant / working-renter base with shorter leases; 66% free/reduced lunch — lower-income household profile, screen leases tightly.
- Market conditions: Rents rising fast (+8.8%/yr); 164 active listings in the ZIP; lower-income renter base — watch delinquency; 167 units permitted in Niagara County in 2024 (0 in 5+ unit buildings).
- At $4,008/mo this rent would consume 139% of the median local household income ($35k/yr) (locally 954% of renters already pay >50% of income on rent) — very limited rent-growth headroom before tenants either downsize or default.
Forward outlook
- In year one you build about $11k of equity ($691 loan paydown + $10k appreciation (10.0% local appreciation)).
- Niagara County population projected at -19% by 2050 — secular population decline; favor cash flow + early exit over multi-decade hold.
- At projected returns (10.0% appreciation + 8.0% rent growth), your $28k cash investment doubles in ~1 year — after that, you're playing with house money.
- By year 4, paydown + projected appreciation supports a ~$38k cash-out refi (75% LTV) — recoverable capital for the next deal without selling this one.
Negotiation context
- It's been on market 57 days — a 3% lower offer ($97k) is reasonable based on typical stale-listing flexibility.
- 2 sale attempts since 9y ago; this cycle's ask has dropped $40k (29%) from the opening price — seller is motivated, your offer sets the floor, not the list.
- Current owner paid $80k; 25% above their basis — modest negotiation headroom, anchor on the comps not their cost.
Risks & watch-outs
- Watch-outs: built in 1900 — expect roof / HVAC / electrical / plumbing capex.
Questions for the listing agent
- It's been on market 57 days. Have you received any prior offers? Is the seller open to a 3% concession, seller financing, or rate buy-down credit?
- Can we see the unit-by-unit rent roll, current vacancy, and any below-market leases? What's the average tenancy length?
- What capital expenditures (roof, boiler, parking lot, exteriors) have been made in the last 5 years, and what's planned in the next 2?
- Built in 1900 — when were the roof, HVAC, electrical panel, plumbing, and water heater last replaced?
- Is there a deadline driving the sale (1031 exchange, divorce, estate, relocation)? That informs how much negotiation room exists.
- Schools are F-rated, which usually means shorter tenancies and higher turnover. Who's the typical renter profile here, and what's been the actual vacancy rate?
- Crime grade is F in this area — have there been break-ins, vandalism, or insurance claims at this property in the last 3 years? What carrier currently insures it and at what premium?
- What's the average days-on-market for RENTAL listings here right now (not sales)? A rising rental-DOM trend means longer vacancies and softer asking-rent achievability than the comps imply.
- What's the recent tenant-quality profile in this submarket — average credit score on applications, eviction rate, late-payment / NSF rate, and stable-employment percentage? A property-management company in the area should have these aggregated.
- How much new apartment / multifamily construction is in the pipeline within 1–3 miles? Heavy new supply (>2% of stock underway) typically softens rents 12–24 months out; light construction supports rent growth.
Investment metrics
- 1% rule
- 4.01% ✓
- Cap rate
- 36.00%
- Cash-on-cash
- 106.08%
- DSCR
- 5.72
- GRM
- 2.1
CMA / ARV
- ARV (median comp)
- $226,077
- List price
- $99,999
- Delta
- -55.77%
- Verdict
- UNDERPRICED
- Comps
- 20 within 1.0 mi
Show comp detail 1 sale within ~0.75 mi
| Address | Dist | Beds/Ba | Sqft | Sold | Price | $/sf | Match |
|---|---|---|---|---|---|---|---|
| 515 4th St | 0.29mi | 6/3.0 (+1) | 4,064 (-1%) | 6mo | $131,000 | $32 | 61 |
Match score weights: distance 35% · size 25% · config 20% · recency 20%. Top-matched comps best support the ARV.
Projected returns pro-forma
10.0% appreciation · 8.0% rent growth · sell at horizon
- IRR
- —
- Equity multiple
- 9.33×
- Total profit
- $233,354
- Equity at exit
- $90,087
- IRR
- —
- Equity multiple
- 22.99×
- Total profit
- $615,808
- Equity at exit
- $194,276
Cash invested: $28,000 (down + closing). Projections, not guarantees.
Landlord ↔ Tenant lean methodology
- Overall (STATE)
- 15 Strongly Tenant-Friendly
- State New York
- 15 Strongly Tenant-Friendly · D+10
- County
- — inherits STATE
- City
- — inherits STATE
ZIP-level market 14301
- Home prices YoY
- 6.2%
- Rents YoY
- 8.8%
- Active inventory
- 164
- Price-to-rent
- 6.2×
Monthly cashflow live
- Estimated rent
- $4,008 high interval (Pro) →
- Mortgage (P&I)
- −$524
- Tax est. 1.5%
- −$125 /mo · $1,500/yr
- Insurance
- −$42
- HOA
- −$0
- Vacancy / Maint / Mgmt
- −$842
- Net cashflow
- $2,475
Break-even live
Sensitivity live
| Price | -10% $2,544 | -5% $2,510 | +0% $2,475 | +5% $2,441 | +10% $2,406 |
|---|---|---|---|---|---|
| Rent | -10% $2,159 | -5% $2,317 | +0% $2,475 | +5% $2,634 | +10% $2,792 |
| Rate | -1.0pp $2,526 | -0.5pp $2,501 | base $2,475 | +0.5pp $2,449 | +1.0pp $2,423 |
3-unit breakdown (identical units grouped — click to expand)
| Units | Beds | Baths | Est. rent |
|---|---|---|---|
| 3× units | 3 | 1 | $4,008 |
| #1 | 3 | 1 | $1,336 |
| #2 | 3 | 1 | $1,336 |
| #3 | 3 | 1 | $1,336 |
| Total (3 units) | $4,008 | ||
UW: 25.0% down · 7.5% · 30yr · 1.5% tax · 5.0% vac · 8.0% maint · 8.0% mgmt
Financing live
Cash to close
- Down payment
- $25,000
- Closing costs
- $3,000
- Reserves months
- —
- Total cash needed
- —
Loan-product check · same deal, 3 products live
Conventional
25% down · 7.5% · 30yr
- Down + closing
- —
- Monthly P&I
- —
- Monthly cashflow
- —
- DSCR
- —
- Eligible?
- —
Personal DTI + credit; lowest rate.
DSCR
20% down · 8.5% · 30yr
- Down + closing
- —
- Monthly P&I
- —
- Monthly cashflow
- —
- DSCR
- —
- Eligible?
- —
No personal income docs; deal must DSCR.
Hard money
10% down · 12.0% · 12mo
- Down + closing
- —
- Monthly P&I
- —
- Monthly cashflow
- —
- DSCR
- —
- Eligible?
- —
Short-term bridge; refi at stabilization.
Listing history 22 events
-
2026-06-18days on market $99,999 Active 57 DOM
-
2026-06-17days on market $99,999 Active 56 DOM
-
2026-06-16days on market $99,999 Active 55 DOM
-
2026-06-15days on market $99,999 Active 54 DOM
-
2026-06-13days on market $99,999 Active 52 DOM
-
2026-06-13days on market $99,999 Active 51 DOM
-
2026-06-10days on market $99,999 Active 49 DOM
-
2026-06-09days on market $99,999 Active 48 DOM
-
2026-06-08days on market $99,999 Active 47 DOM
-
2026-06-07days on market $99,999 Active 46 DOM
-
2026-06-03days on market $99,999 Active 42 DOM
-
2026-06-02days on market $99,999 Active 41 DOM
-
2026-06-01days on market $99,999 Active 40 DOM
-
2026-05-31days on market $99,999 Active 39 DOM
-
2026-04-21$140,000 Active 1174-char remark
Show marketing remark (1174 chars)
Here's a massive beautifully reserved 100-year-old brick three-family property located at 729 Main Street in Niagara Falls, NY. Each of the three units features several rooms bedrooms, 1 full bathroom, a spacious living room, and a formal dining room. Two units offer private porches, while the third includes a walk-off balcony perfect for outdoor relaxation. This property is equipped with four electric meters, eight gas lines and three gas meters, three boilers, three hot water tanks, one brand-new furnace, and newer PEX and PVC plumbing lines. Situated right beside Niagara Falls City Hall, this prime location offers incredible convenience and investment potential. The American Falls Bridge to Canada is just 3 minutes away, the Niagara Falls Aquarium is 2 minutes away, and Goat Island at Niagara Falls State Park is only an 8-minute drive. Not to mention, just one block away from great tourist shops, restaurants, bars and amusement and entertainment venues. Ideal for short-term rental opportunities, owner-occupants, or traditional investment purposes. A rare chance to own a versatile multi-family property in the heart of the resurging city of Niagara Falls.
-
2018-01-26status Pending Sale
-
2018-01-18status Under Contract- Do Not Show
-
2017-11-20price $132,900
-
2017-10-11historical Continue to Show- Under Contract
-
2017-10-10historical
-
2017-08-11$140,000 Active
-
2017-01-26soldstatus $80,000
ⓘ Source: listings_history table (triggers on properties + properties_extension) + one-shot
backfill from property_details.listing_events for pre-trigger history.
Climate risk First Street
- Flood 1/10 Low FEMA zone X (unshaded) · 0% chance over 30 yrs
- Wildfire 3/10 Moderate
- Heat 2/10 Low 7 d/yr ≥94°F today · 15 d/yr by 30 yrs out
- Wind 1/10 Low
- Air quality 2/10 Low 1 unhealthy d/yr today · 2 by 30 yrs out
Nearby sold comps map
Loading sold comps map…
Walkable amenities ~0.75 mi
Loading nearby amenities…
Taxation est. · year 1
- Rental income
- $48,096
- − Mortgage interest
- −$5,601
- − Property taxes
- −$1,500
- − Insurance
- −$500
- − Repairs & maintenance
- −$3,848
- − Management
- −$3,848
- − Depreciation
- −$2,909
- Taxable income
- $29,890
- Est. tax owed @ 24.0%
- −$7,174
- After-tax cash flow
- $22,529/yr
For passive investors: Depreciation is non-cash, so a rental often shows a tax loss while cash-flowing — sheltering income. Rental losses are passive: they offset passive income freely, and up to $25,000/yr can offset ordinary (W-2) income if you actively participate and your MAGI is under $100k (phasing out to $0 by $150k); unused losses carry forward. On sale, claimed depreciation is recaptured at up to 25%, and gains may owe capital-gains tax (a 1031 exchange can defer both). Figures are a year-1 estimate at your 24.0% rate — not tax advice; consult a CPA.
Schools (NCES district)
- District
- Niagara Falls City School District
- NCES district ID
- 3620820
- Math proficiency
- 26% ▼ -10.00%
- Reading proficiency
- 34% ▲ 3.00%
- Median HH income
- $32,488
- Composite
- 24.5/100
- National rank
- #7655
- State rank
- #578 of 590 in NY
Livability — Niagara Falls
- Score
- 60/100
- State rank
- #956
- US rank
- #18749
Category grades
Schools grade is shown separately in the Schools card above.
Census & demographics
- Census place
- Niagara Falls, NY
- County
- Niagara County · 157,377 people
- City population
- 62,983
- Metro
- Buffalo-Cheektowaga, NY
- Population (ZIP)
- 10,923
- Household income
- $34,549
- Rent vs Own
- Severe rent burden
- 954.0
Population outlook (Niagara County) Hauer SSP2
- Today (2025)
- 204,149 people
- By 2030
- 197,900 · -3.1%
- By 2040
- 182,239 · -10.7%
- By 2050
- 165,198 · -19.1%
- By 2075
- 129,416 · -36.6%
- By 2100
- 96,222 · -52.9%
Race, ethnicity, and origin ACS 2023
- Neighborhood character
- Diverse neighborhood (Simpson 0.58)
- Race & ethnicity
- White 59% Black 25% Two or more races 8% Hispanic / Latino 8% Asian 2%
- Hispanic origin (detail)
- Puerto Rican 3% Cuban 2%
- Common ancestry
- Romanian 6% Slovak 2% Lithuanian 1%
- Foreign-born
- 5% · Canada, China, Dominican Republic
- Languages at home
- 90% English-only · Spanish 6% Other Indo-European 3% Chinese 1%
Political lean MEDSL · Niagara
- 2024 margin
- R (+14.9) · D 42.5% · R 57.5%
- 2008→2024 swing
- -15.9pp toward R · 2008: 1.0pp · 2024: -14.9pp
- All cycles
- 2024: R+14.9 2020: R+9.7 2016: R+19.0 2012: D+0.6 2008: D+1.0
Not yet ingested
- Civics
- —
Market trends
- HPI YoY
- ▲ 15.41%
- Current HPI
- 266.1457
- Rent YoY
- ▲ 8.79%
- Metro
- Buffalo-Cheektowaga, NY
- State GDP YoY
- ▲ 2.60%
- F500 in state
- 92
Industry mix (Fortune 500 HQ in NY)
| Industry | F500 HQs | Revenue |
|---|---|---|
| Financial Services | 10 | $950B |
|
||
| Consumer Goods | 9 | $162B |
|
||
| Insurance | 4 | $225B |
|
||
| Telecommunications | 2 | $144B |
|
||
| Pharmaceuticals | 2 | $112B |
|
||
| Media / Entertainment | 2 | $69B |
|
||
Price history
+75.0% since first listed8 events — show timeline
- 2026-04-21 Listed $140,000 WNYREIS
- 2018-01-26 Pending — WNYREIS
- 2018-01-18 Pending — WNYREIS
- 2017-11-20 Price Changed $132,900 WNYREIS
- 2017-10-11 Contingent — WNYREIS
- 2017-10-10 Listing Removed — WNYREIS
- 2017-08-11 Listed $140,000 WNYREIS
- 2017-01-26 Sold (Public Records) $80,000 Public Records
Property tax history
+21.1%/yrLatest (2025): $5,934 · +15.8% YoY. Source: county tax records.
Cash-flow waterfall
monthlySold comps — $/sqft
last 12 mo · ≤1 miLoading sold comps…