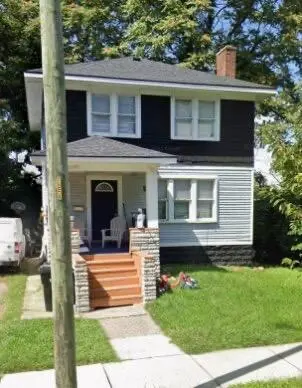
16871 Greydale Ave · Detroit, MI
Flood risk 1/10 · Minimal
- FEMA flood zone
- X (unshaded)
- Chance of flooding over 30 yrs
- 0.0%
- Est. flood insurance / yr
- $473 – $860
Fire risk 1/10 · Minimal
- Est. fire insurance / yr
- $784 – $1,456
Heat risk 3/10 · Minor
- Hot days now (above 98°F)
- 7 days/yr
- Hot days in 30 yrs
- 15 days/yr
Wind risk 2/10 · Minimal
- Chance of severe wind over 30 yrs
- —
Air-quality risk 3/10 · Minor
- Unhealthy air days now
- 2 days/yr
- Unhealthy air days in 30 yrs
- 3 days/yr
Risk factors via First Street. Map © Google.
Why this score? — see what drove the B- grade
The composite is a weighted blend of 9 inputs, each scored 0–100. Each bar is that input's sub-score; the figure is the points it added to the 100-point composite (weight × sub-score).
- Cash flow +26.7/30.0
- ARV discount +13.4/15.0
- DSCR +9.1/10.0
- 1% rule +6.7/10.0
- Rent growth +4.5/5.0
- Livability +3.7/5.0
- Condition / age +2.5/5.0
- Schools +1.3/10.0
- Appreciation +0.0/10.0
$120,000
🖨 Deal sheet 📄 Offer letter ✓ Due diligence
Listing remarks MLS
Charming brick colonial in Detroit's Old Redford neighborhood offering timeless character and strong potential for both homeowners and investors. This 3 bedroom, 1 bath home features over 1,300 square feet with spacious living areas, a natural fireplace, large windows providing abundant natural light, and classic original details throughout. The full basement offers additional storage or finishing possibilities, while the sizable backyard provides space to relax or entertain. Conveniently located near shopping, dining, major freeways, and neighborhood landmarks like the Redford Theatre. Property is also being offered via Auction. com, presenting a unique opportunity to purchase in one of Detroit's established west side communities.
Key facts
- Sizable backyard
- Natural fireplace
- Full basement
Tags
Property features AI
Exterior
- Utilities: Public water
- Home design: Colonial style; Single-family residence; Residential property
- Construction: Built in 1926; Brick, concrete, and wood siding construction
- Exterior features: Shingle roof; 0.15-acre lot
Interior
- Kitchen: Kitchen
- Bedrooms: Primary bedroom; Bedroom 2; Bedroom 3
- Bathrooms: 1 full bathroom
- Heating & cooling: Forced air heating
- Interior features: Fireplace; Total of 8 rooms; Michigan-style basement
Neighborhood map
What this means for you Summary
Snapshot
- This is a 3-bed/1.0-bath single-family listed at $120k.
Deal economics
- At list price, monthly cash flow is $323 ($4k/yr) — positive.
- The deal already cash-flows at list — no discount required.
- Meets the 1% rule at list price ($1k rent vs $120k).
- Recommended offer: $118k (1.5% below list) — sets the bar for market timing.
Location & tenants
- Location reads 73/100 on livability (#218 in MI) — a middle-class / working-renter tenant base. Strengths: amenities A+, commute A+, cost of living A+; Watch: schools F, crime F, employment F.
- Detroit Public Schools Community District (urban): math 10% / reading 24% proficiency, ranked #499 of 540 in MI (top 92%) — low school quality limits family demand, transient renter base, plan for 1-2y turnover; 90% free/reduced lunch — lower-income household profile, screen leases tightly.
- Market conditions: Rents rising fast (+8.0%/yr); 305 active listings in the ZIP; 39 comparable units currently listed for rent nearby; rentals at typical pace (median 24d on market — plan ~3-4 weeks tenant-placement turnaround); lower-income renter base — watch delinquency; 2,639 units permitted in Wayne County in 2024 (1,216 in 5+ unit buildings).
- This rent runs 39% of the median local income ($44k/yr) — at the standard rent-burdened threshold; future hikes will face affordability resistance.
Forward outlook
- Local home prices are declining (-3.0%/yr); year-one equity from $830 of loan paydown is wiped out by about $4k of value loss. Plan a longer hold.
- Wayne County population projected at -17% by 2050 — secular population decline; favor cash flow + early exit over multi-decade hold.
- At projected returns (-3.0% appreciation + 8.0% rent growth), your $34k cash investment doubles in ~7 years — after that, you're playing with house money.
Negotiation context
- It's been on market 28 days — a 2% lower offer ($118k) is reasonable based on typical stale-listing flexibility.
- 15 sale attempts since 27y ago with the ask held roughly flat each time — persistent listings suggest the price (not the market) is what's stuck; bring a comps-based counter.
- Current owner paid $6k; list at $120k implies a 1746% gain — meaningful room to come down on a strong offer.
Risks & watch-outs
- Watch-outs: built in 1926 — expect roof / HVAC / electrical / plumbing capex.
Questions for the listing agent
- Built in 1926 — when were the roof, HVAC, electrical panel, plumbing, and water heater last replaced?
- Is there a deadline driving the sale (1031 exchange, divorce, estate, relocation)? That informs how much negotiation room exists.
- Schools are F-rated, which usually means shorter tenancies and higher turnover. Who's the typical renter profile here, and what's been the actual vacancy rate?
- Crime grade is F in this area — have there been break-ins, vandalism, or insurance claims at this property in the last 3 years? What carrier currently insures it and at what premium?
- What's the average days-on-market for RENTAL listings here right now (not sales)? A rising rental-DOM trend means longer vacancies and softer asking-rent achievability than the comps imply.
- What's the recent tenant-quality profile in this submarket — average credit score on applications, eviction rate, late-payment / NSF rate, and stable-employment percentage? A property-management company in the area should have these aggregated.
- How much new for-sale + rental construction is in the pipeline within 1–3 miles? Heavy new supply typically softens prices + rents 12–24 months out; constrained supply supports both.
Investment metrics
- 1% rule
- 1.17% ✓
- Cap rate
- 9.53%
- Cash-on-cash
- 11.55%
- DSCR
- 1.51
- GRM
- 7.1
CMA / ARV
- ARV (on-the-fly)
- $137,970
- Comps found
- 12
Show comp detail 12 sales within ~0.75 mi
| Address | Dist | Beds/Ba | Sqft | Sold | Price | $/sf | Match |
|---|---|---|---|---|---|---|---|
| 16115 Westbrook St | 0.48mi | 3/1.5 | 1,312 (-0%) | 4mo | $77,400 | $59 | 72 |
| 17216 Chapel St | 0.24mi | 4/2.0 (+1) | 1,367 (+4%) | 5mo | $170,000 | $124 | 69 |
| 17580 Northrop St | 0.48mi | 3/1.5 | 1,294 (-2%) | 6mo | $135,000 | $104 | 68 |
| 16216 Westbrook St | 0.42mi | 3/1.5 | 1,378 (+5%) | 4mo | $72,500 | $53 | 67 |
| 16871 Pierson St | 0.49mi | 3/1.0 | 1,242 (-6%) | 3mo | $130,000 | $105 | 66 |
| 16166 W Parkway St | 0.62mi | 3/1.0 | 1,416 (+8%) | 4mo | $35,000 | $25 | 55 |
| 20821 Santa Clara | 0.56mi | 3/1.5 | 1,414 (+8%) | 7mo | $203,000 | $144 | 54 |
| 21145 Santa Clara | 0.48mi | 3/2.0 | 1,200 (-9%) | 7mo | $167,500 | $140 | 53 |
| 23421 W Mcnichols Rd | 0.72mi | 3/2.0 | 1,397 (+6%) | 3mo | $200,000 | $143 | 50 |
| 16122 Trinity St | 0.56mi | 3/2.5 | 1,152 (-12%) | 4mo | $169,900 | $147 | 44 |
| 15487 Greydale St | 0.71mi | 3/1.5 | 1,482 (+13%) | 6mo | $100,000 | $67 | 38 |
| 16135 Braile St | 0.67mi | 4/3.0 (+1) | 1,500 (+14%) | 1mo | $110,000 | $73 | 31 |
Match score weights: distance 35% · size 25% · config 20% · recency 20%. Top-matched comps best support the ARV.
Projected returns pro-forma
-3.0% appreciation · 8.0% rent growth · sell at horizon
- IRR
- 6.2%
- Equity multiple
- 1.25×
- Total profit
- $8,556
- Equity at exit
- $17,892
- IRR
- 19.5%
- Equity multiple
- 3.01×
- Total profit
- $67,682
- Equity at exit
- $10,375
Cash invested: $33,600 (down + closing). Projections, not guarantees.
Landlord ↔ Tenant lean methodology
- Overall (STATE)
- 62 Landlord-Friendly
- State Michigan
- 62 Landlord-Friendly · EVEN
- County
- — inherits STATE
- City
- — inherits STATE
ZIP-level market 48219
- Home prices YoY
- -10.3%
- Rents YoY
- 8.0%
- Active inventory
- 305
- Price-to-rent
- 7.1×
Monthly cashflow live
- Estimated rent
- $1,403 high interval (Pro) →
- Mortgage (P&I)
- −$629
- Tax from tax record
- −$105 /mo · $1,265/yr
- Insurance
- −$50
- HOA
- −$0
- Vacancy / Maint / Mgmt
- −$295
- Net cashflow
- $323
Break-even live
UW: 25.0% down · 7.5% · 30yr · 1.5% tax · 5.0% vac · 8.0% maint · 8.0% mgmt
Financing live
Cash to close
- Down payment
- $30,000
- Closing costs
- $3,600
- Reserves months
- —
- Total cash needed
- —
Loan-product check · same deal, 3 products live
Conventional
25% down · 7.5% · 30yr
- Down + closing
- —
- Monthly P&I
- —
- Monthly cashflow
- —
- DSCR
- —
- Eligible?
- —
Personal DTI + credit; lowest rate.
DSCR
20% down · 8.5% · 30yr
- Down + closing
- —
- Monthly P&I
- —
- Monthly cashflow
- —
- DSCR
- —
- Eligible?
- —
No personal income docs; deal must DSCR.
Hard money
10% down · 12.0% · 12mo
- Down + closing
- —
- Monthly P&I
- —
- Monthly cashflow
- —
- DSCR
- —
- Eligible?
- —
Short-term bridge; refi at stabilization.
Rent comps 39 comps
| Address | Beds | Baths | Sqft | Rent | $/sqft | DOM | Units | Dist |
|---|---|---|---|---|---|---|---|---|
| 17255 Westbrook St Detroit, MI | 3.0 | 2.0 | 1500 | $1,450 | $0.97 | 11d | 1 | 0.32mi |
| 16717 Trinity St Detroit, MI | 3.0 | 1.5 | 1101 | $1,250 | $1.14 | 43d | 1 | 0.39mi |
| 16565 Blackstone St Detroit, MI | 3.0 | 1.5 | 1592 | $1,575 | $0.99 | 43d | 1 | 0.39mi |
| 21440 Bennett St Detroit, MI | 3.0 | 1.0 | 1037 | $1,394 | $1.34 | 16d | 1 | 0.42mi |
| 17328 McIntyre St Unit 2 Detroit, MI | 3.0 | 1.0 | 1200 | $1,250 | $1.04 | 43d | 1 | 0.50mi |
| 21451 Glenco St Detroit, MI | 3.0 | 1.0 | 1026 | $1,400 | $1.36 | 16d | 1 | 0.51mi |
| 17355 McIntyre St Detroit, MI | 3.0 | 1.0 | 1500 | $1,250 | $0.83 | 43d | 1 | 0.53mi |
| 17721 Westbrook St Detroit, MI | 4.0 | 1.0 | 1040 | $1,125 | $1.08 | 24d | 1 | 0.60mi |
| 15847 Chatham St Detroit, MI | 3.0 | 1.0 | 909 | $1,325 | $1.46 | 4d | 1 | 0.65mi |
| 21434 Karl St Detroit, MI | 2.0 | 1.0 | 1000 | $1,350 | $1.35 | 43d | 1 | 0.67mi |
| 21455 Pickford St Detroit, MI | 2.0 | 1.0 | 1000 | $1,275 | $1.27 | 43d | 1 | 0.70mi |
| 17624 Patton St Detroit, MI | 3.0 | 1.0 | 1260 | $1,695 | $1.35 | 43d | 1 | 0.74mi |
| 18437 Trinity St Detroit, MI | 3.0 | 1.0 | 875 | $1,364 | $1.56 | 14d | 1 | 0.81mi |
| 18205 Stout St Detroit, MI | 3.0 | 1.0 | 901 | $1,078 | $1.20 | 24d | 1 | 0.91mi |
| 18191 Heyden St Detroit, MI | 2.0 | 1.0 | 917 | $1,100 | $1.20 | 24d | 1 | 1.00mi |
| 18134 Vaughan St Detroit, MI | 3.0 | 1.0 | 1060 | $1,150 | $1.08 | 16d | 1 | 1.03mi |
| 15340 Braile St Detroit, MI | 3.0 | 1.0 | 883 | $1,000 | $1.13 | 4d | 1 | 1.04mi |
| 15815 Evergreen Rd Detroit, MI | 3.0 | 1.0 | 1350 | $1,300 | $0.96 | 43d | 1 | 1.06mi |
| 16131 Dale St Detroit, MI | 3.0 | 1.0 | 1100 | $1,500 | $1.36 | 17d | 1 | 1.10mi |
| 18461 Heyden St Detroit, MI | 2.0 | 1.0 | 1000 | $1,050 | $1.05 | 4d | 1 | 1.10mi |
| 15712 Vaughan St Detroit, MI | 3.0 | 1.0 | 1280 | $1,400 | $1.09 | 14d | 1 | 1.11mi |
| 18556 Kentfield St Detroit, MI | 3.0 | 1.0 | 952 | $1,250 | $1.31 | 2d | 1 | 1.15mi |
| 22570 Seven Mile W Detroit, MI | 2.0 | 1.0 | 890 | $875 | $0.98 | 43d | 1 | 1.17mi |
| 15318 Kentfield St Detroit, MI | 3.0 | 1.5 | 900 | $1,400 | $1.56 | 43d | 1 | 1.20mi |
| 16800 Wormer St Detroit, MI | 3.0 | 1.0 | 912 | $1,250 | $1.37 | 17d | 1 | 1.20mi |
| 16207 Woodbine St Detroit, MI | 3.0 | 1.0 | 1000 | $1,294 | $1.29 | 4d | 1 | 1.20mi |
| 15519 Plainview Ave Detroit, MI | 3.0 | 1.0 | 900 | $1,396 | $1.55 | 16d | 1 | 1.22mi |
| 15829 Minock St Detroit, MI | 3.0 | 1.5 | 1200 | $1,550 | $1.29 | 24d | 1 | 1.23mi |
| 17678 Edinborough Rd Detroit, MI | 3.0 | 1.5 | 1528 | $1,650 | $1.08 | 14d | 1 | 1.26mi |
| 17678 Edinborough Rd Detroit, MI | 3.0 | 1.5 | 1528 | $1,650 | $1.08 | 16d | 1 | 1.26mi |
| 17238 Shaftsbury Ave Detroit, MI | 3.0 | 1.0 | 1200 | $1,550 | $1.29 | 43d | 1 | 1.34mi |
| 18302 Wormer St Detroit, MI | 3.0 | 1.0 | 1046 | $1,475 | $1.41 | 43d | 1 | 1.37mi |
| 18450 Edinborough Rd Detroit, MI | 3.0 | 1.0 | 1000 | $1,500 | $1.50 | 43d | 1 | 1.37mi |
| 19501 Redfern St Detroit, MI | 2.0 | 1.5 | 1816 | $1,350 | $0.74 | 43d | 1 | 1.44mi |
| 16896 Salem St Detroit, MI | 3.0 | 1.0 | 1150 | $1,300 | $1.13 | 43d | 1 | 1.47mi |
| 22241 Lyndon St Detroit, MI | 3.0 | 1.0 | 960 | $1,100 | $1.15 | 16d | 1 | 1.48mi |
| 16823 Stahelin Ave Detroit, MI | 3.0 | 2.5 | 1500 | $1,600 | $1.07 | 17d | 1 | 1.49mi |
| 17324 Salem St Detroit, MI | 2.0 | 1.0 | 989 | $1,200 | $1.21 | 24d | 1 | 1.50mi |
| 14828 Heyden St Detroit, MI | 3.0 | 1.0 | 1562 | $1,350 | $0.86 | 17d | 1 | 1.50mi |
Listing history 49 events
-
2026-06-18days on market $120,000 Active 28 DOM
-
2026-06-17days on market $120,000 Active 27 DOM
-
2026-06-15days on market $120,000 Active 25 DOM
-
2026-06-13days on market $120,000 Active 23 DOM
-
2026-06-13days on market $120,000 Active 22 DOM
-
2026-06-09days on market $120,000 Active 19 DOM
-
2026-06-08days on market $120,000 Active 18 DOM
-
2026-06-07days on market $120,000 Active 17 DOM
-
2026-06-04days on market $120,000 Active 14 DOM
-
2026-06-03days on market $120,000 Active 13 DOM
-
2026-06-02days on market $120,000 Active 12 DOM
-
2026-06-01days on market $120,000 Active 11 DOM
-
2026-05-31days on market $120,000 Active 10 DOM
-
2026-05-21$120,000 Active 741-char remark
Show marketing remark (741 chars)
Charming brick colonial in Detroit's Old Redford neighborhood offering timeless character and strong potential for both homeowners and investors. This 3 bedroom, 1 bath home features over 1,300 square feet with spacious living areas, a natural fireplace, large windows providing abundant natural light, and classic original details throughout. The full basement offers additional storage or finishing possibilities, while the sizable backyard provides space to relax or entertain. Conveniently located near shopping, dining, major freeways, and neighborhood landmarks like the Redford Theatre. Property is also being offered via Auction. com, presenting a unique opportunity to purchase in one of Detroit's established west side communities.
-
2026-05-21$120,000 Active
Show marketing remark (741 chars)
Charming brick colonial in Detroit's Old Redford neighborhood offering timeless character and strong potential for both homeowners and investors. This 3 bedroom, 1 bath home features over 1,300 square feet with spacious living areas, a natural fireplace, large windows providing abundant natural light, and classic original details throughout. The full basement offers additional storage or finishing possibilities, while the sizable backyard provides space to relax or entertain. Conveniently located near shopping, dining, major freeways, and neighborhood landmarks like the Redford Theatre. Property is also being offered via Auction. com, presenting a unique opportunity to purchase in one of Detroit's established west side communities.
-
2020-01-13historical
-
2020-01-13historical
-
2019-11-07$28,000 Active
-
2019-11-07$28,000 Active
-
2019-10-21historical
-
2019-10-21historical
-
2019-10-18price $20,500
-
2019-10-17price $20,500
-
2019-10-15price $24,900
-
2019-10-15price $24,900
-
2019-10-08$30,500 Active
-
2019-10-08$30,500 Active
-
2009-03-26historical
-
2009-02-17historical
-
2008-11-17$4,000
-
2008-11-17$4,000
-
2006-04-28soldstatus $6,500
-
2006-04-28soldstatus $6,500
-
2006-03-20$7,500
-
2006-03-20$7,500
-
2006-03-20historical
-
2005-10-15historical
-
2005-10-15historical
-
2005-04-14$95,000
-
2005-04-14$95,000
-
2005-01-25historical
-
2004-09-04$98,900
-
2002-05-13soldstatus $77,000
-
2001-02-14soldstatus $36,000
-
2000-01-28historical
-
1999-07-28$55,000
-
1993-02-26soldstatus $10,500
-
1992-12-08soldstatus $35,900
ⓘ Source: listings_history table (triggers on properties + properties_extension) + one-shot
backfill from property_details.listing_events for pre-trigger history.
Tax reassessment forecast MI · Partial reset (capped growth)
- Current annual tax
- $1,265 · $105/mo
- Projected year-2 tax
- $1,556 · $130/mo
- Expected delta
- +$292/yr (+$24/mo · 23.1%)
ⓘ Screening estimate from a state-policy table — verify with the county assessor before closing.
Climate risk First Street
- Flood 1/10 Low FEMA zone X (unshaded) · 0% chance over 30 yrs
- Wildfire 1/10 Low
- Heat 3/10 Moderate 7 d/yr ≥98°F today · 15 d/yr by 30 yrs out
- Wind 2/10 Low
- Air quality 3/10 Moderate 2 unhealthy d/yr today · 3 by 30 yrs out
Nearby sold comps map
Loading sold comps map…
Walkable amenities ~0.75 mi
Loading nearby amenities…
Taxation est. · year 1
- Rental income
- $16,831
- − Mortgage interest
- −$6,722
- − Property taxes
- −$1,265
- − Insurance
- −$600
- − Repairs & maintenance
- −$1,347
- − Management
- −$1,347
- − Depreciation
- −$3,491
- Taxable income
- $2,061
- Est. tax owed @ 24.0%
- −$495
- After-tax cash flow
- $3,386/yr
For passive investors: Depreciation is non-cash, so a rental often shows a tax loss while cash-flowing — sheltering income. Rental losses are passive: they offset passive income freely, and up to $25,000/yr can offset ordinary (W-2) income if you actively participate and your MAGI is under $100k (phasing out to $0 by $150k); unused losses carry forward. On sale, claimed depreciation is recaptured at up to 25%, and gains may owe capital-gains tax (a 1031 exchange can defer both). Figures are a year-1 estimate at your 24.0% rate — not tax advice; consult a CPA.
Schools (NCES district)
- District
- Detroit Public Schools Community District
- NCES district ID
- 2601103
- Math proficiency
- 10% ▼ -2.00%
- Reading proficiency
- 24% ▲ 6.00%
- Median HH income
- $25,815
- Composite
- 13.06/100
- National rank
- #9564
- State rank
- #499 of 540 in MI
Livability — Detroit
- Score
- 73/100
- State rank
- #218
- US rank
- #5427
Category grades
Schools grade is shown separately in the Schools card above.
Census & demographics
- Census place
- Detroit, MI
- County
- Wayne County · 1,562,939 people
- City population
- 572,865
- Metro
- Detroit-Warren-Dearborn, MI
- Population (ZIP)
- 47,208
- Household income
- $43,655
- Rent vs Own
- Severe rent burden
- 3584.0
Population outlook (Wayne County) Hauer SSP2
- Today (2025)
- 1,675,273 people
- By 2030
- 1,620,300 · -3.3%
- By 2040
- 1,502,341 · -10.3%
- By 2050
- 1,384,039 · -17.4%
- By 2075
- 1,124,592 · -32.9%
- By 2100
- 881,193 · -47.4%
Race, ethnicity, and origin ACS 2023
- Neighborhood character
- Predominantly Black (88%)
- Race & ethnicity
- Black 88% White 5% Two or more races 4% Hispanic / Latino 1%
- Common ancestry
- Romanian 1% Lithuanian 1%
- Foreign-born
- 2% · Canada
- Languages at home
- 96% English-only · Spanish 1% French/Haitian/Cajun 1%
Political lean MEDSL · Wayne
- 2024 margin
- Strong D (+29.0) · D 62.7% · R 33.7% · Other 3.6%
- 2008→2024 swing
- -20.5pp toward R · 2008: 49.5pp · 2024: 29.0pp
- All cycles
- 2024: D+29.0 2020: D+38.1 2016: D+37.3 2012: D+46.9 2008: D+49.5
Not yet ingested
- Civics
- —
Market trends
- HPI YoY
- ▼ -65.06%
- Current HPI
- 563.3263
- Rent YoY
- ▲ 8.04%
- Metro
- Detroit-Warren-Dearborn, MI
- State GDP YoY
- ▲ 1.37%
- F500 in state
- 28
Industry mix (Fortune 500 HQ in MI)
| Industry | F500 HQs | Revenue |
|---|---|---|
| Automotive Parts | 3 | $48B |
|
||
| Automotive | 2 | $372B |
|
||
| Chemicals | 1 | $45B |
|
||
| Automotive Retail | 1 | $29B |
|
||
| Healthcare / Medical Devices | 1 | $23B |
|
||
| Automotive Technology | 1 | $20B |
|
||
Price history
+234.3% since first listed36 events — show timeline
- 2026-05-21 Listed $120,000 SW Michigan MLS
- 2026-05-21 Listed $120,000 REALCOMP
- 2026-05-21 Listed $120,000 MiRealSource-MiMLS
- 2020-01-13 Listing Removed — REALCOMP
- 2020-01-13 Listing Removed — MiRealSource-MiMLS
- 2019-11-07 Listed $28,000 MiRealSource-MiMLS
- 2019-11-07 Listed $28,000 REALCOMP
- 2019-10-21 Listing Removed — REALCOMP
- 2019-10-21 Listing Removed — MiRealSource-MiMLS
- 2019-10-18 Price Changed $20,500 MiRealSource-MiMLS
- 2019-10-17 Price Changed $20,500 REALCOMP
- 2019-10-15 Price Changed $24,900 MiRealSource-MiMLS
- 2019-10-15 Price Changed $24,900 REALCOMP
- 2019-10-08 Listed $30,500 MiRealSource-MiMLS
- 2019-10-08 Listed $30,500 REALCOMP
- 2009-03-26 Listing Removed — REALCOMP
- 2009-02-17 Listing Removed — MiRealSource-MiMLS
- 2008-11-17 Listed $4,000 MiRealSource-MiMLS
- 2008-11-17 Listed $4,000 REALCOMP
- 2006-04-28 Sold (MLS) $6,500 MiRealSource-MiMLS
- 2006-04-28 Sold (MLS) $6,500 REALCOMP
- 2006-03-20 Listing Removed — MiRealSource-MiMLS
- 2006-03-20 Listed $7,500 MiRealSource-MiMLS
- 2006-03-20 Listed $7,500 REALCOMP
- 2005-10-15 Listing Removed — REALCOMP
- 2005-10-15 Listing Removed — MiRealSource-MiMLS
- 2005-04-14 Listed $95,000 REALCOMP
- 2005-04-14 Listed $95,000 MiRealSource-MiMLS
- 2005-01-25 Listing Removed — REALCOMP
- 2004-09-04 Listed $98,900 REALCOMP
- 2002-05-13 Sold (Public Records) $77,000 Public Records
- 2001-02-14 Sold (Public Records) $36,000 Public Records
- 2000-01-28 Listing Removed — REALCOMP
- 1999-07-28 Listed $55,000 REALCOMP
- 1993-02-26 Sold (Public Records) $10,500 Public Records
- 1992-12-08 Sold (Public Records) $35,900 Public Records
Property tax history
+12.7%/yrLatest (2025): $1,265 · -37.2% YoY. Source: county tax records.
Cash-flow waterfall
monthlySold comps — $/sqft
last 12 mo · ≤1 miLoading sold comps…