1423 Quinnipiac Ave #602 · New Haven, CT
Flood risk 1/10 · Minimal
- FEMA flood zone
- X (unshaded)
- Chance of flooding over 30 yrs
- 0.0%
- Est. flood insurance / yr
- $507 – $1,088
Fire risk 3/10 · Minor
- Est. fire insurance / yr
- $829 – $1,539
Heat risk 6/10 · Moderate
- Hot days now (above 97°F)
- 7 days/yr
- Hot days in 30 yrs
- 16 days/yr
Wind risk 6/10 · Moderate
- Chance of severe wind over 30 yrs
- 61.0%
Air-quality risk 5/10 · Moderate
- Unhealthy air days now
- 6 days/yr
- Unhealthy air days in 30 yrs
- 8 days/yr
Risk factors via First Street. Map © Google.
Why this score? — see what drove the D grade
The composite is a weighted blend of 9 inputs, each scored 0–100. Each bar is that input's sub-score; the figure is the points it added to the 100-point composite (weight × sub-score).
- Cash flow +13.9/30.0
- ARV discount +7.5/15.0
- 1% rule +6.0/10.0
- DSCR +4.2/10.0
- Livability +4.0/5.0
- Rent growth +3.5/5.0
- Condition / age +2.5/5.0
- Schools +1.5/10.0
- Appreciation +0.0/10.0
$175,000
🖨 Deal sheet (PDF) 📄 Offer letter ✓ Due diligence
Listing remarks
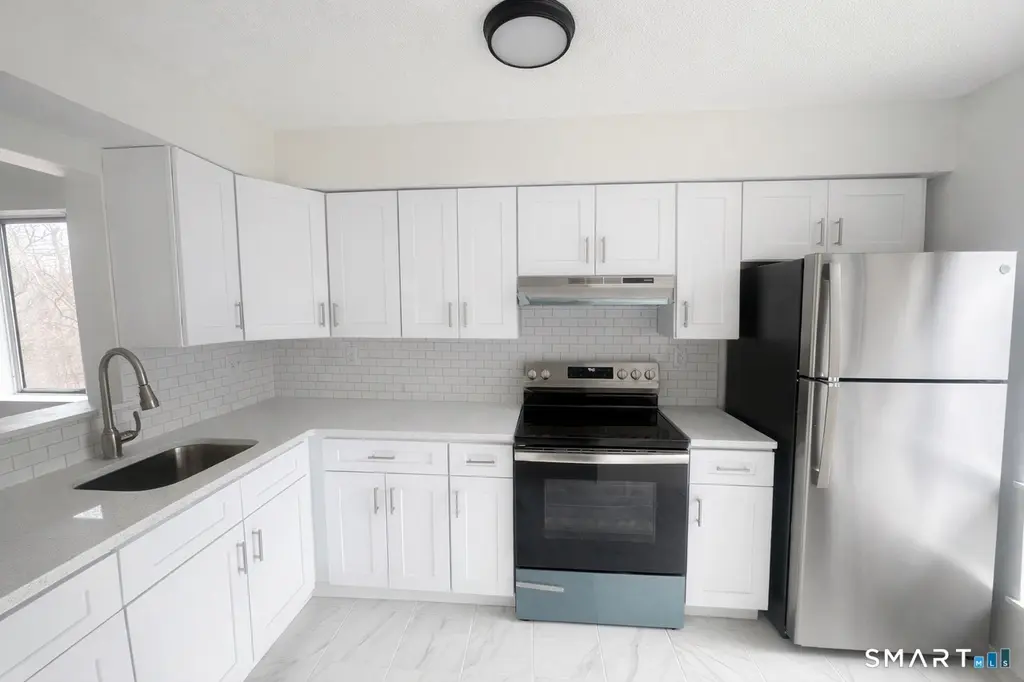
Welcome to this beautifully updated 2-bedroom, 1.5-bath townhouse at Harbour Crest. This move-in-ready home features a fully renovated kitchen and bathrooms with modern upgrades throughout, including stainless steel appliances, new flooring, fresh paint, updated lighting fixtures, and a brand-new washer and dryer. Whether you're an investor or looking for a place to call home, this property offers exceptional value and convenience. Don't miss this opportunity to own a fully renovated condo for under $200,000! If your clients look across the way, they'll notice the light gray vinyl siding on the neighboring building-this is the same style and color that will be installed on the building for
Key facts
- Fresh paint
- New flooring
- $333 HOA
Tags
Property features AI
Finance
- Other: Pets allowed (inquire)
- HOA & community: Homeowners association with monthly fee; Monthly HOA fee of $333; HOA covers grounds maintenance, trash pickup, snow removal, water, and property management; Part of a 30-unit complex (Harbour Crest)
Exterior
- Utilities: Public water connected; Public sewer connected; Natural gas
- Home design: Condominium (Condo/Co-Op for sale); End unit; Unit spans 2 levels
- Construction: Frame construction
- Exterior features: Clapboard siding; Level lot
Interior
- Kitchen: Electric range; Range hood; Refrigerator; Dishwasher
- Bedrooms: 2 bedrooms (unit has 2 levels)
- Bathrooms: 1 full bath; 1 half bath
- Heating & cooling: Hot air heating fueled by natural gas; Central air conditioning
- Interior features: Central air conditioning; No basement
- Laundry & utility: Washer; Electric dryer; 40-gallon hot water tank
Neighborhood map
What this means for you Summary
Snapshot
- This is a 2-bed/1.5-bath condo listed at $175k.
Deal economics
- At list price, monthly cash flow is $20 ($235/yr) — positive.
- The deal already cash-flows at list — no discount required.
- Meets the 1% rule at list price ($2k rent vs $175k).
- Recommended offer: $172k (1.5% below list) — sets the bar for market timing.
- Cap rate 6.4% vs local median 4.8% in New Haven — top-decile yield for the area; either an underpriced asset or a hidden risk that comps aren't pricing in. Stress-test before assuming the spread holds.
Location & tenants
- Location reads 79/100 on livability (#31 in CT, #2,190 nationally) — a middle-class / working-renter tenant base. Strengths: amenities A+, commute A+, health & safety A+; Watch: employment D, crime F.
- New Haven School District (urban): math 12% / reading 25% proficiency, ranked #147 of 153 in CT (top 96%) — low school quality limits family demand, transient renter base, plan for 1-2y turnover; 66% free/reduced lunch — lower-income household profile, screen leases tightly.
- Zoned schools: Bishop Woods Architecture And Design Magnet School (math 2% / reading 22%, grade F, #490 of 553 statewide, top 90%, 438 students, 84% FRL); Betsy Ross Arts Magnet School (math 12% / reading 27%, grade F, #161 of 175 statewide, top 93%, 327 students, 70% FRL); Wilbur Cross High School (math 17% / reading 37%, grade F, #147 of 194 statewide, top 78%, 1,633 students, 76% FRL).
- Market conditions: Rents rising fast (+4.1%/yr); 102 active listings in the ZIP; 26 comparable units currently listed for rent nearby; rentals at typical pace (median 17d on market — plan ~3-4 weeks tenant-placement turnaround); 1,059 units permitted in South Central Connecticut Planning Region in 2024 (779 in 5+ unit buildings).
- At $1,928/mo this rent would consume 48% of the median local household income ($48k/yr) (locally 2664% of renters already pay >50% of income on rent) — very limited rent-growth headroom before tenants either downsize or default.
Forward outlook
- Local home prices are declining (-3.0%/yr); year-one equity from $1k of loan paydown is wiped out by about $5k of value loss. Plan a longer hold.
Negotiation context
- It's been on market 16 days — a 2% lower offer ($172k) is reasonable based on typical stale-listing flexibility.
- 7 sale attempts since 8y ago with the ask held roughly flat each time — persistent listings suggest the price (not the market) is what's stuck; bring a comps-based counter.
- Current owner paid $44k; list at $175k implies a 293% gain — meaningful room to come down on a strong offer.
Risks & watch-outs
- Climate carrying-cost: major wind risk, 61% chance of damaging wind over 30y; extreme-heat days projected 7→16/yr by 2055 (HVAC capex compounding) — expect insurance premiums to compound above CPI over the hold.
Questions for the listing agent
- What does the HOA fee cover, when was the last increase, and are there any pending special assessments or reserve-fund shortfalls?
- Any open or pending special assessments — roof, HVAC, plumbing, elevator, façade? What's the per-unit balance and payoff schedule, and is the seller paying it off at close or rolling it to the buyer?
- Is there a deadline driving the sale (1031 exchange, divorce, estate, relocation)? That informs how much negotiation room exists.
- Schools are D-rated, which usually means shorter tenancies and higher turnover. Who's the typical renter profile here, and what's been the actual vacancy rate?
- Crime grade is F in this area — have there been break-ins, vandalism, or insurance claims at this property in the last 3 years? What carrier currently insures it and at what premium?
- The area grade is low — what's the realistic commute time and amenity access for the typical tenant pool here? Any planned neighborhood developments (good or bad) we should know about?
- What's the average days-on-market for RENTAL listings here right now (not sales)? A rising rental-DOM trend means longer vacancies and softer asking-rent achievability than the comps imply.
- What's the recent tenant-quality profile in this submarket — average credit score on applications, eviction rate, late-payment / NSF rate, and stable-employment percentage? A property-management company in the area should have these aggregated.
- How much new apartment / multifamily construction is in the pipeline within 1–3 miles? Heavy new supply (>2% of stock underway) typically softens rents 12–24 months out; light construction supports rent growth.
Investment metrics
- 1% rule
- 1.10% ✓
- Cap rate
- 6.43%
- Cash-on-cash
- 0.48%
- DSCR
- 1.02
- GRM
- 7.6
CMA / ARV
No comps found within radius.
Projected returns pro-forma
-3.0% appreciation · 4.12% rent growth · sell at horizon
- IRR
- -13.9%
- Equity multiple
- 0.50×
- Total profit
- $-24,703
- Equity at exit
- $26,093
- IRR
- -2.8%
- Equity multiple
- 0.80×
- Total profit
- $-9,831
- Equity at exit
- $15,131
Cash invested: $49,000 (down + closing). Projections, not guarantees.
Landlord ↔ Tenant lean methodology
- Overall (STATE)
- 27 Tenant-Leaning
- State Connecticut
- 27 Tenant-Leaning · D+7
- County
- — inherits STATE
- City
- — inherits STATE
ZIP-level market 06513
- Home prices YoY
- -7.8%
- Rents YoY
- 4.1%
- Active inventory
- 102
- Price-to-rent
- 7.6×
Monthly cashflow live
- Estimated rent
- $1,928 high interval (Pro) →
- Mortgage (P&I)
- −$918
- Tax from tax record
- −$180 /mo · $2,154/yr
- Insurance
- −$73
- HOA
- −$333
- Vacancy / Maint / Mgmt
- −$405
- Net cashflow
- $20
Break-even live
Sensitivity live
| Price | -10% $119 | -5% $69 | +0% $20 | +5% $-30 | +10% $-79 |
|---|---|---|---|---|---|
| Rent | -10% $-133 | -5% $-57 | +0% $20 | +5% $96 | +10% $172 |
| Rate | -1.0pp $108 | -0.5pp $64 | base $20 | +0.5pp $-26 | +1.0pp $-72 |
UW: 25.0% down · 7.5% · 30yr · 1.5% tax · 5.0% vac · 8.0% maint · 8.0% mgmt
Financing live
Cash to close
- Down payment
- $43,750
- Closing costs
- $5,250
- Reserves months
- —
- Total cash needed
- —
Loan-product check · same deal, 3 products live
Conventional
25% down · 7.5% · 30yr
- Down + closing
- —
- Monthly P&I
- —
- Monthly cashflow
- —
- DSCR
- —
- Eligible?
- —
Personal DTI + credit; lowest rate.
DSCR
20% down · 8.5% · 30yr
- Down + closing
- —
- Monthly P&I
- —
- Monthly cashflow
- —
- DSCR
- —
- Eligible?
- —
No personal income docs; deal must DSCR.
Hard money
10% down · 12.0% · 12mo
- Down + closing
- —
- Monthly P&I
- —
- Monthly cashflow
- —
- DSCR
- —
- Eligible?
- —
Short-term bridge; refi at stabilization.
Rent comps 26 comps
| Address | Beds | Baths | Sqft | Rent | $/sqft | DOM | Units | Dist |
|---|---|---|---|---|---|---|---|---|
| 1425 Quinnipiac Ave #302 New Haven, CT | 2.0 | 1.5 | 1212 | $2,000 | $1.65 | 21d | 1 | 0.16mi |
| 1425 Quinnipiac Ave #112 New Haven, CT | 2.0 | 1.5 | 1212 | $2,000 | $1.65 | 45d | 1 | 0.16mi |
| 1314 Quinnipiac Ave New Haven, CT | 2.0–3.0 | 1.0 | 1150 | $1,695 | $1.47 | 5d | 8 | 0.22mi |
| 430 Eastern St New Haven, CT | 1.0–3.0 | 1.0–1.5 | 900 | $1,832 | $2.04 | 4d | 2 | 0.32mi |
| 5 Assumption St New Haven, CT | 3.0 | 1.0 | 816 | $2,750 | $3.37 | 4d | 1 | 0.40mi |
| 59 Foxon Blvd East Haven, CT | 1.0 | 2.0 | 840 | $1,850 | $2.20 | 16d | 1 | 0.41mi |
| 95 Weybosset St Unit 3 New Haven, CT | 2.0 | 1.0 | 800 | $1,800 | $2.25 | 45d | 1 | 0.49mi |
| 339 Eastern St New Haven, CT | 2.0 | 1.0 | 505 | $1,600 | $3.17 | 45d | 6 | 0.57mi |
| 631 Middletown Ave New Haven, CT | 2.0 | 1.0 | 932 | $1,775 | $1.90 | 46d | 1 | 0.66mi |
| 918 Quinnipiac Ave #7 New Haven, CT | 2.0 | 2.0 | 1361 | $2,500 | $1.84 | 4d | 1 | 0.86mi |
| 80 New Haven, CT | 2.0 | 1.0 | 850 | $1,900 | $2.24 | 5d | 2 | 0.96mi |
| 232 Glen Haven Rd New Haven, CT | 2.0 | 1.0 | 900 | $1,850 | $2.06 | 16d | 1 | 0.98mi |
| 318 Front St Unit one New Haven, CT | 3.0 | 1.5 | 1400 | $3,100 | $2.21 | 23d | 1 | 1.08mi |
| 75 Redwood Dr #708 East Haven, CT | 2.0 | 2.0 | 1265 | $2,500 | $1.98 | 4d | 1 | 1.14mi |
| 110 Maltby St New Haven, CT | 1.0 | 1.0 | 760 | $1,550 | $2.04 | 16d | 1 | 1.18mi |
| 57 Maltby St Unit 2nd Front New Haven, CT | 2.0 | 1.0 | 800 | $1,395 | $1.74 | 5d | 1 | 1.19mi |
| 153 Dover St New Haven, CT | 2.0 | 1.0 | 888 | $1,750 | $1.97 | 25d | 1 | 1.29mi |
| 153 Dover St Unit D New Haven, CT | 2.0 | 1.0 | 888 | $1,750 | $1.97 | 45d | 1 | 1.29mi |
| 153 Dover St New Haven, CT | 2.0 | 1.0 | 888 | $1,800 | $2.03 | 13d | 1 | 1.29mi |
| 651 Quinnipiac Ave Unit 2 New Haven, CT | 3.0 | 1.0 | 1355 | $1,975 | $1.46 | 45d | 1 | 1.35mi |
| 122 Atwater St New Haven, CT | 3.0 | 1.0 | 1274 | $2,300 | $1.81 | 5d | 1 | 1.38mi |
| 122 Atwater St Unit 3 New Haven, CT | 2.0 | 1.0 | 1300 | $1,980 | $1.52 | 5d | 1 | 1.38mi |
| 1397 State St Unit 6 New Haven, CT | 2.0 | 1.5 | 1000 | $1,695 | $1.70 | 45d | 1 | 1.41mi |
| 1399 State St Unit 5B New Haven, CT | 1.0 | 1.0 | 700 | $1,595 | $2.28 | 45d | 1 | 1.41mi |
| 10 Rowe St New Haven, CT | 2.0 | 1.0 | 1100 | $1,900 | $1.73 | 13d | 1 | 1.48mi |
| 40 Exchange St Unit 2 New Haven, CT | 3.0 | 1.0 | 1000 | $2,050 | $2.05 | 45d | 1 | 1.49mi |
HOA detail condo
- Monthly dues
- $333 · $3,996/yr
- Assessments
- None detected in remarks — confirm with the listing agent.
Listing history 16 events
-
2026-04-16status Under Contract
-
2026-03-30status Active
-
2026-03-30$175,000 Active
-
2026-03-30historical
-
2026-03-16status Under Contract
-
2026-03-16$139,000 Active
-
2026-03-12historical
-
2025-09-11$139,000 Active
-
2025-09-11historical
-
2025-03-11status Active
-
2025-03-11historical
-
2024-09-20$139,000 Active
-
2024-09-12historical
-
2018-07-24soldstatus $44,500
-
2018-06-13$47,500
-
1988-06-28soldstatus $102,000
ⓘ Source: listings_history table (triggers on properties + properties_extension) + one-shot
backfill from property_details.listing_events for pre-trigger history.
Tax reassessment forecast CT · Partial reset (capped growth)
- Current annual tax
- $2,154 · $180/mo
- Projected year-2 tax
- $2,950 · $246/mo
- Expected delta
- +$796/yr (+$66/mo · 36.9%)
ⓘ Screening estimate from a state-policy table — verify with the county assessor before closing.
Climate risk First Street
- Flood 1/10 Low FEMA zone X (unshaded) · 0% chance over 30 yrs
- Wildfire 3/10 Moderate
- Heat 6/10 Major 7 d/yr ≥97°F today · 16 d/yr by 30 yrs out
- Wind 6/10 Major 61% chance of damaging wind over 30 yrs
- Air quality 5/10 Major 6 unhealthy d/yr today · 8 by 30 yrs out
Nearby sold comps map
Loading sold comps map…
Walkable amenities ~0.75 mi
Loading nearby amenities…
Taxation est. · year 1
- Rental income
- $23,130
- − Mortgage interest
- −$9,803
- − Property taxes
- −$2,154
- − Insurance
- −$875
- − Repairs & maintenance
- −$1,850
- − Management
- −$1,850
- − HOA
- −$3,996
- − Depreciation
- −$5,091
- Taxable loss
- −$2,489
- Est. tax savings @ 24.0%
- +$597
- After-tax cash flow
- $833/yr
For passive investors: Depreciation is non-cash, so a rental often shows a tax loss while cash-flowing — sheltering income. Rental losses are passive: they offset passive income freely, and up to $25,000/yr can offset ordinary (W-2) income if you actively participate and your MAGI is under $100k (phasing out to $0 by $150k); unused losses carry forward. On sale, claimed depreciation is recaptured at up to 25%, and gains may owe capital-gains tax (a 1031 exchange can defer both). Figures are a year-1 estimate at your 24.0% rate — not tax advice; consult a CPA.
Schools (NCES district)
- District
- New Haven School District
- NCES district ID
- 0902790
- Math proficiency
- 12% ▼ -10.00%
- Reading proficiency
- 25% ▼ -10.00%
- Median HH income
- $38,058
- Composite
- 15.48/100
- National rank
- #9308
- State rank
- #147 of 153 in CT
Livability — New Haven
- Score
- 79/100
- State rank
- #31
- US rank
- #2190
Category grades
Schools grade is shown separately in the Schools card above.
Census & demographics
- Census place
- New Haven, CT
- County
- New Haven County · 688,236 people
- City population
- 132,813
- Metro
- New Haven-Milford, CT
- Population (ZIP)
- 38,888
- Household income
- $48,500
- Rent vs Own
- Severe rent burden
- 2664.0
Population outlook (South Central Connecticut County) Hauer SSP2
- By 2040
- 608,362
Race, ethnicity, and origin ACS 2023
- Neighborhood character
- Diverse neighborhood (Simpson 0.66)
- Race & ethnicity
- Hispanic / Latino 47% White 26% Black 22% Two or more races 12% Asian 1%
- Hispanic origin (detail)
- Mexican 7% Puerto Rican 25% Dominican 2%
- Common ancestry
- Romanian 2% Lithuanian 1% Slovak 1%
- Foreign-born
- 17% · Canada, Jamaica, South Korea
- Languages at home
- 56% English-only · Spanish 39% Other Indo-European 1% Russian/Polish/Slavic 1%
Political lean MEDSL · South Central Connecticut
- 2024 margin
- Strong D (+20.1) · D 59.0% · R 38.9% · Other 2.1%
- All cycles
- 2024: D+20.1
Not yet ingested
- Civics
- —
Market trends
- HPI YoY
- ▼ -30.87%
- Current HPI
- 364.006
- Rent YoY
- ▲ 4.12%
- Metro
- New Haven-Milford, CT
- State GDP YoY
- ▲ 1.06%
- F500 in state
- 38
Industry mix (Fortune 500 HQ in CT)
| Industry | F500 HQs | Revenue |
|---|---|---|
| Industrial Machinery | 4 | $38B |
|
||
| Insurance | 3 | $71B |
|
||
| Financial Services | 2 | $25B |
|
||
| Transportation / Logistics | 2 | $18B |
|
||
| Healthcare | 1 | $247B |
|
||
| Telecommunications | 1 | $55B |
|
||
Price history
+71.6% since first listed16 events — show timeline
- 2026-04-16 Pending — Smart MLS
- 2026-03-30 Relisted — Smart MLS
- 2026-03-30 Listing Removed — Smart MLS
- 2026-03-30 Listed $175,000 Smart MLS
- 2026-03-16 Pending — Smart MLS
- 2026-03-16 Listed $139,000 Smart MLS
- 2026-03-12 Listing Removed — Smart MLS
- 2025-09-11 Listed $139,000 Smart MLS
- 2025-09-11 Listing Removed — Smart MLS
- 2025-03-11 Relisted — Smart MLS
- 2025-03-11 Listing Removed — Smart MLS
- 2024-09-20 Listed $139,000 Smart MLS
- 2024-09-12 Coming Soon — Smart MLS
- 2018-07-24 Sold (MLS) $44,500 Smart MLS
- 2018-06-13 Listed $47,500 Smart MLS
- 1988-06-28 Sold (Public Records) $102,000 Public Records
Property tax history
+0.7%/yrLatest (2023): $2,154 · -6.4% YoY. Source: county tax records.
Cash-flow waterfall
monthlySold comps — $/sqft
last 12 mo · ≤1 miLoading sold comps…