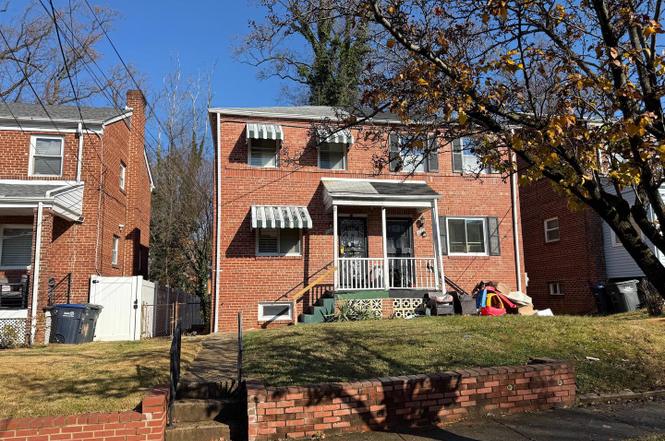
3048 M St SE · Washington, DC
Flood risk 1/10 · Minimal
- FEMA flood zone
- X (unshaded)
- Chance of flooding over 30 yrs
- 0.0%
- Est. flood insurance / yr
- $473 – $860
Fire risk 1/10 · Minimal
- Est. fire insurance / yr
- $631 – $1,173
Heat risk 8/10 · Major
- Hot days now (above 104°F)
- 7 days/yr
- Hot days in 30 yrs
- 15 days/yr
Wind risk 4/10 · Minor
- Chance of severe wind over 30 yrs
- 17.0%
Air-quality risk 4/10 · Minor
- Unhealthy air days now
- 4 days/yr
- Unhealthy air days in 30 yrs
- 5 days/yr
Risk factors via First Street. Map © Google.
Why this score? — see what drove the B grade
The composite is a weighted blend of 9 inputs, each scored 0–100. Each bar is that input's sub-score; the figure is the points it added to the 100-point composite (weight × sub-score).
- Cash flow +27.5/30.0
- ARV discount +15.0/15.0
- DSCR +9.6/10.0
- 1% rule +6.1/10.0
- Rent growth +4.0/5.0
- Livability +3.7/5.0
- Schools +3.6/10.0
- Condition / age +2.5/5.0
- Appreciation +0.0/10.0
$230,000
🖨 Deal sheet (PDF) 📄 Offer letter ✓ Due diligence
Listing remarks
Nestled in the charming Hillcrest neighborhood, this delightful Colonial twin home, built in 1944, exudes warmth and character. With two spacious bedrooms and a full bathroom, this residence is designed for comfort and functionality. The inviting wood floors throughout create a cozy atmosphere, perfect for both relaxation and entertaining. The improved basement offers additional space for a home office, play area, or storage, catering to your lifestyle needs. The expansive yard provides a blank canvas for gardening or outdoor gatherings, allowing you to create your own personal oasis. Hillcrest is not just a place to live; it's a vibrant community. Residents enjoy easy access to local parks
Key facts
- Improved basement
- Expansive yard
- Vibrant community
Tags
Neighborhood map
What this means for you Summary
Snapshot
- This is a 3-bed/1.0-bath single-family listed at $230k.
Deal economics
- At list price, monthly cash flow is $677 ($8k/yr) — positive.
- The deal already cash-flows at list — no discount required.
- Meets the 1% rule at list price ($3k rent vs $230k).
- Recommended offer: $209k (9.0% below list) — sets the bar for market timing.
- Cap rate 9.8% vs local median 2.5% in Washington — top-decile yield for the area; either an underpriced asset or a hidden risk that comps aren't pricing in. Stress-test before assuming the spread holds.
Location & tenants
- Location reads 73/100 on livability (#1 in DC) — a middle-class / working-renter tenant base. Strengths: amenities A+, commute A+, employment A+; Watch: crime F, cost of living F.
- District Of Columbia Public Schools (urban): math 33% / reading 40% proficiency, ranked #8 of 32 in DC (top 25%) — families likely to look elsewhere, expect single-tenant / working-renter base with shorter leases; 65% free/reduced lunch — lower-income household profile, screen leases tightly.
- Market conditions: Rents rising fast (+6.1%/yr); 276 active listings in the ZIP; 40 comparable units currently listed for rent nearby; rentals at typical pace (median 25d on market — plan ~3-4 weeks tenant-placement turnaround); 1,737 units permitted in District of Columbia in 2024 (1,506 in 5+ unit buildings).
- At $2,563/mo this rent would consume 53% of the median local household income ($58k/yr) (locally 5115% of renters already pay >50% of income on rent) — very limited rent-growth headroom before tenants either downsize or default.
Forward outlook
- Local home prices are declining (-3.0%/yr); year-one equity from $2k of loan paydown is wiped out by about $7k of value loss. Plan a longer hold.
- District of Columbia County population projected at +50% by 2050 — long-run rental-demand tailwind backs the buy-and-hold thesis.
- At projected returns (-3.0% appreciation + 6.1% rent growth), your $64k cash investment doubles in ~8 years — after that, you're playing with house money.
Negotiation context
- It's been on market 115 days — a 9% lower offer ($209k) is reasonable based on typical stale-listing flexibility.
- 2 sale attempts; this cycle's ask has dropped $55k (19%) from the opening price — seller is motivated, your offer sets the floor, not the list.
Risks & watch-outs
- Watch-outs: built in 1944 — expect roof / HVAC / electrical / plumbing capex.
- Climate carrying-cost: extreme-heat days projected 7→15/yr by 2055 (HVAC capex compounding) — expect insurance premiums to compound above CPI over the hold.
Questions for the listing agent
- It's been on market 115 days. Have you received any prior offers? Is the seller open to a 9% concession, seller financing, or rate buy-down credit?
- Built in 1944 — when were the roof, HVAC, electrical panel, plumbing, and water heater last replaced?
- Why hasn't it sold? Are there any deal-killer items the seller is aware of (foundation, flood, title, zoning, code violations)?
- Is there a deadline driving the sale (1031 exchange, divorce, estate, relocation)? That informs how much negotiation room exists.
- Crime grade is F in this area — have there been break-ins, vandalism, or insurance claims at this property in the last 3 years? What carrier currently insures it and at what premium?
- What's the average days-on-market for RENTAL listings here right now (not sales)? A rising rental-DOM trend means longer vacancies and softer asking-rent achievability than the comps imply.
- What's the recent tenant-quality profile in this submarket — average credit score on applications, eviction rate, late-payment / NSF rate, and stable-employment percentage? A property-management company in the area should have these aggregated.
- How much new for-sale + rental construction is in the pipeline within 1–3 miles? Heavy new supply typically softens prices + rents 12–24 months out; constrained supply supports both.
Investment metrics
- 1% rule
- 1.11% ✓
- Cap rate
- 9.83%
- Cash-on-cash
- 12.62%
- DSCR
- 1.56
- GRM
- 7.5
CMA / ARV
- ARV (on-the-fly)
- $361,938
- Comps found
- 6
Show comp detail 6 sales within ~0.75 mi
| Address | Dist | Beds/Ba | Sqft | Sold | Price | $/sf | Match |
|---|---|---|---|---|---|---|---|
| 1336 30th St SE | 0.18mi | 3/2.0 | 1,120 (+4%) | 12mo | $430,000 | $384 | 70 |
| 3426 Nash Pl SE | 0.41mi | 3/2.0 | 999 (-7%) | 3mo | $360,000 | $360 | 63 |
| 2003 Fairlawn Ave SE | 0.73mi | 3/1.0 | 1,085 (+1%) | 5mo | $285,000 | $263 | 60 |
| 3304 E St SE | 0.54mi | 3/1.0 | 1,161 (+8%) | 2mo | $125,000 | $108 | 59 |
| 722 32nd St SE | 0.27mi | 2/1.0 (-1) | 935 (-13%) | 7mo | $146,000 | $156 | 55 |
| 2235 Prout St SE | 0.59mi | 3/1.0 | 1,129 (+5%) | 20mo | $380,000 | $337 | 47 |
Match score weights: distance 35% · size 25% · config 20% · recency 20%. Top-matched comps best support the ARV.
Projected returns pro-forma
-3.0% appreciation · 6.06% rent growth · sell at horizon
- IRR
- 5.4%
- Equity multiple
- 1.22×
- Total profit
- $13,899
- Equity at exit
- $34,294
- IRR
- 17.2%
- Equity multiple
- 2.60×
- Total profit
- $102,751
- Equity at exit
- $19,886
Cash invested: $64,400 (down + closing). Projections, not guarantees.
Landlord ↔ Tenant lean methodology
- Overall (CITY)
- 0 Strongly Tenant-Friendly
- State District of Columbia
- 12 Strongly Tenant-Friendly · D+43
- County
- — inherits STATE
- City Washington
- 0 Strongly Tenant-Friendly · D+43
ZIP-level market 20019
- Rents YoY
- 6.1%
- Active inventory
- 276
- Price-to-rent
- 7.5×
Monthly cashflow live
- Estimated rent
- $2,563 high interval (Pro) →
- Mortgage (P&I)
- −$1,206
- Tax from tax record
- −$45 /mo · $543/yr
- Insurance
- −$96
- HOA
- −$0
- Vacancy / Maint / Mgmt
- −$538
- Net cashflow
- $677
Break-even live
Sensitivity live
| Price | -10% $808 | -5% $743 | +0% $677 | +5% $612 | +10% $547 |
|---|---|---|---|---|---|
| Rent | -10% $475 | -5% $576 | +0% $677 | +5% $779 | +10% $880 |
| Rate | -1.0pp $793 | -0.5pp $736 | base $677 | +0.5pp $618 | +1.0pp $557 |
UW: 25.0% down · 7.5% · 30yr · 1.5% tax · 5.0% vac · 8.0% maint · 8.0% mgmt
Financing live
Cash to close
- Down payment
- $57,500
- Closing costs
- $6,900
- Reserves months
- —
- Total cash needed
- —
Loan-product check · same deal, 3 products live
Conventional
25% down · 7.5% · 30yr
- Down + closing
- —
- Monthly P&I
- —
- Monthly cashflow
- —
- DSCR
- —
- Eligible?
- —
Personal DTI + credit; lowest rate.
DSCR
20% down · 8.5% · 30yr
- Down + closing
- —
- Monthly P&I
- —
- Monthly cashflow
- —
- DSCR
- —
- Eligible?
- —
No personal income docs; deal must DSCR.
Hard money
10% down · 12.0% · 12mo
- Down + closing
- —
- Monthly P&I
- —
- Monthly cashflow
- —
- DSCR
- —
- Eligible?
- —
Short-term bridge; refi at stabilization.
Rent comps 40 comps
| Address | Beds | Baths | Sqft | Rent | $/sqft | DOM | Units | Dist |
|---|---|---|---|---|---|---|---|---|
| 21 Randle Cir SE Washington, DC | 2.0 | 1.0 | 1100 | $2,477 | $2.25 | 25d | 1 | 0.15mi |
| 2932 Nelson Pl SE Unit 1 Washington, DC | 3.0 | 2.0 | 800 | $2,500 | $3.12 | 25d | 1 | 0.18mi |
| 2929 Nelson Pl SE Washington, DC | 2.0 | 1.0 | 800 | $1,900 | $2.38 | 5d | 1 | 0.20mi |
| 2929 Nelson Pl SE Unit 2 Washington, DC | 2.0 | 1.0 | 800 | $1,900 | $2.38 | 25d | 1 | 0.20mi |
| 2925-2929 Pennsylvania Ave SE Unit 106 Washington, DC | 4.0 | 1.0 | 988 | $4,200 | $4.25 | 25d | 1 | 0.37mi |
| 2925-2929 Pennsylvania Ave SE Unit 204 Washington, DC | 3.0 | 1.0 | 980 | $3,000 | $3.06 | 4d | 1 | 0.37mi |
| 2925-2929 Pennsylvania Ave SE Unit 106 Washington, DC | 4.0 | 1.0 | 980 | $4,200 | $4.29 | 4d | 1 | 0.37mi |
| 2418 L'Enfant Sq SE Unit 8 Washington, DC | 2.0 | 2.0 | 960 | $2,400 | $2.50 | 5d | 1 | 0.42mi |
| 1525 28th St SE Unit 302 Washington, DC | 3.0 | 1.0 | 900 | $2,100 | $2.33 | 25d | 1 | 0.44mi |
| 3101 E St SE Washington, DC | 2.0 | 2.0 | 1283 | $2,500 | $1.95 | 21d | 1 | 0.46mi |
| 1707 29th St SE Unit 2 Washington, DC | 2.0 | 1.0 | 1200 | $2,350 | $1.96 | 3d | 1 | 0.50mi |
| 2821 R St SE Washington, DC | 2.0 | 1.0 | 853 | $1,650 | $1.93 | 25d | 1 | 0.50mi |
| 1616 27th St SE Unit 6 Washington, DC | 3.0 | 1.0 | 1100 | $2,850 | $2.59 | 25d | 1 | 0.51mi |
| 2801 R St SE Unit 2 Washington, DC | 2.0 | 1.0 | 700 | $1,569 | $2.24 | 25d | 1 | 0.52mi |
| 1800 28th Pl SE #201 Washington, DC | 3.0 | 2.0 | 1132 | $2,800 | $2.47 | 3d | 1 | 0.56mi |
| 2515 R St SE Washington, DC | 1.0–2.0 | 1.0 | 812 | $1,755 | $2.16 | 6d | 2 | 0.62mi |
| 2215 Minnesota Ave SE Unit 18 Washington, DC | 4.0 | 2.0 | 990 | $4,500 | $4.55 | 25d | 1 | 0.67mi |
| 2215 Minnesota Ave SE Unit 3 Washington, DC | 3.0 | 1.0 | 750 | $2,500 | $3.33 | 25d | 1 | 0.67mi |
| 2440 S St SE Unit 4 Washington, DC | 3.0 | 1.0 | 800 | $2,450 | $3.06 | 8d | 1 | 0.69mi |
| 3313 C St SE Washington, DC | 1.0–2.0 | 1.0 | 750 | $1,343 | $1.79 | 2d | 2 | 0.71mi |
| 3600 Ely Pl SE Washington, DC | 1.0–3.0 | 1.0 | 719 | $2,578 | $3.58 | 3d | 10 | 0.72mi |
| 2003 Fairlawn Ave SE Washington, DC | 4.0 | 2.0 | 1500 | $5,800 | $3.87 | 3d | 1 | 0.76mi |
| 319 Anacostia Rd SE Unit 1 Washington, DC | 2.0 | 1.0 | 724 | $1,035 | $1.43 | 25d | 1 | 0.76mi |
| 1928 Naylor Rd SE Unit 503 Washington, DC | 2.0 | 2.0 | 750 | $1,595 | $2.13 | 15d | 1 | 0.77mi |
| 1928 Naylor Rd SE Unit 102 Washington, DC | 2.0 | 2.0 | 750 | $1,482 | $1.98 | 2d | 1 | 0.77mi |
| 1955 Fairlawn Ave SE Unit 2A Washington, DC | 2.0 | 2.0 | 1000 | $2,499 | $2.50 | 25d | 1 | 0.77mi |
| 305 37th St SE Washington, DC | 1.0–2.0 | 1.0–1.5 | 787 | $1,550 | $1.97 | 25d | 1 | 0.83mi |
| 2562 Naylor Rd SE Washington, DC | 1.0–2.0 | 1.0 | 790 | $2,075 | $2.63 | 3d | 21 | 0.84mi |
| 330 37th St SE Unit T2 Washington, DC | 4.0 | 2.0 | 1400 | $3,300 | $2.36 | 25d | 1 | 0.85mi |
| 300 37th St SE Unit 101 Washington, DC | 2.0 | 1.0 | 850 | $1,550 | $1.82 | 25d | 1 | 0.86mi |
| 3532 Minnesota Ave SE Unit 3 Washington, DC | 3.0 | 1.0 | 1100 | $2,500 | $2.27 | 25d | 1 | 0.87mi |
| 1901 C St SE Washington, DC | 2.0 | 1.0–2.0 | 839 | $3,504 | $4.18 | 2d | 11 | 0.90mi |
| 2112 34th St SE Washington, DC | 2.0 | 1.5 | 1284 | $3,300 | $2.57 | 25d | 1 | 0.94mi |
| 1618 18th St SE Unit 1 Washington, DC | 2.0 | 1.0 | 800 | $1,850 | $2.31 | 25d | 1 | 0.94mi |
| 3539 A St SE Washington, DC | 1.0–2.0 | 1.0–2.0 | 807 | $1,403 | $1.74 | 18d | 1 | 0.99mi |
| 2300 Good Hope Rd SE Washington, DC | 2.0 | 1.0–2.0 | 1020 | $1,913 | $1.88 | 25d | 6 | 0.99mi |
| 3738 D St SE Washington, DC | 1.0–2.0 | 1.0 | 542 | $1,549 | $2.86 | 8d | 12 | 0.99mi |
| 2202 U Pl SE Washington, DC | 2.0 | 1.5 | 1232 | $3,500 | $2.84 | 25d | 1 | 1.00mi |
| 6 Barney Cir SE Washington, DC | 3.0 | 1.0 | 1200 | $2,550 | $2.12 | 11d | 1 | 1.01mi |
| 1720 R St SE Washington, DC | 3.0 | 1.0 | 750 | $2,500 | $3.33 | 25d | 1 | 1.01mi |
Listing history 8 events
-
2026-04-27soldstatus $230,000
-
2026-03-30status Pending
-
2026-03-09price $230,000
-
2026-03-05status Active
-
2026-03-02historical
-
2026-02-06price $249,900
-
2026-01-07price $270,750
-
2025-12-02$285,000 Active
ⓘ Source: listings_history table (triggers on properties + properties_extension) + one-shot
backfill from property_details.listing_events for pre-trigger history.
Tax reassessment forecast DC · Partial reset (capped growth)
- Current annual tax
- $543 · $45/mo
- Projected year-2 tax
- $973 · $81/mo
- Expected delta
- +$430/yr (+$36/mo · 79.2%)
ⓘ Screening estimate from a state-policy table — verify with the county assessor before closing.
Climate risk First Street
- Flood 1/10 Low FEMA zone X (unshaded) · 0% chance over 30 yrs
- Wildfire 1/10 Low
- Heat 8/10 Severe 7 d/yr ≥104°F today · 15 d/yr by 30 yrs out
- Wind 4/10 Moderate 17% chance of damaging wind over 30 yrs
- Air quality 4/10 Moderate 4 unhealthy d/yr today · 5 by 30 yrs out
Nearby sold comps map
Loading sold comps map…
Walkable amenities ~0.75 mi
Loading nearby amenities…
Taxation est. · year 1
- Rental income
- $30,755
- − Mortgage interest
- −$12,884
- − Property taxes
- −$543
- − Insurance
- −$1,150
- − Repairs & maintenance
- −$2,460
- − Management
- −$2,460
- − Depreciation
- −$6,691
- Taxable income
- $4,566
- Est. tax owed @ 24.0%
- −$1,096
- After-tax cash flow
- $7,033/yr
For passive investors: Depreciation is non-cash, so a rental often shows a tax loss while cash-flowing — sheltering income. Rental losses are passive: they offset passive income freely, and up to $25,000/yr can offset ordinary (W-2) income if you actively participate and your MAGI is under $100k (phasing out to $0 by $150k); unused losses carry forward. On sale, claimed depreciation is recaptured at up to 25%, and gains may owe capital-gains tax (a 1031 exchange can defer both). Figures are a year-1 estimate at your 24.0% rate — not tax advice; consult a CPA.
Schools (NCES district)
- District
- District Of Columbia Public Schools
- NCES district ID
- 1100030
- Math proficiency
- 33% ▲ 3.00%
- Reading proficiency
- 40% ▲ 5.00%
- Median HH income
- $67,671
- Composite
- 35.84/100
- National rank
- #9606
- State rank
- #8 of 32 in DC
Livability — Washington
- Score
- 73/100
- State rank
- #1
- US rank
- #5327
Category grades
Schools grade is shown separately in the Schools card above.
Census & demographics
- Census place
- Washington, DC
- County
- District of Columbia · 671,873 people
- City population
- 671,873
- Metro
- Washington-Arlington-Alexandria, DC-VA-MD-WV
- Population (ZIP)
- 63,380
- Household income
- $58,296
- Rent vs Own
- Severe rent burden
- 5115.0
Population outlook (District of Columbia County) Hauer SSP2
- Today (2025)
- 821,926 people
- By 2030
- 899,517 · +9.4%
- By 2040
- 1,061,162 · +29.1%
- By 2050
- 1,231,493 · +49.8%
- By 2075
- 1,603,312 · +95.1%
- By 2100
- 1,847,141 · +124.7%
Race, ethnicity, and origin ACS 2023
- Neighborhood character
- Predominantly Black (87%)
- Race & ethnicity
- Black 87% Hispanic / Latino 7% Two or more races 4% White 2%
- Hispanic origin (detail)
- Mexican 1% Dominican 1%
- Foreign-born
- 6% · Canada
- Languages at home
- 91% English-only · Spanish 6% French/Haitian/Cajun 1%
Political lean MEDSL · District of Columbia
- 2024 margin
- Solid D (+86.1) · D 91.2% · R 5.1% · Other 3.8%
- 2008→2024 swing
- +0.1pp no change · 2008: 85.9pp · 2024: 86.1pp
- All cycles
- 2024: D+86.1 2020: D+86.8 2016: D+88.7 2012: D+84.2 2008: D+85.9
Not yet ingested
- Civics
- —
Market trends
- HPI YoY
- ▼ -416.91%
- Current HPI
- 326.4481
- Rent YoY
- ▲ 6.06%
- Metro
- Washington-Arlington-Alexandria, DC-VA-MD-WV
- State GDP YoY
- ▲ 1.33%
- F500 in state
- 6
Industry mix (Fortune 500 HQ in DC)
| Industry | F500 HQs | Revenue |
|---|---|---|
| Financial Services | 1 | $153B |
|
||
| Life Sciences / Industrials | 1 | $25B |
|
||
| Industrial Machinery | 1 | $8B |
|
||
Price history
-19.3% since first listed8 events — show timeline
- 2026-04-27 Sold (Public Records) $230,000 Public Records
- 2026-03-30 Pending — BRIGHT MLS
- 2026-03-09 Price Changed $230,000 BRIGHT MLS
- 2026-03-05 Relisted — BRIGHT MLS
- 2026-03-02 Listing Removed — BRIGHT MLS
- 2026-02-06 Price Changed $249,900 BRIGHT MLS
- 2026-01-07 Price Changed $270,750 BRIGHT MLS
- 2025-12-02 Listed $285,000 BRIGHT MLS
Property tax history
+3.0%/yrLatest (2025): $543 · -0.2% YoY. Source: county tax records.
Cash-flow waterfall
monthlySold comps — $/sqft
last 12 mo · ≤1 miLoading sold comps…