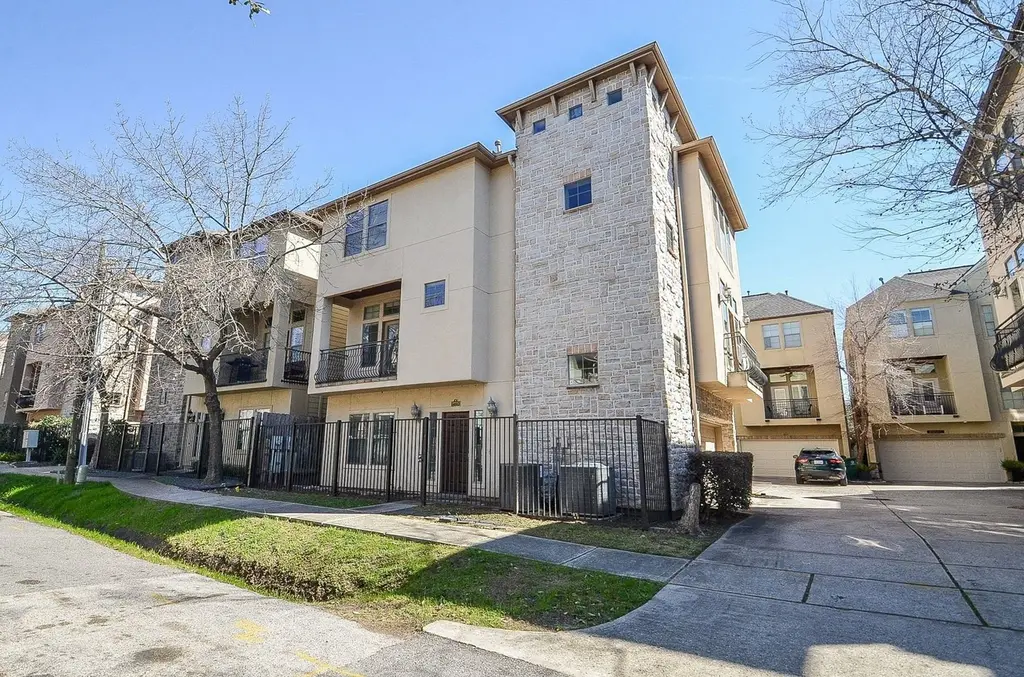
222 Knox St Unit F · Houston, TX
Flood risk 1/10 · Minimal
- FEMA flood zone
- X (unshaded)
- Chance of flooding over 30 yrs
- 0.0%
- Est. flood insurance / yr
- $507 – $1,088
Fire risk 1/10 · Minimal
- Est. fire insurance / yr
- $1,222 – $2,270
Heat risk 9/10 · Severe
- Hot days now (above 109°F)
- 7 days/yr
- Hot days in 30 yrs
- 24 days/yr
Wind risk 9/10 · Severe
- Chance of severe wind over 30 yrs
- 99.0%
Air-quality risk 3/10 · Minor
- Unhealthy air days now
- 2 days/yr
- Unhealthy air days in 30 yrs
- 3 days/yr
Risk factors via First Street. Map © Google.
Why this score? — see what drove the C grade
The composite is a weighted blend of 9 inputs, each scored 0–100. Each bar is that input's sub-score; the figure is the points it added to the 100-point composite (weight × sub-score).
- Cash flow +23.3/30.0
- ARV discount +9.3/15.0
- DSCR +7.5/10.0
- 1% rule +6.9/10.0
- Livability +3.7/5.0
- Schools +2.7/10.0
- Condition / age +2.5/5.0
- Rent growth +2.3/5.0
- Appreciation +0.0/10.0
$469,990
🖨 Deal sheet (PDF) 📄 Offer letter ✓ Due diligence
Listing remarks
Tucked away in a peaceful neighborhood just minutes from Memorial Park, this charming freestanding home offers NO HOA FEE and a LOW TAX RATE. Designed with a spacious layout, the open-concept kitchen features stainless steel appliances and granite countertops—perfect for entertaining. The inviting living room centers around a cozy fireplace, creating a warm and welcoming atmosphere. The primary suite includes a luxurious bathroom with a jetted tub and dual vanities. Each bedroom has its own private en-suite bath for added comfort and convenience. Additional highlights include hardwood floors, oversized two-car garage, a convenient half bath, fresh interior paint, and brand-new carpet.
Key facts
- Open-concept kitchen
- No hoa fee
- Low tax rate
Tags
Property features AI
Exterior
- Parking: Attached garage with 2 parking spaces
- Utilities: Public water; Public sewer
- Home design: Residential property; Built in 2004; Slab foundation
- Construction: Stone and stucco construction; Composition roof; Slab foundation; Built in 2004
- Exterior features: Porch (second level); Composition roof; Stone and stucco exterior
Interior
- Kitchen: Dishwasher; Electric oven; Gas cooktop; Garbage disposal; Microwave; Pantry
- Bedrooms: Primary bedroom on third level (18 x 15); Bedroom on third level (13 x 11); Bedroom on first level (14 x 13)
- Flooring: Carpet; Tile; Wood
- Bathrooms: 3 full bathrooms; 1 half bathroom
- Heating & cooling: Central heating (gas); Central electric air conditioning; Programmable thermostat
- Interior features: Balcony; Crown molding; Double vanity in bathrooms; Granite countertops; Jetted tub; Kitchen open to family room; Primary bedroom with private bath; Pantry; Separate shower; Tub/shower combination; Ceiling fans; Programmable thermostat; Gas log fireplace (1)
- Laundry & utility: Washer hookup; Electric dryer hookup
Neighborhood map
What this means for you Summary
Snapshot
- This is a 4-bed/3.0-bath single-family listed at $470k.
Deal economics
- At list price, monthly cash flow is $860 ($10k/yr) — positive.
- The deal already cash-flows at list — no discount required.
- Meets the 1% rule at list price ($6k rent vs $470k).
- Cap rate 8.5% vs local median 3.1% in Houston — top-decile yield for the area; either an underpriced asset or a hidden risk that comps aren't pricing in. Stress-test before assuming the spread holds.
Location & tenants
- Location reads 74/100 on livability (#184 in TX, #4,771 nationally) — a middle-class / working-renter tenant base. Strengths: amenities A+, cost of living A+, housing A+; Watch: crime F.
- Houston ISD (urban): math 27% / reading 35% proficiency, ranked #593 of 826 in TX (top 72%) — families likely to look elsewhere, expect single-tenant / working-renter base with shorter leases; 71% free/reduced lunch — lower-income household profile, screen leases tightly.
- Zoned schools: Hogg Middle (math 44% / reading 48%, grade D+, #462 of 1,662 statewide, top 28%, 1,120 students, 52% FRL); Lamar H S (math 38% / reading 65%, grade D+, #478 of 1,632 statewide, top 29%, 3,125 students, 49% FRL) — zoned schools average 50% FRL vs 71% district-wide (21 pts lower); this property's tenant base skews higher-income than the district average.
- Zoned-school proficiency averages 49% at this address vs 31% district-wide (+18 pts) — the actual schools serving this property are materially stronger than the Houston ISD average implies; a family-tenant draw the district grade alone would hide.
- Market conditions: Rents soft (-0.8%/yr); 651 active listings in the ZIP; 38 comparable units currently listed for rent nearby; rentals at typical pace (median 25d on market — plan ~3-4 weeks tenant-placement turnaround); 45% of comp listings sitting > 30 days — soft ceiling on asking rent; high-income renter base; 29,883 units permitted in Harris County in 2024 (8,621 in 5+ unit buildings).
- At $5,580/mo this rent would consume 46% of the median local household income ($145k/yr) (locally 1812% of renters already pay >50% of income on rent) — very limited rent-growth headroom before tenants either downsize or default.
Forward outlook
- Local home prices are declining (-3.0%/yr); year-one equity from $3k of loan paydown is wiped out by about $14k of value loss. Plan a longer hold.
- Harris County population projected at +47% by 2050 — long-run rental-demand tailwind backs the buy-and-hold thesis.
Negotiation context
- Only 6 days on market — expect competitive offers; lowballing is unlikely to land.
- 6 sale attempts since 2y ago with the ask held roughly flat each time — persistent listings suggest the price (not the market) is what's stuck; bring a comps-based counter.
Risks & watch-outs
- Climate carrying-cost: severe wind risk, 99% chance of damaging wind over 30y; extreme-heat days projected 7→24/yr by 2055 (HVAC capex compounding) — expect insurance premiums to compound above CPI over the hold.
Questions for the listing agent
- Is there a deadline driving the sale (1031 exchange, divorce, estate, relocation)? That informs how much negotiation room exists.
- Schools are D-rated, which usually means shorter tenancies and higher turnover. Who's the typical renter profile here, and what's been the actual vacancy rate?
- Crime grade is F in this area — have there been break-ins, vandalism, or insurance claims at this property in the last 3 years? What carrier currently insures it and at what premium?
- What's the average days-on-market for RENTAL listings here right now (not sales)? A rising rental-DOM trend means longer vacancies and softer asking-rent achievability than the comps imply.
- What's the recent tenant-quality profile in this submarket — average credit score on applications, eviction rate, late-payment / NSF rate, and stable-employment percentage? A property-management company in the area should have these aggregated.
- How much new for-sale + rental construction is in the pipeline within 1–3 miles? Heavy new supply typically softens prices + rents 12–24 months out; constrained supply supports both.
Investment metrics
- 1% rule
- 1.19% ✓
- Cap rate
- 8.49%
- Cash-on-cash
- 7.84%
- DSCR
- 1.35
- GRM
- 7.0
CMA / ARV
- ARV (median comp)
- $489,615
- List price
- $469,990
- Delta
- -2.98%
- Verdict
- FAIR
- Comps
- 20 within 1.0 mi
Show comp detail 12 sales within ~0.75 mi
| Address | Dist | Beds/Ba | Sqft | Sold | Price | $/sf | Match |
|---|---|---|---|---|---|---|---|
| 5612 Lacy St | 0.13mi | 3/3.5 (-1) | 2,380 (-5%) | 1mo | $547,000 | $230 | 77 |
| 604 Knox St | 0.27mi | 3/3.5 (-1) | 2,466 (-2%) | 3mo | $629,999 | $255 | 75 |
| 509 Malone St | 0.23mi | 3/2.5 (-1) | 2,626 (+4%) | 2mo | $680,000 | $259 | 74 |
| 5713 Rose St Unit C | 0.35mi | 3/3.5 (-1) | 2,556 (+2%) | 2mo | $595,000 | $233 | 72 |
| 802 Detering St | 0.46mi | 3/3.0 (-1) | 2,567 (+2%) | 1mo | $645,000 | $251 | 69 |
| 5202 Chandler St | 0.43mi | 3/2.5 (-1) | 2,362 (-6%) | 1mo | $615,000 | $260 | 62 |
| 5218A Rose St | 0.53mi | 3/3.5 (-1) | 2,380 (-5%) | 0mo | $600,000 | $252 | 59 |
| 5209 Gibson St Unit A | 0.45mi | 3/3.5 (-1) | 2,688 (+7%) | 2mo | $650,000 | $242 | 59 |
| 5203 Lillian St | 0.59mi | 3/3.5 (-1) | 2,437 (-3%) | 2mo | $674,000 | $277 | 59 |
| 906 Reinerman St | 0.63mi | 3/3.5 (-1) | 2,422 (-4%) | 2mo | $449,000 | $185 | 56 |
| 5602 Schuler St | 0.63mi | 3/3.5 (-1) | 2,677 (+6%) | 1mo | $495,000 | $185 | 52 |
| 1510 Birdsall St | 0.74mi | 3/3.5 (-1) | 2,268 (-10%) | 1mo | $389,000 | $172 | 42 |
Match score weights: distance 35% · size 25% · config 20% · recency 20%. Top-matched comps best support the ARV.
Projected returns pro-forma
-3.0% appreciation · 0.0% rent growth · sell at horizon
- IRR
- -8.0%
- Equity multiple
- 0.72×
- Total profit
- $-37,481
- Equity at exit
- $70,077
- IRR
- -3.2%
- Equity multiple
- 0.82×
- Total profit
- $-24,228
- Equity at exit
- $40,636
Cash invested: $131,597 (down + closing). Projections, not guarantees.
Landlord ↔ Tenant lean methodology
- Overall (STATE)
- 87 Strongly Landlord-Friendly
- State Texas
- 87 Strongly Landlord-Friendly · R+5
- County
- — inherits STATE
- City
- — inherits STATE
ZIP-level market 77007
- Rents YoY
- -0.8%
- Active inventory
- 651
- Price-to-rent
- 7.0×
Monthly cashflow live
- Estimated rent
- $5,580 high interval (Pro) →
- Mortgage (P&I)
- −$2,465
- Tax from tax record
- −$888 /mo · $10,653/yr
- Insurance
- −$196
- HOA
- −$0
- Vacancy / Maint / Mgmt
- −$1,172
- Net cashflow
- $860
Break-even live
Sensitivity live
| Price | -10% $1,126 | -5% $993 | +0% $860 | +5% $727 | +10% $594 |
|---|---|---|---|---|---|
| Rent | -10% $419 | -5% $639 | +0% $860 | +5% $1,080 | +10% $1,301 |
| Rate | -1.0pp $1,096 | -0.5pp $979 | base $860 | +0.5pp $738 | +1.0pp $614 |
UW: 25.0% down · 7.5% · 30yr · 1.5% tax · 5.0% vac · 8.0% maint · 8.0% mgmt
Financing live
Cash to close
- Down payment
- $117,498
- Closing costs
- $14,100
- Reserves months
- —
- Total cash needed
- —
Loan-product check · same deal, 3 products live
Conventional
25% down · 7.5% · 30yr
- Down + closing
- —
- Monthly P&I
- —
- Monthly cashflow
- —
- DSCR
- —
- Eligible?
- —
Personal DTI + credit; lowest rate.
DSCR
20% down · 8.5% · 30yr
- Down + closing
- —
- Monthly P&I
- —
- Monthly cashflow
- —
- DSCR
- —
- Eligible?
- —
No personal income docs; deal must DSCR.
Hard money
10% down · 12.0% · 12mo
- Down + closing
- —
- Monthly P&I
- —
- Monthly cashflow
- —
- DSCR
- —
- Eligible?
- —
Short-term bridge; refi at stabilization.
Rent comps 38 comps
| Address | Beds | Baths | Sqft | Rent | $/sqft | DOM | Units | Dist |
|---|---|---|---|---|---|---|---|---|
| 929 Westcott St Houston, TX | 1.0–3.0 | 1.0–3.0 | 1375 | $9,263 | $6.74 | 0d | 21 | 0.45mi |
| 5237 Center St Houston, TX | 3.0 | 3.0 | 2284 | $2,995 | $1.31 | 44d | 1 | 0.60mi |
| 5610 Schuler St Houston, TX | 3.0 | 3.5 | 2614 | $3,111 | $1.19 | 6d | 1 | 0.61mi |
| 5305 Nett St Unit A Houston, TX | 3.0 | 3.5 | 2104 | $2,950 | $1.40 | 25d | 1 | 0.61mi |
| 5811 Maxie St Houston, TX | 3.0 | 3.5 | 2226 | $3,000 | $1.35 | 44d | 1 | 0.68mi |
| 707 Marston St Unit 510 Houston, TX | 3.0 | 2.0 | 2310 | $12,474 | $5.40 | 0d | 1 | 0.96mi |
| 4608 Nett St Houston, TX | 3.0 | 4.0 | 2261 | $3,750 | $1.66 | 44d | 1 | 0.97mi |
| 2103 Radcliffe St Unit 1225772P Houston, TX | 3.0 | 2.0 | 1797 | $4,729 | $2.63 | 8d | 1 | 1.00mi |
| 4917 Nolda St Houston, TX | 3.0 | 3.5 | 1764 | $5,000 | $2.83 | 25d | 1 | 1.01mi |
| 1027 Gross St Houston, TX | 4.0 | 3.5 | 3035 | $5,800 | $1.91 | 44d | 1 | 1.03mi |
| 811 Buffalo Park Dr Unit 844 Houston, TX | 3.0 | 2.0 | 3632 | $14,913 | $4.11 | 14d | 1 | 1.04mi |
| 811 Buffalo Park Dr Unit 510 Houston, TX | 3.0 | 2.0 | 3632 | $15,424 | $4.25 | 12d | 1 | 1.04mi |
| 811 Buffalo Park Dr Unit 3187 Houston, TX | 3.0 | 2.0 | 3632 | $15,384 | $4.24 | 0d | 1 | 1.04mi |
| 4307 Feagan St Unit A Houston, TX | 3.0 | 4.0 | 2412 | $3,590 | $1.49 | 0d | 1 | 1.05mi |
| 4444 Center St Houston, TX | 3.0 | 3.0 | 2121 | $3,200 | $1.51 | 44d | 1 | 1.05mi |
| 2210 Radcliffe St Houston, TX | 3.0 | 3.5 | 2066 | $2,716 | $1.31 | 8d | 1 | 1.07mi |
| 913 Thompson St #913 Houston, TX | 4.0 | 3.5 | 3200 | $8,500 | $2.66 | 25d | 1 | 1.09mi |
| 915 Thompson St Unit 915 Houston, TX | 4.0 | 3.5 | 3200 | $8,500 | $2.66 | 25d | 1 | 1.09mi |
| 911 Thompson St #911 Houston, TX | 4.0 | 3.5 | 3200 | $8,500 | $2.66 | 25d | 1 | 1.09mi |
| 917 Thompson St Unit 917 Houston, TX | 4.0 | 3.5 | 3200 | $8,000 | $2.50 | 25d | 1 | 1.10mi |
| 1958 W Gray St Unit 3165 Houston, TX | 3.0 | 2.0 | 3206 | $15,010 | $4.68 | 0d | 1 | 1.11mi |
| 1958 W Gray St Unit 1991 Houston, TX | 3.0 | 2.0 | 3206 | $15,050 | $4.69 | 11d | 1 | 1.11mi |
| 5336 Darling St Unit 1225767P Houston, TX | 3.0 | 3.0 | 2292 | $5,997 | $2.62 | 0d | 1 | 1.13mi |
| 5732 Darling St Unit 1056419P Houston, TX | 3.0 | 3.5 | 2400 | $7,771 | $3.24 | 44d | 1 | 1.14mi |
| 5620 Petty St Houston, TX | 4.0 | 3.5 | 2891 | $8,750 | $3.03 | 44d | 1 | 1.16mi |
| 5620 Petty St Unit 1019538P Houston, TX | 4.0 | 3.5 | 2884 | $16,259 | $5.64 | 23d | 1 | 1.16mi |
| 5108 Larkin St Houston, TX | 3.0 | 3.5 | 2108 | $2,850 | $1.35 | 45d | 1 | 1.16mi |
| 5235 Petty St Unit B Houston, TX | 3.0 | 2.5 | 2532 | $3,000 | $1.18 | 44d | 1 | 1.18mi |
| 4510 Inker St Houston, TX | 4.0 | 4.0 | 2293 | $4,500 | $1.96 | 44d | 1 | 1.19mi |
| 5530 Kiam St Houston, TX | 4.0 | 2.5 | 2688 | $9,750 | $3.63 | 44d | 1 | 1.20mi |
| 5530 Kiam St Unit 1019540P Houston, TX | 4.0 | 2.5 | 2680 | $15,799 | $5.90 | 44d | 1 | 1.20mi |
| 1221 Bonner St Houston, TX | 3.0 | 3.5 | 2252 | $3,200 | $1.42 | 44d | 1 | 1.22mi |
| 5427 Kansas St Houston, TX | 3.0 | 4.0 | 2156 | $2,700 | $1.25 | 44d | 1 | 1.22mi |
| 543 T C Jester Blvd Unit 1225766P Houston, TX | 3.0 | 3.5 | 2389 | $5,557 | $2.33 | 0d | 1 | 1.23mi |
| 1951 W Bell St Houston, TX | 3.0 | 2.0 | 1800 | $2,400 | $1.33 | 15d | 1 | 1.25mi |
| 1951 W Bell St Houston, TX | 3.0 | 2.0 | 1800 | $2,400 | $1.33 | 44d | 1 | 1.25mi |
| 4311 Marina St Houston, TX | 3.0 | 4.0 | 2328 | $3,599 | $1.55 | 44d | 1 | 1.26mi |
| 2024 Welch St Houston, TX | 3.0 | 4.0 | 2294 | $2,800 | $1.22 | 44d | 1 | 1.29mi |
Listing history 23 events
-
2026-06-21days on market $469,990 Active 6 DOM
-
2026-06-18days on market $469,990 Active 3 DOM
-
2026-06-17days on market $469,990 Active 2 DOM
-
2026-06-15pricedays on market $469,990 Active 1 DOM
-
2026-06-13days on market $475,000 Active 106 DOM
-
2026-06-10days on market $475,000 Active 102 DOM
-
2026-06-08days on market $475,000 Active 101 DOM
-
2026-06-07days on market $475,000 Active 100 DOM
-
2026-06-04days on market $475,000 Active 97 DOM
-
2026-06-01days on market $475,000 Active 94 DOM
-
2026-05-31days on market $475,000 Active 93 DOM
-
2026-05-01price $475,000 773-char remark
-
2026-02-27$499,900 Active 773-char remark
-
2026-02-11historical $3,600
-
2026-02-11historical
-
2026-01-08$520,000 Active
-
2025-11-04historical
-
2025-07-10$520,000 Active
-
2025-07-08$3,600
-
2025-05-31historical
-
2024-11-14$568,000 Active
-
2011-06-30soldstatus
-
2006-01-10soldstatus
ⓘ Source: listings_history table (triggers on properties + properties_extension) + one-shot
backfill from property_details.listing_events for pre-trigger history.
Tax reassessment forecast TX · Resets to sale price
- Current annual tax
- $10,653 · $888/mo
- Projected year-2 tax
- $10,653 · $888/mo
- Expected delta
- $0/yr ($0/mo · 0.0%)
ⓘ Screening estimate from a state-policy table — verify with the county assessor before closing.
Climate risk First Street
- Flood 1/10 Low FEMA zone X (unshaded) · 0% chance over 30 yrs
- Wildfire 1/10 Low
- Heat 9/10 Extreme 7 d/yr ≥109°F today · 24 d/yr by 30 yrs out
- Wind 9/10 Extreme 99% chance of damaging wind over 30 yrs
- Air quality 3/10 Moderate 2 unhealthy d/yr today · 3 by 30 yrs out
Nearby sold comps map
Loading sold comps map…
Walkable amenities ~0.75 mi
Loading nearby amenities…
Taxation est. · year 1
- Rental income
- $66,958
- − Mortgage interest
- −$26,327
- − Property taxes
- −$10,653
- − Insurance
- −$2,350
- − Repairs & maintenance
- −$5,357
- − Management
- −$5,357
- − Depreciation
- −$13,672
- Taxable income
- $3,242
- Est. tax owed @ 24.0%
- −$778
- After-tax cash flow
- $9,539/yr
For passive investors: Depreciation is non-cash, so a rental often shows a tax loss while cash-flowing — sheltering income. Rental losses are passive: they offset passive income freely, and up to $25,000/yr can offset ordinary (W-2) income if you actively participate and your MAGI is under $100k (phasing out to $0 by $150k); unused losses carry forward. On sale, claimed depreciation is recaptured at up to 25%, and gains may owe capital-gains tax (a 1031 exchange can defer both). Figures are a year-1 estimate at your 24.0% rate — not tax advice; consult a CPA.
Schools (NCES district)
- District
- Houston ISD
- NCES district ID
- 4823640
- Math proficiency
- 27% ▼ -18.00%
- Reading proficiency
- 35% ▼ -6.00%
- Median HH income
- $46,054
- Composite
- 26.63/100
- National rank
- #7173
- State rank
- #593 of 826 in TX
Livability — Houston
- Score
- 74/100
- State rank
- #184
- US rank
- #4771
Category grades
Schools grade is shown separately in the Schools card above.
Census & demographics
- Census place
- Houston, TX
- County
- Harris County · 4,702,590 people
- City population
- 3,226,434
- Metro
- Houston-The Woodlands-Sugar Land, TX
- Population (ZIP)
- 47,808
- Household income
- $144,911
- Rent vs Own
- Severe rent burden
- 1812.0
Population outlook (Harris County) Hauer SSP2
- Today (2025)
- 5,571,493 people
- By 2030
- 6,089,821 · +9.3%
- By 2040
- 7,142,806 · +28.2%
- By 2050
- 8,185,864 · +46.9%
- By 2075
- 10,574,329 · +89.8%
- By 2100
- 12,109,958 · +117.4%
Race, ethnicity, and origin ACS 2023
- Neighborhood character
- Diverse neighborhood (Simpson 0.63)
- Race & ethnicity
- White 57% Hispanic / Latino 17% Two or more races 13% Asian 11% Black 9%
- Hispanic origin (detail)
- Mexican 12%
- Common ancestry
- Slovak 3% Romanian 3% Italian 3%
- Foreign-born
- 19% · Canada, China, South Korea
- Languages at home
- 75% English-only · Spanish 12% Other Indo-European 4% Chinese 2%
Political lean MEDSL · Harris
- 2024 margin
- Lean D (+5.5) · D 52.0% · R 46.4% · Other 1.6%
- 2008→2024 swing
- +3.9pp toward D · 2008: 1.6pp · 2024: 5.5pp
- All cycles
- 2024: D+5.5 2020: D+13.3 2016: D+12.4 2012: D+0.1 2008: D+1.6
Not yet ingested
- Civics
- —
Market trends
- HPI YoY
- ▼ -219.42%
- Current HPI
- 159.8157
- Rent YoY
- ▼ -0.83%
- Metro
- Houston-The Woodlands-Sugar Land, TX
- State GDP YoY
- ▲ 3.95%
- F500 in state
- 110
Industry mix (Fortune 500 HQ in TX)
| Industry | F500 HQs | Revenue |
|---|---|---|
| Energy | 16 | $1,198B |
|
||
| Technology | 5 | $198B |
|
||
| Engineering / Construction | 4 | $72B |
|
||
| Energy Services | 3 | $60B |
|
||
| Utilities | 3 | $41B |
|
||
| Healthcare | 2 | $330B |
|
||
Price history
-17.3% since first listed14 events — show timeline
- 2026-06-15 Listed $469,990 HARMLS
- 2026-06-14 Listing Removed — HARMLS
- 2026-05-01 Price Changed $475,000 HARMLS
- 2026-02-27 Listed $499,900 HARMLS
- 2026-02-11 Rental Removed $3,600 HARMLS
- 2026-02-11 Listing Removed — HARMLS
- 2026-01-08 Listed $520,000 HARMLS
- 2025-11-04 Listing Removed — HARMLS
- 2025-07-10 Listed $520,000 HARMLS
- 2025-07-08 Listed for Rent $3,600 HARMLS
- 2025-05-31 Listing Removed — HARMLS
- 2024-11-14 Listed $568,000 HARMLS
- 2011-06-30 Sold (Public Records) — Public Records
- 2006-01-10 Sold (Public Records) — Public Records
Property tax history
+4.7%/yrLatest (2025): $10,653 · +3.4% YoY. Source: county tax records.
Cash-flow waterfall
monthlySold comps — $/sqft
last 12 mo · ≤1 miLoading sold comps…