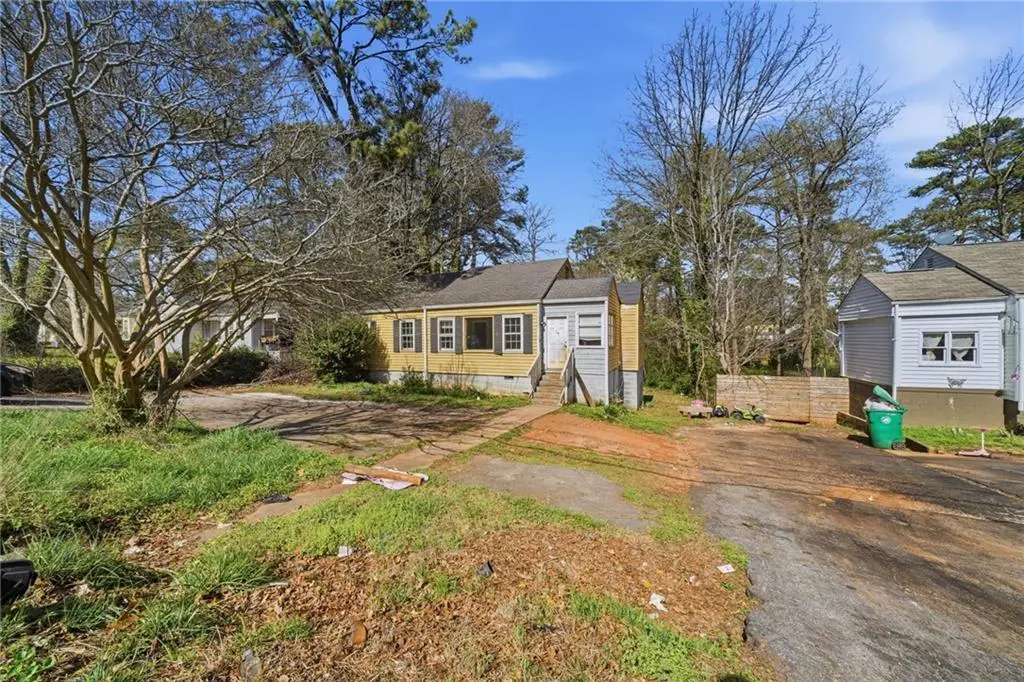
1564 Columbia Dr · Belvedere Park, GA
Flood risk 1/10 · Minimal
- FEMA flood zone
- X (unshaded)
- Chance of flooding over 30 yrs
- 0.0%
- Est. flood insurance / yr
- $507 – $1,088
Fire risk 1/10 · Minimal
- Est. fire insurance / yr
- $963 – $1,789
Heat risk 5/10 · Moderate
- Hot days now (above 104°F)
- 7 days/yr
- Hot days in 30 yrs
- 16 days/yr
Wind risk 5/10 · Moderate
- Chance of severe wind over 30 yrs
- 25.0%
Air-quality risk 5/10 · Moderate
- Unhealthy air days now
- 6 days/yr
- Unhealthy air days in 30 yrs
- 8 days/yr
Risk factors via First Street. Map © Google.
Why this score? — see what drove the B- grade
The composite is a weighted blend of 9 inputs, each scored 0–100. Each bar is that input's sub-score; the figure is the points it added to the 100-point composite (weight × sub-score).
- Cash flow +24.7/30.0
- ARV discount +15.0/15.0
- DSCR +8.0/10.0
- 1% rule +7.5/10.0
- Livability +3.4/5.0
- Rent growth +2.8/5.0
- Condition / age +2.5/5.0
- Schools +2.1/10.0
- Appreciation +0.0/10.0
$136,000
🖨 Deal sheet (PDF) 📄 Offer letter ✓ Due diligence
Listing remarks MLS
Excellent investment opportunity with strong rental potential. This 3-bedroom, 2-bath property offers a functional layout, updated kitchen, and low-maintenance features ideal for long-term tenants. Located in a high-demand rental area near shopping, schools, and major commuter routes. Spacious backyard and solid structure provide additional value-add potential. Great option for buy-and-hold investors, portfolio expansion, or first-time investors seeking steady cash flow.
Key facts
- 0.39 acre lot
- Built 1949
- Listed 96 days
Neighborhood map
What this means for you Summary
Snapshot
- This is a 3-bed/1.0-bath single-family listed at $136k.
Deal economics
- At list price, monthly cash flow is $285 ($3k/yr) — positive.
- The deal already cash-flows at list — no discount required.
- Meets the 1% rule at list price ($2k rent vs $136k).
- Recommended offer: $124k (9.0% below list) — sets the bar for market timing.
- Cap rate 8.8% vs local median 3.7% in Belvedere Park — top-decile yield for the area; either an underpriced asset or a hidden risk that comps aren't pricing in. Stress-test before assuming the spread holds.
Location & tenants
- Location reads 68/100 on livability (#153 in GA) — a middle-class / working-renter tenant base. Strengths: cost of living A+, housing A+; Watch: amenities F, commute F, health & safety F.
- Dekalb County (suburban): math 19% / reading 28% proficiency, ranked #125 of 174 in GA (top 72%) — low school quality limits family demand, transient renter base, plan for 1-2y turnover; 68% free/reduced lunch — lower-income household profile, screen leases tightly.
- Zoned schools: Peachcrest Elementary School (math 2% / reading 8%, grade F, #1,160 of 1,228 statewide, top 98%, 677 students, 100% FRL); The Champion Middle Theme School (math 21% / reading 52%, grade F, #167 of 470 statewide, top 38%, 751 students, 100% FRL); Towers High School (math 2% / reading 12%, grade F, #385 of 424 statewide, top 92%, 764 students, 100% FRL) — zoned schools average 100% FRL vs 68% district-wide (32 pts higher); higher-poverty schools than district average — tighter screening recommended.
- Market conditions: Rents rising (+1.3%/yr); 431 active listings in the ZIP; 40 comparable units currently listed for rent nearby; rentals at typical pace (median 26d on market — plan ~3-4 weeks tenant-placement turnaround); 1,240 units permitted in DeKalb County in 2024 (385 in 5+ unit buildings).
- This rent runs 32% of the median local income ($63k/yr) — at the standard rent-burdened threshold; future hikes will face affordability resistance.
Forward outlook
- Local home prices are declining (-3.0%/yr); year-one equity from $940 of loan paydown is wiped out by about $4k of value loss. Plan a longer hold.
- DeKalb County population projected at +28% by 2050 — long-run rental-demand tailwind backs the buy-and-hold thesis.
Negotiation context
- It's been on market 96 days — a 9% lower offer ($124k) is reasonable based on typical stale-listing flexibility.
- 5 sale attempts since 18y ago with the ask held roughly flat each time — persistent listings suggest the price (not the market) is what's stuck; bring a comps-based counter.
Risks & watch-outs
- Watch-outs: property tax is 2.5% of price; built in 1949 — expect roof / HVAC / electrical / plumbing capex.
- Climate carrying-cost: moderate wind risk, 25% chance of damaging wind over 30y; extreme-heat days projected 7→16/yr by 2055 (HVAC capex compounding) — expect insurance premiums to compound above CPI over the hold.
Questions for the listing agent
- It's been on market 96 days. Have you received any prior offers? Is the seller open to a 9% concession, seller financing, or rate buy-down credit?
- Built in 1949 — when were the roof, HVAC, electrical panel, plumbing, and water heater last replaced?
- Property tax is high relative to price — has the assessment been appealed recently, and will the sale trigger a re-assessment?
- Why hasn't it sold? Are there any deal-killer items the seller is aware of (foundation, flood, title, zoning, code violations)?
- Is there a deadline driving the sale (1031 exchange, divorce, estate, relocation)? That informs how much negotiation room exists.
- Schools are F-rated, which usually means shorter tenancies and higher turnover. Who's the typical renter profile here, and what's been the actual vacancy rate?
- What's the average days-on-market for RENTAL listings here right now (not sales)? A rising rental-DOM trend means longer vacancies and softer asking-rent achievability than the comps imply.
- What's the recent tenant-quality profile in this submarket — average credit score on applications, eviction rate, late-payment / NSF rate, and stable-employment percentage? A property-management company in the area should have these aggregated.
- How much new for-sale + rental construction is in the pipeline within 1–3 miles? Heavy new supply typically softens prices + rents 12–24 months out; constrained supply supports both.
Investment metrics
- 1% rule
- 1.25% ✓
- Cap rate
- 8.81%
- Cash-on-cash
- 8.99%
- DSCR
- 1.40
- GRM
- 6.7
CMA / ARV
- ARV (median comp)
- $237,002
- List price
- $136,000
- Delta
- -42.62%
- Verdict
- UNDERPRICED
- Comps
- 20 within 1.0 mi
Show comp detail 12 sales within ~0.75 mi
| Address | Dist | Beds/Ba | Sqft | Sold | Price | $/sf | Match |
|---|---|---|---|---|---|---|---|
| 1737 Mckenzie Dr | 0.22mi | 3/1.0 | 1,125 (+2%) | 2mo | $204,000 | $181 | 85 |
| 1766 Mckenzie Dr | 0.24mi | 3/1.0 | 1,125 (+2%) | 4mo | $172,000 | $153 | 83 |
| 1546 Alverado Way | 0.33mi | 3/2.0 | 1,157 (+5%) | 2mo | $290,000 | $251 | 71 |
| 3012 Monterey Dr | 0.53mi | 3/2.0 | 1,092 (-1%) | 3mo | $275,000 | $252 | 67 |
| 3340 Pinehill Dr | 0.47mi | 3/1.5 | 1,058 (-4%) | 3mo | $168,500 | $159 | 67 |
| 3094 Santa Monica Dr | 0.28mi | 3/1.5 | 1,213 (+10%) | 3mo | $185,000 | $153 | 66 |
| 2996 Laguna Dr | 0.62mi | 3/2.0 | 1,140 (+3%) | 1mo | $290,000 | $254 | 60 |
| 3449 Misty Valley Rd | 0.61mi | 3/1.5 | 1,059 (-4%) | 3mo | $168,000 | $159 | 60 |
| 1903 Wildwood Dr | 0.74mi | 3/2.0 | 1,107 (+0%) | 3mo | $350,000 | $316 | 59 |
| 3406 Jackson Dr | 0.61mi | 3/1.0 | 1,018 (-8%) | 4mo | $240,000 | $236 | 55 |
| 3723 Glenwood Rd | 0.59mi | 2/1.0 (-1) | 1,024 (-7%) | 1mo | $175,000 | $171 | 55 |
| 1616 Cobbs Creek Ln | 0.58mi | 2/2.0 (-1) | 1,236 (+12%) | 4mo | $183,000 | $148 | 41 |
Match score weights: distance 35% · size 25% · config 20% · recency 20%. Top-matched comps best support the ARV.
Projected returns pro-forma
-3.0% appreciation · 1.34% rent growth · sell at horizon
- IRR
- -4.7%
- Equity multiple
- 0.83×
- Total profit
- $-6,567
- Equity at exit
- $20,278
- IRR
- 2.8%
- Equity multiple
- 1.18×
- Total profit
- $6,997
- Equity at exit
- $11,759
Cash invested: $38,080 (down + closing). Projections, not guarantees.
Landlord ↔ Tenant lean methodology
- Overall (STATE)
- 90 Strongly Landlord-Friendly
- State Georgia
- 90 Strongly Landlord-Friendly · R+3
- County
- — inherits STATE
- City
- — inherits STATE
ZIP-level market 30032
- Rents YoY
- 1.3%
- Active inventory
- 431
- Price-to-rent
- 6.7×
Monthly cashflow live
- Estimated rent
- $1,696 high interval (Pro) →
- Mortgage (P&I)
- −$713
- Tax from tax record
- −$285 /mo · $3,418/yr
- Insurance
- −$57
- HOA
- −$0
- Vacancy / Maint / Mgmt
- −$356
- Net cashflow
- $285
Break-even live
Sensitivity live
| Price | -10% $362 | -5% $324 | +0% $285 | +5% $247 | +10% $208 |
|---|---|---|---|---|---|
| Rent | -10% $151 | -5% $218 | +0% $285 | +5% $352 | +10% $419 |
| Rate | -1.0pp $354 | -0.5pp $320 | base $285 | +0.5pp $250 | +1.0pp $214 |
UW: 25.0% down · 7.5% · 30yr · 1.5% tax · 5.0% vac · 8.0% maint · 8.0% mgmt
Financing live
Cash to close
- Down payment
- $34,000
- Closing costs
- $4,080
- Reserves months
- —
- Total cash needed
- —
Loan-product check · same deal, 3 products live
Conventional
25% down · 7.5% · 30yr
- Down + closing
- —
- Monthly P&I
- —
- Monthly cashflow
- —
- DSCR
- —
- Eligible?
- —
Personal DTI + credit; lowest rate.
DSCR
20% down · 8.5% · 30yr
- Down + closing
- —
- Monthly P&I
- —
- Monthly cashflow
- —
- DSCR
- —
- Eligible?
- —
No personal income docs; deal must DSCR.
Hard money
10% down · 12.0% · 12mo
- Down + closing
- —
- Monthly P&I
- —
- Monthly cashflow
- —
- DSCR
- —
- Eligible?
- —
Short-term bridge; refi at stabilization.
Rent comps 40 comps
| Address | Beds | Baths | Sqft | Rent | $/sqft | DOM | Units | Dist |
|---|---|---|---|---|---|---|---|---|
| 1752 Lynn Ln Decatur, GA | 3.0 | 2.0 | 1390 | $1,950 | $1.40 | 45d | 1 | 0.25mi |
| 3191 Bluebird Ln Decatur, GA | 4.0 | 2.0 | 1300 | $7,250 | $5.58 | 25d | 1 | 0.35mi |
| 3365 Columbia Trce Decatur, GA | 3.0 | 2.0 | 1252 | $1,450 | $1.16 | 6d | 1 | 0.39mi |
| 3381 Columbia Trce Decatur, GA | 3.0 | 2.0 | 1252 | $1,450 | $1.16 | 6d | 1 | 0.42mi |
| 3395 Columbia Trce Decatur, GA | 3.0 | 2.0 | 1252 | $1,450 | $1.16 | 25d | 1 | 0.45mi |
| 3010 Santa Monica Dr Decatur, GA | 4.0 | 2.0 | 1392 | $2,095 | $1.51 | 45d | 1 | 0.46mi |
| 3024 Pasadena Dr Decatur, GA | 3.0 | 2.0 | 1079 | $1,958 | $1.81 | 0d | 1 | 0.47mi |
| 3405 Cobbs Ferry Dr Unit 3405 Decatur, GA | 3.0 | 2.0 | 1331 | $1,550 | $1.16 | 45d | 1 | 0.47mi |
| 1855 Shamrock Dr Decatur, GA | 3.0 | 2.0 | 1310 | $1,771 | $1.35 | 6d | 1 | 0.50mi |
| 1873 Shamrock Dr Decatur, GA | 4.0 | 1.5 | 1492 | $1,075 | $0.72 | 6d | 1 | 0.54mi |
| 3432 Cobbs Ferry Dr Decatur, GA | 3.0 | 2.0 | 1252 | $1,450 | $1.16 | 6d | 1 | 0.57mi |
| 1598 San Gabriel Ave Decatur, GA | 3.0 | 2.0 | 1451 | $2,023 | $1.39 | 25d | 1 | 0.58mi |
| 3445 Cobbs Ferry Dr Decatur, GA | 3.0 | 2.0 | 1252 | $1,450 | $1.16 | 25d | 1 | 0.60mi |
| 1693 San Gabriel Ave Decatur, GA | 3.0 | 2.0 | 1265 | $1,995 | $1.58 | 5d | 1 | 0.61mi |
| 1689 San Gabriel Ave Decatur, GA | 3.0 | 1.0 | 989 | $1,450 | $1.47 | 45d | 1 | 0.62mi |
| 3485 Cobbs Ferry Dr Decatur, GA | 3.0 | 2.0 | 1252 | $1,450 | $1.16 | 25d | 1 | 0.63mi |
| 3427 Jackson Dr Decatur, GA | 3.0 | 2.0 | 1400 | $1,900 | $1.36 | 20d | 1 | 0.65mi |
| 4100 Glenwood Rd Decatur, GA | 1.0–2.0 | 1.0–1.5 | 925 | $1,450 | $1.57 | 6d | 17 | 0.67mi |
| 1428 David Cir Unit A11 Decatur, GA | 3.0 | 1.5 | 1362 | $1,830 | $1.34 | 45d | 1 | 0.69mi |
| 1387 Midview Dr Decatur, GA | 3.0 | 1.0 | 1026 | $1,750 | $1.71 | 45d | 1 | 0.70mi |
| 1932 Rosewood Rd Decatur, GA | 4.0 | 2.5 | 1215 | $1,485 | $1.22 | 14d | 1 | 0.71mi |
| 1932 Rosewood Rd Decatur, GA | 4.0 | 2.5 | 1294 | $1,120 | $0.87 | 25d | 1 | 0.71mi |
| 1368 Alverado Way Decatur, GA | 2.0 | 1.0 | 1088 | $1,523 | $1.40 | 45d | 1 | 0.72mi |
| 1953 Laurel Ln Decatur, GA | 3.0 | 1.0 | 1202 | $945 | $0.79 | 22d | 1 | 0.73mi |
| 3405 Elgin Dr Decatur, GA | 3.0 | 2.0 | 1198 | $1,700 | $1.42 | 45d | 1 | 0.74mi |
| 3503 Misty Valley Rd Decatur, GA | 3.0 | 1.5 | 984 | $1,495 | $1.52 | 25d | 1 | 0.74mi |
| 2939 Belvedere Ln Decatur, GA | 3.0 | 1.5 | 1500 | $1,595 | $1.06 | 14d | 1 | 0.74mi |
| 2939 Belvedere Ln Decatur, GA | 3.0 | 1.5 | 1500 | $1,595 | $1.06 | 11d | 1 | 0.74mi |
| 1966 Glendale Dr Decatur, GA | 3.0 | 2.0 | 1211 | $800 | $0.66 | 0d | 1 | 0.79mi |
| 2873 White Oak Dr Decatur, GA | 2.0 | 1.5 | 816 | $1,800 | $2.21 | 45d | 1 | 0.79mi |
| 1972 Glendale Dr Decatur, GA | 3.0 | 2.0 | 1211 | $1,790 | $1.48 | 45d | 1 | 0.80mi |
| 1978 Glendale Dr Decatur, GA | 3.0 | 2.0 | 1425 | $1,000 | $0.70 | 25d | 1 | 0.82mi |
| 1978 Glendale Dr Decatur, GA | 3.0 | 2.0 | 1211 | $1,490 | $1.23 | 14d | 1 | 0.82mi |
| 1978 Glendale Dr Decatur, GA | 3.0 | 2.0 | 1211 | $1,100 | $0.91 | 5d | 1 | 0.82mi |
| 1978 Glendale Dr Decatur, GA | 3.0 | 2.0 | 1211 | $1,200 | $0.99 | 19d | 1 | 0.82mi |
| 3229 McAfee Rd Decatur, GA | 3.0 | 1.0 | 1300 | $1,600 | $1.23 | 45d | 1 | 0.88mi |
| 2015 Oak Park Ln Decatur, GA | 3.0 | 2.5 | 871 | $1,400 | $1.61 | 25d | 1 | 0.93mi |
| 3529 Robins Landing Way Decatur, GA | 1.0–4.0 | 1.0–2.0 | 1042 | $1,443 | $1.38 | 0d | 36 | 0.94mi |
| 3529 Robins Landing Way Decatur, GA | 1.0–3.0 | 1.0–2.0 | 982 | $1,677 | $1.71 | 45d | 26 | 0.94mi |
| 3235 Beech Dr Decatur, GA | 3.0 | 2.0 | 1264 | $2,400 | $1.90 | 45d | 1 | 0.95mi |
Listing history 32 events
-
2026-06-21days on market $136,000 Active 96 DOM
-
2026-06-18days on market $136,000 Active 93 DOM
-
2026-06-17days on market $136,000 Active 92 DOM
-
2026-06-16days on market $136,000 Active 91 DOM
-
2026-06-15days on market $136,000 Active 90 DOM
-
2026-06-13days on market $136,000 Active 88 DOM
-
2026-06-10status $136,000 Active 84 DOM
-
2026-06-07status $136,000 Pending 84 DOM
-
2026-06-04days on market $136,000 Active 84 DOM
-
2026-06-03days on market $136,000 Active 83 DOM
-
2026-06-02days on market $136,000 Active 82 DOM
-
2026-06-01days on market $136,000 Active 81 DOM
-
2026-05-31days on market $136,000 Active 80 DOM
-
2026-04-10price $139,000 475-char remark
Show marketing remark (475 chars)
Excellent investment opportunity with strong rental potential. This 3-bedroom, 2-bath property offers a functional layout, updated kitchen, and low-maintenance features ideal for long-term tenants. Located in a high-demand rental area near shopping, schools, and major commuter routes. Spacious backyard and solid structure provide additional value-add potential. Great option for buy-and-hold investors, portfolio expansion, or first-time investors seeking steady cash flow.
-
2026-03-12$140,000 New 475-char remark
Show marketing remark (475 chars)
Excellent investment opportunity with strong rental potential. This 3-bedroom, 2-bath property offers a functional layout, updated kitchen, and low-maintenance features ideal for long-term tenants. Located in a high-demand rental area near shopping, schools, and major commuter routes. Spacious backyard and solid structure provide additional value-add potential. Great option for buy-and-hold investors, portfolio expansion, or first-time investors seeking steady cash flow.
-
2026-03-12$140,000 Active 475-char remark
Show marketing remark (475 chars)
Excellent investment opportunity with strong rental potential. This 3-bedroom, 2-bath property offers a functional layout, updated kitchen, and low-maintenance features ideal for long-term tenants. Located in a high-demand rental area near shopping, schools, and major commuter routes. Spacious backyard and solid structure provide additional value-add potential. Great option for buy-and-hold investors, portfolio expansion, or first-time investors seeking steady cash flow.
-
2025-10-24historical $1,665
-
2025-10-19price $1,665
-
2025-10-18$1,755
-
2021-06-16soldstatus $19,567,768
-
2012-12-25historical
-
2012-08-22$25,000 New
-
2009-01-20soldstatus $85,000
-
2008-04-14soldstatus $32,000
-
2008-02-08$34,500
-
2006-10-05soldstatus $96,600
-
2004-08-16soldstatus $134,000
-
2004-04-28soldstatus $97,000
-
2001-03-05soldstatus $73,000
-
2001-03-05soldstatus $73,000
-
1987-03-19soldstatus $49,000
ⓘ Source: listings_history table (triggers on properties + properties_extension) + one-shot
backfill from property_details.listing_events for pre-trigger history.
Tax reassessment forecast GA · Resets to sale price
- Current annual tax
- $3,418 · $285/mo
- Projected year-2 tax
- $3,418 · $285/mo
- Expected delta
- $0/yr ($0/mo · 0.0%)
ⓘ Screening estimate from a state-policy table — verify with the county assessor before closing.
Climate risk First Street
- Flood 1/10 Low FEMA zone X (unshaded) · 0% chance over 30 yrs
- Wildfire 1/10 Low
- Heat 5/10 Major 7 d/yr ≥104°F today · 16 d/yr by 30 yrs out
- Wind 5/10 Major 25% chance of damaging wind over 30 yrs
- Air quality 5/10 Major 6 unhealthy d/yr today · 8 by 30 yrs out
Nearby sold comps map
Loading sold comps map…
Walkable amenities ~0.75 mi
Loading nearby amenities…
Taxation est. · year 1
- Rental income
- $20,352
- − Mortgage interest
- −$7,618
- − Property taxes
- −$3,418
- − Insurance
- −$680
- − Repairs & maintenance
- −$1,628
- − Management
- −$1,628
- − Depreciation
- −$3,956
- Taxable income
- $1,423
- Est. tax owed @ 24.0%
- −$342
- After-tax cash flow
- $3,080/yr
For passive investors: Depreciation is non-cash, so a rental often shows a tax loss while cash-flowing — sheltering income. Rental losses are passive: they offset passive income freely, and up to $25,000/yr can offset ordinary (W-2) income if you actively participate and your MAGI is under $100k (phasing out to $0 by $150k); unused losses carry forward. On sale, claimed depreciation is recaptured at up to 25%, and gains may owe capital-gains tax (a 1031 exchange can defer both). Figures are a year-1 estimate at your 24.0% rate — not tax advice; consult a CPA.
Schools (NCES district)
- District
- Dekalb County
- NCES district ID
- 1301740
- Math proficiency
- 19% ▼ -12.00%
- Reading proficiency
- 28% ▼ -7.00%
- Median HH income
- $51,448
- Composite
- 20.92/100
- National rank
- #8482
- State rank
- #125 of 174 in GA
Livability — Belvedere Park
- Score
- 68/100
- State rank
- #153
- US rank
- #9886
Category grades
Schools grade is shown separately in the Schools card above.
Census & demographics
- Census place
- Belvedere Park, GA
- County
- Dekalb County · 782,738 people
- City population
- 42,812
- Metro
- Atlanta-Sandy Springs-Alpharetta, GA
- Population (ZIP)
- 42,948
- Household income
- $62,765
- Rent vs Own
- Severe rent burden
- 2097.0
Population outlook (DeKalb County) Hauer SSP2
- Today (2025)
- 839,977 people
- By 2030
- 891,768 · +6.2%
- By 2040
- 988,894 · +17.7%
- By 2050
- 1,074,583 · +27.9%
- By 2075
- 1,245,026 · +48.2%
- By 2100
- 1,303,135 · +55.1%
Race, ethnicity, and origin ACS 2023
- Neighborhood character
- Predominantly Black (70%)
- Race & ethnicity
- Black 70% White 18% Two or more races 6% Hispanic / Latino 5% Asian 2%
- Hispanic origin (detail)
- Mexican 2%
- Common ancestry
- Slovak 1% Italian 1% Serbian 1%
- Foreign-born
- 7% · Canada, China, Guatemala
- Languages at home
- 91% English-only · Spanish 4% Arabic 1% Other Indo-European 0%
Political lean MEDSL · DeKalb
- 2024 margin
- Solid D (+64.8) · D 81.9% · R 17.1% · Other 1.0%
- 2008→2024 swing
- +6.1pp toward D · 2008: 58.6pp · 2024: 64.8pp
- All cycles
- 2024: D+64.8 2020: D+67.4 2016: D+64.8 2012: D+56.8 2008: D+58.6
Not yet ingested
- Civics
- —
Market trends
- HPI YoY
- ▼ -203.83%
- Current HPI
- 221.0467
- Rent YoY
- ▲ 1.34%
- Metro
- Atlanta-Sandy Springs-Alpharetta, GA
- State GDP YoY
- ▲ 2.66%
- F500 in state
- 28
Industry mix (Fortune 500 HQ in GA)
| Industry | F500 HQs | Revenue |
|---|---|---|
| Paper / Packaging | 2 | $29B |
|
||
| Retail | 1 | $160B |
|
||
| Transportation / Logistics | 1 | $91B |
|
||
| Airlines | 1 | $62B |
|
||
| Consumer Goods | 1 | $47B |
|
||
| Utilities | 1 | $25B |
|
||
Price history
+183.7% since first listed19 events — show timeline
- 2026-04-10 Price Changed $139,000 FMLS
- 2026-04-10 Price Changed $139,000 GAMLS
- 2026-03-12 Listed $140,000 FMLS
- 2026-03-12 Listed $140,000 GAMLS
- 2025-10-24 Rental Removed $1,665 RENTLY
- 2025-10-19 Price Changed $1,665 RENTLY
- 2025-10-18 Listed for Rent $1,755 RENTLY
- 2021-06-16 Sold (Public Records) $19,567,768 Public Records
- 2012-12-25 Listing Removed — GAMLS
- 2012-08-22 Listed $25,000 GAMLS
- 2009-01-20 Sold (Public Records) $85,000 Public Records
- 2008-04-14 Sold (MLS) $32,000 FMLS
- 2008-02-08 Listed $34,500 FMLS
- 2006-10-05 Sold (Public Records) $96,600 Public Records
- 2004-08-16 Sold (Public Records) $134,000 Public Records
- 2004-04-28 Sold (Public Records) $97,000 Public Records
- 2001-03-05 Sold (Public Records) $73,000 Public Records
- 2001-03-05 Sold (Public Records) $73,000 Public Records
- 1987-03-19 Sold (Public Records) $49,000 Public Records
Property tax history
+3.3%/yrLatest (2025): $3,418 · +0.2% YoY. Source: county tax records.
Cash-flow waterfall
monthlySold comps — $/sqft
last 12 mo · ≤1 miLoading sold comps…