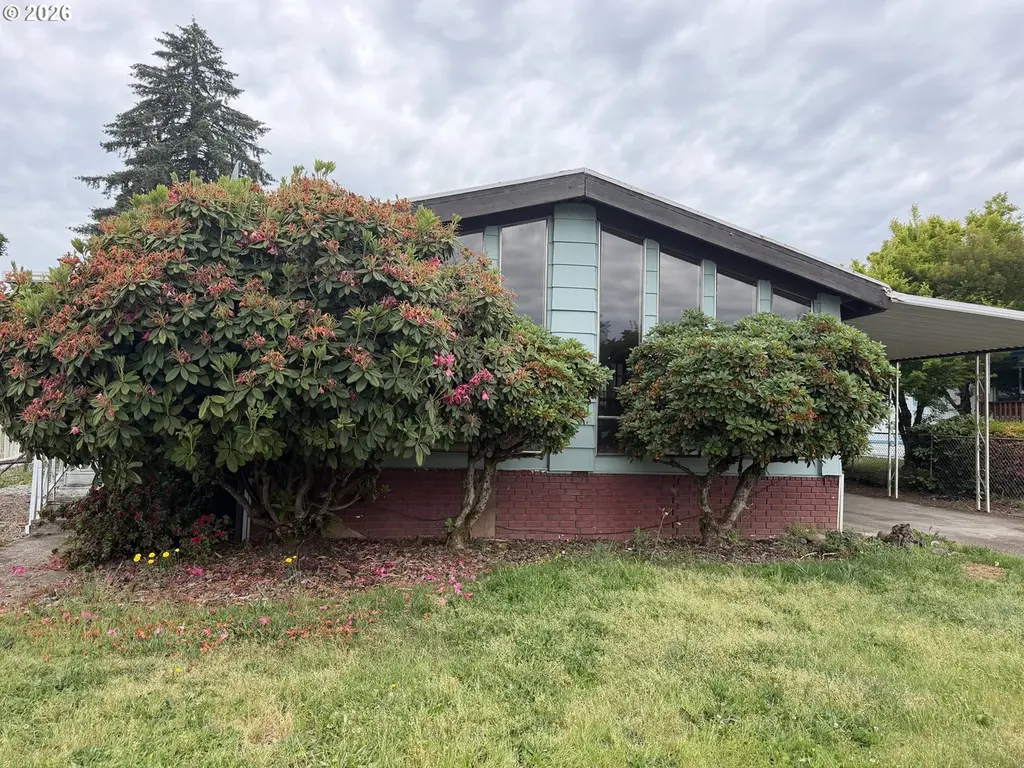
311 Creswood Dr · Creswell, OR
Flood risk 1/10 · Minimal
- FEMA flood zone
- X (unshaded)
- Chance of flooding over 30 yrs
- 0.0%
- Est. flood insurance / yr
- $507 – $1,088
Fire risk 4/10 · Minor
- Est. fire insurance / yr
- $498 – $926
Heat risk 4/10 · Minor
- Hot days now (above 92°F)
- 7 days/yr
- Hot days in 30 yrs
- 15 days/yr
Wind risk 1/10 · Minimal
- Chance of severe wind over 30 yrs
- —
Air-quality risk 10/10 · Severe
- Unhealthy air days now
- 14 days/yr
- Unhealthy air days in 30 yrs
- 15 days/yr
Risk factors via First Street. Map © Google.
Why this score? — see what drove the C+ grade
The composite is a weighted blend of 9 inputs, each scored 0–100. Each bar is that input's sub-score; the figure is the points it added to the 100-point composite (weight × sub-score).
- Cash flow +26.9/30.0
- DSCR +9.3/10.0
- 1% rule +6.6/10.0
- ARV discount +6.5/15.0
- Schools +4.0/10.0
- Livability +3.8/5.0
- Rent growth +2.5/5.0
- Condition / age +2.5/5.0
- Appreciation +0.0/10.0
$209,000
🖨 Deal sheet 📄 Offer letter ✓ Due diligence
Listing remarks
Opportunity awaits with this mobile home ready for updates and improvements. Being sold as-is, offering potential for investors, renovation projects, or buyers seeking an affordable property with upside. Excellent location close to city park, schools and shopping center.
Key facts
- Shopping center
- City park
- Schools
Tags
Property features AI
Finance
- Other: Property listed as residential resale; Main level area approximately 1,536; Lot about 0.13 acres (5,000–6,999 sq ft)
- HOA & community: Not a senior community
Exterior
- Parking: Carport
- Utilities: Public water; Public sewer; Electric service
- Home design: Manufactured home on real property; Single-story (main level living)
- Construction: Built in 1978; Pillar/post/pier foundation
- Exterior features: Lap siding; Level lot
Interior
- Kitchen: Kitchen
- Bedrooms: Primary bedroom on main level; Second bedroom on main level
- Bathrooms: Two full bathrooms (both on main level)
- Heating & cooling: Heat pump for heating and cooling
- Interior features: Wood-burning stove fireplace (1)
- Laundry & utility: Electric hot water
Neighborhood map
What this means for you Summary
Snapshot
- This is a 2-bed/2.0-bath manufactured listed at $209k.
Deal economics
- At list price, monthly cash flow is $580 ($7k/yr) — positive.
- The deal already cash-flows at list — no discount required.
- Meets the 1% rule at list price ($2k rent vs $209k).
- Cap rate 9.6% vs local median 2.7% in Creswell — top-decile yield for the area; either an underpriced asset or a hidden risk that comps aren't pricing in. Stress-test before assuming the spread holds.
Location & tenants
- Location reads 76/100 on livability (#80 in OR, #3,631 nationally) — a middle-class / working-renter tenant base. Strengths: employment A+, housing A+, health & safety A+; Watch: amenities D+, commute F.
- Creswell SD 40 (town): math 37% / reading 51% proficiency, ranked #78 of 183 in OR (top 43%) — families likely to look elsewhere, expect single-tenant / working-renter base with shorter leases.
- Zoned schools: Creslane Elementary School (math 15% / reading 34%, grade F, #309 of 412 statewide, top 77%, 509 students, 68% FRL); Creswell Middle School (math 22% / reading 47%, grade F, #61 of 128 statewide, top 54%, 265 students, 43% FRL); Creswell High School (360 students, 37% FRL) — zoned schools at 49% FRL track the district average.
- Zoned-school proficiency averages 30% at this address vs 44% district-wide (-14 pts) — the specific schools serving this property underperform the Creswell SD 40 average; the district grade overstates school quality for this exact location.
- Market conditions: 65 active listings in the ZIP; 2 comparable units currently listed for rent nearby; 1,808 units permitted in Lane County in 2024 (972 in 5+ unit buildings).
Forward outlook
- Local home prices are declining (-3.0%/yr); year-one equity from $1k of loan paydown is wiped out by about $6k of value loss. Plan a longer hold.
- Lane County population projected at +15% by 2050 — long-run rental-demand tailwind backs the buy-and-hold thesis.
- At projected returns (-3.0% appreciation + 3.0% rent growth), your $59k cash investment doubles in ~10 years — after that, you're playing with house money.
Negotiation context
- Only 1 days on market — expect competitive offers; lowballing is unlikely to land.
- Current owner paid $110k; list at $209k implies a 90% gain — meaningful room to come down on a strong offer.
Questions for the listing agent
- Built in 1978 — when were the roof, HVAC, electrical panel, plumbing, and water heater last replaced?
- Is there a deadline driving the sale (1031 exchange, divorce, estate, relocation)? That informs how much negotiation room exists.
- What's the average days-on-market for RENTAL listings here right now (not sales)? A rising rental-DOM trend means longer vacancies and softer asking-rent achievability than the comps imply.
- What's the recent tenant-quality profile in this submarket — average credit score on applications, eviction rate, late-payment / NSF rate, and stable-employment percentage? A property-management company in the area should have these aggregated.
- How much new for-sale + rental construction is in the pipeline within 1–3 miles? Heavy new supply typically softens prices + rents 12–24 months out; constrained supply supports both.
Investment metrics
- 1% rule
- 1.16% ✓
- Cap rate
- 9.62%
- Cash-on-cash
- 11.90%
- DSCR
- 1.53
- GRM
- 7.2
CMA / ARV
- ARV (on-the-fly)
- $204,288
- Comps found
- 7
Show comp detail 7 sales within ~0.75 mi
| Address | Dist | Beds/Ba | Sqft | Sold | Price | $/sf | Match |
|---|---|---|---|---|---|---|---|
| 311 Creswood Dr | 0.00mi | 2/2.0 | 1,536 (0%) | 0mo | $205,000 | $133 | 100 |
| 33497 Scott Ave | 0.17mi | 3/2.0 (+1) | 1,539 (+0%) | 18mo | $395,000 | $257 | 72 |
| 331 Creswood Dr | 0.01mi | 3/2.0 (+1) | 1,620 (+6%) | 20mo | $245,000 | $151 | 69 |
| 300 S 7th St | 0.46mi | 3/2.0 (+1) | 1,404 (-9%) | 1mo | $335,000 | $239 | 59 |
| 700 N Mill St #8 | 0.46mi | 3/2.0 (+1) | 1,620 (+6%) | 14mo | $115,000 | $71 | 53 |
| 700 N Mill St #40 | 0.46mi | 3/2.0 (+1) | 1,512 (-2%) | 24mo | $145,000 | $96 | 51 |
| 700 N Mill St #66 | 0.46mi | 3/2.0 (+1) | 1,650 (+7%) | 19mo | $139,900 | $85 | 46 |
Match score weights: distance 35% · size 25% · config 20% · recency 20%. Top-matched comps best support the ARV.
Projected returns pro-forma
-3.0% appreciation · 3.0% rent growth · sell at horizon
- IRR
- 1.4%
- Equity multiple
- 1.05×
- Total profit
- $3,050
- Equity at exit
- $31,163
- IRR
- 11.0%
- Equity multiple
- 1.86×
- Total profit
- $50,108
- Equity at exit
- $18,071
Cash invested: $58,520 (down + closing). Projections, not guarantees.
Landlord ↔ Tenant lean methodology
- Overall (STATE)
- 28 Tenant-Leaning
- State Oregon
- 28 Tenant-Leaning · D+6
- County
- — inherits STATE
- City
- — inherits STATE
ZIP-level market 97426
- Home prices YoY
- -29.1%
- Active inventory
- 65
- Price-to-rent
- 7.2×
Monthly cashflow live
- Estimated rent
- $2,424 medium interval (Pro) →
- Mortgage (P&I)
- −$1,096
- Tax from tax record
- −$152 /mo · $1,823/yr
- Insurance
- −$87
- HOA
- −$0
- Vacancy / Maint / Mgmt
- −$509
- Net cashflow
- $580
Break-even live
UW: 25.0% down · 7.5% · 30yr · 1.5% tax · 5.0% vac · 8.0% maint · 8.0% mgmt
Financing live
Cash to close
- Down payment
- $52,250
- Closing costs
- $6,270
- Reserves months
- —
- Total cash needed
- —
Loan-product check · same deal, 3 products live
Conventional
25% down · 7.5% · 30yr
- Down + closing
- —
- Monthly P&I
- —
- Monthly cashflow
- —
- DSCR
- —
- Eligible?
- —
Personal DTI + credit; lowest rate.
DSCR
20% down · 8.5% · 30yr
- Down + closing
- —
- Monthly P&I
- —
- Monthly cashflow
- —
- DSCR
- —
- Eligible?
- —
No personal income docs; deal must DSCR.
Hard money
10% down · 12.0% · 12mo
- Down + closing
- —
- Monthly P&I
- —
- Monthly cashflow
- —
- DSCR
- —
- Eligible?
- —
Short-term bridge; refi at stabilization.
Rent comps 2 comps
| Address | Beds | Baths | Sqft | Rent | $/sqft | DOM | Units | Dist |
|---|---|---|---|---|---|---|---|---|
| 101 D St Creswell, OR | 3.0 | 1.0 | 1278 | $2,095 | $1.64 | 14d | 1 | 0.37mi |
| 1241 Masters Ave Creswell, OR | 3.0 | 2.5 | 2105 | $3,350 | $1.59 | 14d | 1 | 0.91mi |
Listing history 3 events
-
2026-06-03status $209,000 Pending 1 DOM
-
2026-06-01remarks 271-char remark
-
2026-06-01$209,000 Active 1 DOM
ⓘ Source: listings_history table (triggers on properties + properties_extension) + one-shot
backfill from property_details.listing_events for pre-trigger history.
Tax reassessment forecast OR · Resets to sale price
- Current annual tax
- $1,823 · $152/mo
- Projected year-2 tax
- $2,027 · $169/mo
- Expected delta
- +$204/yr (+$17/mo · 11.2%)
ⓘ Screening estimate from a state-policy table — verify with the county assessor before closing.
Climate risk First Street
- Flood 1/10 Low FEMA zone X (unshaded) · 0% chance over 30 yrs
- Wildfire 4/10 Moderate
- Heat 4/10 Moderate 7 d/yr ≥92°F today · 15 d/yr by 30 yrs out
- Wind 1/10 Low
- Air quality 10/10 Extreme 14 unhealthy d/yr today · 15 by 30 yrs out
Nearby sold comps map
Loading sold comps map…
Walkable amenities ~0.75 mi
Loading nearby amenities…
Taxation est. · year 1
- Rental income
- $29,091
- − Mortgage interest
- −$11,707
- − Property taxes
- −$1,823
- − Insurance
- −$1,045
- − Repairs & maintenance
- −$2,327
- − Management
- −$2,327
- − Depreciation
- −$6,080
- Taxable income
- $3,781
- Est. tax owed @ 24.0%
- −$907
- After-tax cash flow
- $6,054/yr
For passive investors: Depreciation is non-cash, so a rental often shows a tax loss while cash-flowing — sheltering income. Rental losses are passive: they offset passive income freely, and up to $25,000/yr can offset ordinary (W-2) income if you actively participate and your MAGI is under $100k (phasing out to $0 by $150k); unused losses carry forward. On sale, claimed depreciation is recaptured at up to 25%, and gains may owe capital-gains tax (a 1031 exchange can defer both). Figures are a year-1 estimate at your 24.0% rate — not tax advice; consult a CPA.
Schools (NCES district)
- District
- Creswell SD 40
- NCES district ID
- 4103690
- Math proficiency
- 37% ▼ -6.00%
- Reading proficiency
- 51% ▼ -5.00%
- Median HH income
- $53,499
- Composite
- 40.38/100
- National rank
- #7748
- State rank
- #78 of 183 in OR
Livability — Creswell
- Score
- 76/100
- State rank
- #80
- US rank
- #3631
Category grades
Schools grade is shown separately in the Schools card above.
Census & demographics
- Census place
- Creswell, OR
- Population (ZIP)
- 10,384
Population outlook (Lane County) Hauer SSP2
- Today (2025)
- 391,933 people
- By 2030
- 405,860 · +3.6%
- By 2040
- 429,386 · +9.6%
- By 2050
- 452,016 · +15.3%
- By 2075
- 508,825 · +29.8%
- By 2100
- 531,208 · +35.5%
Race, ethnicity, and origin ACS 2023
- Neighborhood character
- Predominantly White (88%)
- Race & ethnicity
- White 88% Two or more races 8% Hispanic / Latino 3% Asian 1% Native American 1%
- Common ancestry
- Italian 6% Portuguese 3% Lithuanian 3%
- Foreign-born
- 1% · Canada
- Languages at home
- 97% English-only · Spanish 2%
Political lean MEDSL · Lane
- 2024 margin
- Strong D (+23.1) · D 60.0% · R 36.9% · Other 3.1%
- 2008→2024 swing
- -4.3pp toward R · 2008: 27.4pp · 2024: 23.1pp
- All cycles
- 2024: D+23.1 2020: D+24.3 2016: D+18.9 2012: D+23.4 2008: D+27.4
Not yet ingested
- Civics
- —
Market trends
- HPI YoY
- ▼ -127.51%
- Current HPI
- 311.4445
- Rent YoY
- —
- Metro
- —
- State GDP YoY
- ▲ 2.05%
- F500 in state
- 2
Industry mix (Fortune 500 HQ in OR)
| Industry | F500 HQs | Revenue |
|---|---|---|
| Consumer Goods | 1 | $51B |
|
||
Price history
+176.8% since first listed4 events — show timeline
- 2026-06-01 Listed $209,000 RMLS
- 2006-10-12 Sold (Public Records) $110,000 Public Records
- 2004-07-15 Sold (Public Records) $92,000 Public Records
- 1996-09-04 Sold (Public Records) $75,500 Public Records
Property tax history
+3.5%/yrLatest (2025): $1,823 · +33.7% YoY. Source: county tax records.
Cash-flow waterfall
monthlySold comps — $/sqft
last 12 mo · ≤1 miLoading sold comps…