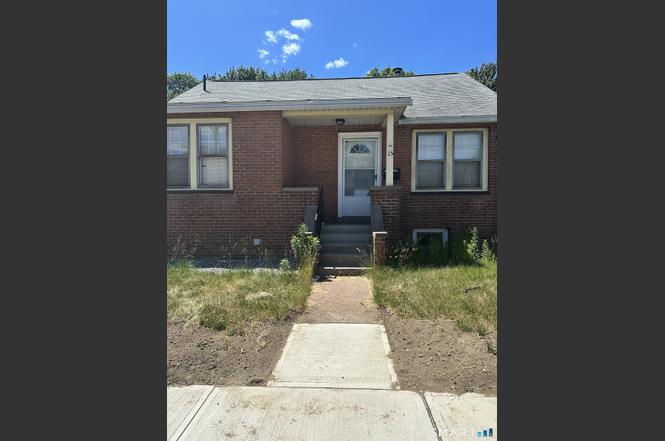
15 Summer St · Thompsonville, CT
Flood risk 1/10 · Minimal
- FEMA flood zone
- X (unshaded)
- Chance of flooding over 30 yrs
- 0.0%
- Est. flood insurance / yr
- $473 – $860
Fire risk 1/10 · Minimal
- Est. fire insurance / yr
- $829 – $1,539
Heat risk 4/10 · Minor
- Hot days now (above 98°F)
- 7 days/yr
- Hot days in 30 yrs
- 15 days/yr
Wind risk 6/10 · Moderate
- Chance of severe wind over 30 yrs
- 27.0%
Air-quality risk 3/10 · Minor
- Unhealthy air days now
- 2 days/yr
- Unhealthy air days in 30 yrs
- 3 days/yr
Risk factors via First Street. Map © Google.
Why this score? — see what drove the B- grade
The composite is a weighted blend of 9 inputs, each scored 0–100. Each bar is that input's sub-score; the figure is the points it added to the 100-point composite (weight × sub-score).
- Cash flow +23.3/30.0
- ARV discount +15.0/15.0
- 1% rule +7.5/10.0
- DSCR +7.5/10.0
- Rent growth +3.5/5.0
- Livability +3.5/5.0
- Schools +3.0/10.0
- Condition / age +2.5/5.0
- Appreciation +0.0/10.0
$200,000
🖨 Deal sheet (PDF) 📄 Offer letter ✓ Due diligence
Listing remarks MLS
Welcome home to 15 Summer Street in Enfield. This immaculate and spacious brick Cape features 1,600 sq feet and has been maintained by current owners and kept in mint condition. The home boasts 4 bedrooms, 1 bath, a large eat-in kitchen and family room. Enjoy the finished basement that comes with an additional kitchen and billiard/game area. This property is conveniently close to restaurants, shopping, major highways and about 90 minutes from Boston. Come schedule YOUR private showing today. This home WILL NOT last!
Key facts
- 5,227 sq ft lot
- Built 1944
- Listed 4 days
Property features AI
Exterior
- Utilities: Public water in street; Public sewer in street
- Home design: Single family home
- Construction: Brick construction; Concrete foundation; Shingle gable roof
- Exterior features: Level lot; Brick exterior
Interior
- Kitchen: Electric range; Microwave; Refrigerator; Dishwasher
- Bedrooms: Four bedrooms
- Bathrooms: One full bath
- Heating & cooling: Steam heat (oil-fired); Window AC unit; 40-gallon hot water tank in basement; Oil tank located in basement
- Interior features: Full basement; Attic with hatch access; Seven total rooms
Neighborhood map
What this means for you Summary
Snapshot
- This is a 4-bed/1.0-bath single-family listed at $200k.
Deal economics
- At list price, monthly cash flow is $366 ($4k/yr) — positive.
- The deal already cash-flows at list — no discount required.
- Meets the 1% rule at list price ($2k rent vs $200k).
- Cap rate 8.5% vs local median 5.2% in Thompsonville — top-decile yield for the area; either an underpriced asset or a hidden risk that comps aren't pricing in. Stress-test before assuming the spread holds.
Location & tenants
- Location reads 69/100 on livability (#103 in CT) — a middle-class / working-renter tenant base. Strengths: health & safety A+, housing A, crime B+; Watch: amenities F, commute F, employment D-.
- Enfield School District (suburban): math 25% / reading 41% proficiency, ranked #114 of 153 in CT (top 74%) — families likely to look elsewhere, expect single-tenant / working-renter base with shorter leases.
- Zoned schools: Hazardville Memorial School (329 students, 44% FRL); John F. Kennedy Middle School (math 22% / reading 39%, grade F, #138 of 175 statewide, top 79%, 1,096 students, 46% FRL); Enfield High School (math 29% / reading 54%, grade F, #102 of 194 statewide, top 53%, 1,490 students, 40% FRL).
- Market conditions: Rents rising (+3.9%/yr); 189 active listings in the ZIP; 9 comparable units currently listed for rent nearby; rentals lingering (median 47d on market — plan ~5-8 weeks vacancy on turnover, expect pricing pressure); 67% of comp listings sitting > 30 days — soft ceiling on asking rent; solid renter incomes; 1,867 units permitted in Capitol Planning Region in 2024 (1,399 in 5+ unit buildings).
- This rent runs 33% of the median local income ($90k/yr) — at the standard rent-burdened threshold; future hikes will face affordability resistance.
Forward outlook
- Local home prices are declining (-3.0%/yr); year-one equity from $1k of loan paydown is wiped out by about $6k of value loss. Plan a longer hold.
Negotiation context
- Only 5 days on market — expect competitive offers; lowballing is unlikely to land.
- 5 sale attempts since 8y ago with the ask held roughly flat each time — persistent listings suggest the price (not the market) is what's stuck; bring a comps-based counter.
Risks & watch-outs
- Watch-outs: property tax is 2.8% of price; built in 1944 — expect roof / HVAC / electrical / plumbing capex.
- Climate carrying-cost: major wind risk, 27% chance of damaging wind over 30y — expect insurance premiums to compound above CPI over the hold.
Questions for the listing agent
- Built in 1944 — when were the roof, HVAC, electrical panel, plumbing, and water heater last replaced?
- Property tax is high relative to price — has the assessment been appealed recently, and will the sale trigger a re-assessment?
- Is there a deadline driving the sale (1031 exchange, divorce, estate, relocation)? That informs how much negotiation room exists.
- What's the average days-on-market for RENTAL listings here right now (not sales)? A rising rental-DOM trend means longer vacancies and softer asking-rent achievability than the comps imply.
- What's the recent tenant-quality profile in this submarket — average credit score on applications, eviction rate, late-payment / NSF rate, and stable-employment percentage? A property-management company in the area should have these aggregated.
- How much new for-sale + rental construction is in the pipeline within 1–3 miles? Heavy new supply typically softens prices + rents 12–24 months out; constrained supply supports both.
Investment metrics
- 1% rule
- 1.25% ✓
- Cap rate
- 8.49%
- Cash-on-cash
- 7.85%
- DSCR
- 1.35
- GRM
- 6.7
CMA / ARV
- ARV (on-the-fly)
- $306,432
- Comps found
- 12
Show comp detail 12 sales within ~0.75 mi
| Address | Dist | Beds/Ba | Sqft | Sold | Price | $/sf | Match |
|---|---|---|---|---|---|---|---|
| 3 Warriner Ave | 0.21mi | 3/1.5 (-1) | 1,581 (-1%) | 0mo | $300,650 | $190 | 81 |
| 73 Laurel St | 0.42mi | 4/2.0 | 1,584 (-1%) | 2mo | $360,000 | $227 | 73 |
| 42 Parker St | 0.37mi | 3/1.0 (-1) | 1,640 (+3%) | 3mo | $325,000 | $198 | 71 |
| 53 New King St | 0.47mi | 4/2.0 | 1,612 (+1%) | 6mo | $309,900 | $192 | 68 |
| 20 Harris St | 0.33mi | 3/1.0 (-1) | 1,694 (+6%) | 10mo | $300,000 | $177 | 61 |
| 3 Mountain View Ave | 0.39mi | 3/1.5 (-1) | 1,520 (-5%) | 10mo | $320,000 | $211 | 58 |
| 39 Union ST EXT | 0.69mi | 4/2.0 | 1,653 (+4%) | 2mo | $349,900 | $212 | 56 |
| 12 Riviera Dr | 0.50mi | 3/2.0 (-1) | 1,682 (+5%) | 4mo | $295,000 | $175 | 56 |
| 20 John St | 0.41mi | 3/2.0 (-1) | 1,378 (-14%) | 5mo | $316,500 | $230 | 45 |
| 17 Windsor St | 0.61mi | 5/1.0 (+1) | 1,772 (+11%) | 4mo | $270,000 | $152 | 44 |
| 30 Franklin St | 0.67mi | 4/2.0 | 1,446 (-9%) | 7mo | $225,000 | $156 | 43 |
| 46 Windsor St | 0.64mi | 3/1.5 (-1) | 1,802 (+13%) | 6mo | $325,000 | $180 | 37 |
Match score weights: distance 35% · size 25% · config 20% · recency 20%. Top-matched comps best support the ARV.
Projected returns pro-forma
-3.0% appreciation · 3.9% rent growth · sell at horizon
- IRR
- -3.1%
- Equity multiple
- 0.88×
- Total profit
- $-6,623
- Equity at exit
- $29,821
- IRR
- 7.8%
- Equity multiple
- 1.62×
- Total profit
- $34,492
- Equity at exit
- $17,292
Cash invested: $56,000 (down + closing). Projections, not guarantees.
Landlord ↔ Tenant lean methodology
- Overall (STATE)
- 27 Tenant-Leaning
- State Connecticut
- 27 Tenant-Leaning · D+7
- County
- — inherits STATE
- City
- — inherits STATE
ZIP-level market 06082
- Rents YoY
- 3.9%
- Active inventory
- 189
- Price-to-rent
- 6.7×
Monthly cashflow live
- Estimated rent
- $2,490 high interval (Pro) →
- Mortgage (P&I)
- −$1,049
- Tax from tax record
- −$469 /mo · $5,625/yr
- Insurance
- −$83
- HOA
- −$0
- Lot rent
- −$0
- Vacancy / Maint / Mgmt
- −$523
- Net cashflow
- $366
Break-even live
Sensitivity live
| Price | -10% $480 | -5% $423 | +0% $366 | +5% $310 | +10% $253 |
|---|---|---|---|---|---|
| Rent | -10% $170 | -5% $268 | +0% $366 | +5% $465 | +10% $563 |
| Rate | -1.0pp $467 | -0.5pp $417 | base $366 | +0.5pp $315 | +1.0pp $262 |
UW: 25.0% down · 7.5% · 30yr · 1.5% tax · 5.0% vac · 8.0% maint · 8.0% mgmt
Financing live
Cash to close
- Down payment
- $50,000
- Closing costs
- $6,000
- Reserves months
- —
- Total cash needed
- —
Loan-product check · same deal, 3 products live
Conventional
25% down · 7.5% · 30yr
- Down + closing
- —
- Monthly P&I
- —
- Monthly cashflow
- —
- DSCR
- —
- Eligible?
- —
Personal DTI + credit; lowest rate.
DSCR
20% down · 8.5% · 30yr
- Down + closing
- —
- Monthly P&I
- —
- Monthly cashflow
- —
- DSCR
- —
- Eligible?
- —
No personal income docs; deal must DSCR.
Hard money
10% down · 12.0% · 12mo
- Down + closing
- —
- Monthly P&I
- —
- Monthly cashflow
- —
- DSCR
- —
- Eligible?
- —
Short-term bridge; refi at stabilization.
Rent comps 9 comps
| Address | Beds | Baths | Sqft | Rent | $/sqft | DOM | Units | Dist |
|---|---|---|---|---|---|---|---|---|
| 22 Ohear Ave Enfield, CT | 3.0 | 2.0 | 1148 | $2,000 | $1.74 | 46d | 1 | 0.22mi |
| 692 Enfield St Enfield, CT | 3.0 | 2.0 | 1370 | $2,100 | $1.53 | 46d | 1 | 0.43mi |
| 42 Hartford Ave Enfield, CT | 4.0 | 1.0 | 1538 | $2,400 | $1.56 | 46d | 1 | 0.56mi |
| 44 Saint James Ave Enfield, CT | 3.0 | 2.0 | 1500 | $2,700 | $1.80 | 46d | 1 | 0.61mi |
| 49 Whitworth St Enfield, CT | 3.0 | 1.5 | 1191 | $2,000 | $1.68 | 0d | 1 | 0.66mi |
| 54 Prospect St Enfield, CT | 4.0 | 2.0 | 2016 | $3,200 | $1.59 | 0d | 1 | 0.67mi |
| 36B Maple Ave Enfield, CT | 3.0 | 1.5 | 1800 | $1,775 | $0.99 | 46d | 1 | 0.69mi |
| 37 Shad Row #37 Suffield, CT | 3.0 | 2.5 | 2000 | $2,700 | $1.35 | 0d | 1 | 1.24mi |
| 3 Pebblestone Cir #3 Suffield, CT | 3.0 | 2.5 | 1320 | $2,550 | $1.93 | 46d | 1 | 1.33mi |
Listing history 4 events
-
2026-06-22days on market $200,000 Active 5 DOM
-
2026-06-22days on market $200,000 Active 4 DOM
-
2026-06-18remarks 58-char remark
-
2026-06-18$200,000 Active 1 DOM
ⓘ Source: listings_history table (triggers on properties + properties_extension) + one-shot
backfill from property_details.listing_events for pre-trigger history.
Tax reassessment forecast CT · Partial reset (capped growth)
- Current annual tax
- $5,625 · $469/mo
- Projected year-2 tax
- $5,625 · $469/mo
- Expected delta
- $0/yr ($0/mo · 0.0%)
ⓘ Screening estimate from a state-policy table — verify with the county assessor before closing.
Climate risk First Street
- Flood 1/10 Low FEMA zone X (unshaded) · 0% chance over 30 yrs
- Wildfire 1/10 Low
- Heat 4/10 Moderate 7 d/yr ≥98°F today · 15 d/yr by 30 yrs out
- Wind 6/10 Major 27% chance of damaging wind over 30 yrs
- Air quality 3/10 Moderate 2 unhealthy d/yr today · 3 by 30 yrs out
Nearby sold comps map
Loading sold comps map…
Walkable amenities ~0.75 mi
Loading nearby amenities…
Taxation est. · year 1
- Rental income
- $29,884
- − Mortgage interest
- −$11,203
- − Property taxes
- −$5,625
- − Insurance
- −$1,000
- − Repairs & maintenance
- −$2,391
- − Management
- −$2,391
- − Depreciation
- −$5,818
- Taxable income
- $1,456
- Est. tax owed @ 24.0%
- −$349
- After-tax cash flow
- $4,048/yr
For passive investors: Depreciation is non-cash, so a rental often shows a tax loss while cash-flowing — sheltering income. Rental losses are passive: they offset passive income freely, and up to $25,000/yr can offset ordinary (W-2) income if you actively participate and your MAGI is under $100k (phasing out to $0 by $150k); unused losses carry forward. On sale, claimed depreciation is recaptured at up to 25%, and gains may owe capital-gains tax (a 1031 exchange can defer both). Figures are a year-1 estimate at your 24.0% rate — not tax advice; consult a CPA.
Schools (NCES district)
- District
- Enfield School District
- NCES district ID
- 0901470
- Math proficiency
- 25% ▼ -14.00%
- Reading proficiency
- 41% ▼ -10.00%
- Median HH income
- $68,750
- Composite
- 30.42/100
- National rank
- #6238
- State rank
- #114 of 153 in CT
Livability — Thompsonville
- Score
- 69/100
- State rank
- #103
- US rank
- #8941
Category grades
Schools grade is shown separately in the Schools card above.
Census & demographics
- Census place
- Thompsonville, CT
- County
- Hartford County · 754,208 people
- Metro
- Hartford-East Hartford-Middletown, CT
- Population (ZIP)
- 41,090
- Household income
- $90,404
- Rent vs Own
- Severe rent burden
- 954.0
Population outlook (Capitol County) Hauer SSP2
- By 2040
- 1,063,519
Race, ethnicity, and origin ACS 2023
- Neighborhood character
- Predominantly White (76%)
- Race & ethnicity
- White 76% Hispanic / Latino 11% Two or more races 9% Black 5% Asian 2%
- Hispanic origin (detail)
- Mexican 1% Puerto Rican 7%
- Common ancestry
- Romanian 10% Lithuanian 9% Slovak 2%
- Foreign-born
- 6% · Canada, Jamaica
- Languages at home
- 89% English-only · Spanish 5% Other Indo-European 2% Russian/Polish/Slavic 1%
Political lean MEDSL · Capitol
- 2024 margin
- Strong D (+21.9) · D 60.1% · R 38.2% · Other 1.7%
- All cycles
- 2024: D+21.9
Not yet ingested
- Civics
- —
Market trends
- HPI YoY
- ▼ -494.72%
- Current HPI
- 192.4011
- Rent YoY
- ▲ 3.90%
- Metro
- Hartford-East Hartford-Middletown, CT
- State GDP YoY
- ▲ 1.06%
- F500 in state
- 38
Industry mix (Fortune 500 HQ in CT)
| Industry | F500 HQs | Revenue |
|---|---|---|
| Industrial Machinery | 4 | $38B |
|
||
| Insurance | 3 | $71B |
|
||
| Financial Services | 2 | $25B |
|
||
| Transportation / Logistics | 2 | $18B |
|
||
| Healthcare | 1 | $247B |
|
||
| Telecommunications | 1 | $55B |
|
||
Price history
+66.8% since first listed21 events — show timeline
- 2026-06-15 Listed $200,000 Smart MLS
- 2026-04-15 Listing Removed — Smart MLS
- 2026-01-05 Pending — Smart MLS
- 2025-12-16 Price Changed $250,000 Smart MLS
- 2025-11-10 Price Changed $285,000 Smart MLS
- 2025-10-21 Price Changed $295,000 Smart MLS
- 2025-10-20 Price Changed $303,000 Smart MLS
- 2025-10-09 Listed $305,000 Smart MLS
- 2021-07-12 Sold (Public Records) $215,000 Public Records
- 2021-07-09 Listing Removed — Smart MLS
- 2021-07-09 Sold (MLS) $215,000 Smart MLS
- 2021-05-01 Contingent — Smart MLS
- 2021-04-27 Listed $209,900 Smart MLS
- 2019-03-29 Sold (Public Records) $110,000 Public Records
- 2019-03-29 Sold (MLS) $110,000 Smart MLS
- 2019-03-13 Listing Removed — Smart MLS
- 2019-02-27 Contingent — Smart MLS
- 2019-02-19 Listed $104,900 Smart MLS
- 2018-12-12 Listing Removed — Smart MLS
- 2018-10-31 Price Changed $109,900 Smart MLS
- 2018-10-10 Listed $119,900 Smart MLS
Property tax history
+2.9%/yrLatest (2025): $5,625 · +2.8% YoY. Source: county tax records.
Cash-flow waterfall
monthlySold comps — $/sqft
last 12 mo · ≤1 miLoading sold comps…