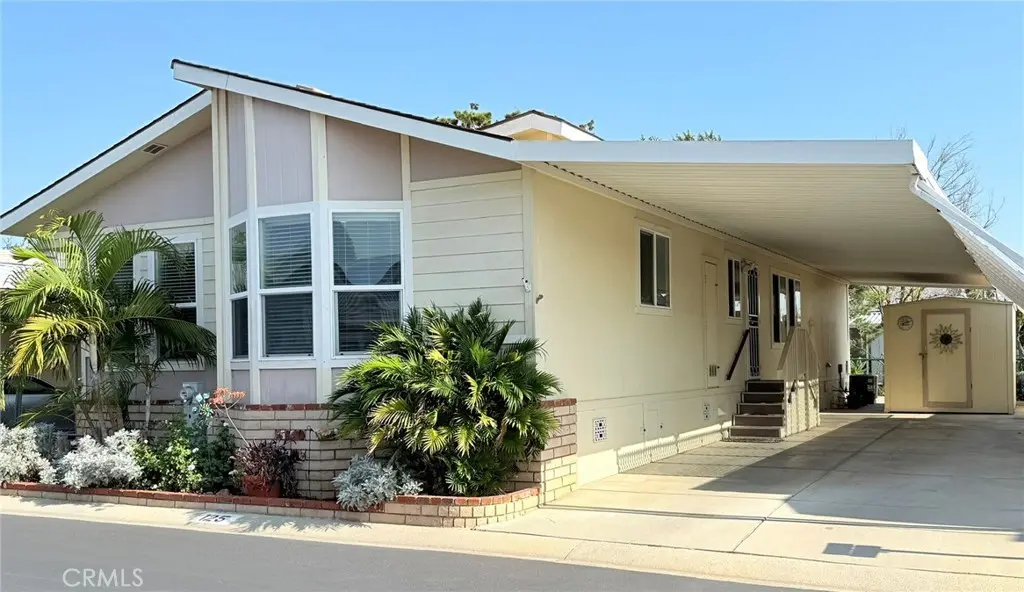
1245 W Cienega Ave #125 · San Dimas, CA
Flood risk 1/10 · Minimal
- FEMA flood zone
- X (unshaded)
- Chance of flooding over 30 yrs
- 0.0%
- Est. flood insurance / yr
- $507 – $1,088
Fire risk 7/10 · Major
- Est. fire insurance / yr
- $659 – $1,223
Heat risk 7/10 · Major
- Hot days now (above 99°F)
- 7 days/yr
- Hot days in 30 yrs
- 20 days/yr
Wind risk 1/10 · Minimal
- Chance of severe wind over 30 yrs
- —
Air-quality risk 8/10 · Major
- Unhealthy air days now
- 17 days/yr
- Unhealthy air days in 30 yrs
- 21 days/yr
Risk factors via First Street. Map © Google.
Why this score? — see what drove the C+ grade
The composite is a weighted blend of 9 inputs, each scored 0–100. Each bar is that input's sub-score; the figure is the points it added to the 100-point composite (weight × sub-score).
- Cash flow +30.0/30.0
- DSCR +10.0/10.0
- 1% rule +8.0/10.0
- Schools +5.9/10.0
- Condition / age +4.0/5.0
- Livability +3.6/5.0
- Rent growth +2.3/5.0
- ARV discount +1.0/15.0
- Appreciation +0.0/10.0
$240,000
🖨 Deal sheet 📄 Offer letter ✓ Due diligence
Listing remarks
Morning light filters through the windows as coffee brews in a kitchen designed for easy conversation and unhurried mornings. The open living spaces create a natural flow for quiet evenings, casual dinners, and weekends spent relaxing at home. Built in 2004, this 2-bedroom, 1 3/4 bath residence offers thoughtful comfort with generous room sizes, abundant natural light, and a layout that feels both functional and inviting. The primary suite provides a calm retreat with its own quite spacious private bath, while the second bedroom offers flexibility for guests, hobbies, or a home office. Every space feels approachable and easy to maintain, allowing more time to enjoy the surrounding community
Key facts
- Open living spaces
- Access to spa
- Access to clubhouse
Tags
Property features AI
Finance
- Other: Park name: Cienega Valley Estates; Manager approval for tenancy may be required
- Financial info: Land lease (park) - $1,749 monthly (land lease); Rent includes trash and pool
- HOA & community: Community pool; Sport court; Recreational/multipurpose room; Gym/exercise room; Onsite property management; Common RV parking; Trash service (included in rent/land lease); Pet rules (call for details); Call for association rules
Exterior
- Parking: Covered tandem carport; Concrete driveway; Two parking spaces (includes 2 carport spaces)
- Security: Gated community (onsite property management noted in HOA)
- Utilities: Public sewer; District/public water; Natural gas connected; Electricity connected
- Home design: Mobile home (model: Westwood); Double-wide body type; Single story
- Construction: Mobile home remains on site; Mobile dimensions approx. 26 ft wide by 60 ft long; One shed on property; Year built (per public records)
- Exterior features: Open patio; In-ground community pool; Storage building; Close to clubhouse; Faces north
Interior
- Flooring: Laminated floors
- Bathrooms: One full bathroom; One 3/4 bathroom
- Heating & cooling: Central cooling; Central furnace heating
- Interior features: Gated community; Double pane windows; One-level home
- Laundry & utility: Washer included; Dryer included; Washer hookup; Gas dryer hookup; Dedicated laundry room
Neighborhood map
What this means for you Summary
Snapshot
- This is a 2-bed/2.0-bath manufactured listed at $240k. Condition is rated good.
Deal economics
- At list price, monthly cash flow is $1k ($13k/yr) — positive.
- The deal already cash-flows at list — no discount required.
- Meets the 1% rule at list price ($3k rent vs $240k).
- Recommended offer: $233k (3.0% below list) — sets the bar for market timing.
- Cap rate 11.5% vs local median 2.6% in San Dimas — top-decile yield for the area; either an underpriced asset or a hidden risk that comps aren't pricing in. Stress-test before assuming the spread holds.
Location & tenants
- Location reads 72/100 on livability (#192 in CA) — a middle-class / working-renter tenant base. Strengths: employment A+, commute A, schools B; Watch: cost of living F, health & safety F.
- Bonita Unified (suburban): math 59% / reading 70% proficiency, ranked #151 of 1,400 in CA (top 11%) — acceptable for families but not a draw, mixed tenant base, ~2y average lease.
- Market conditions: Rents soft (-1.0%/yr); 85 active listings in the ZIP; 16 comparable units currently listed for rent nearby; rentals at typical pace (median 25d on market — plan ~3-4 weeks tenant-placement turnaround); solid renter incomes; 19,697 units permitted in Los Angeles County in 2024 (9,426 in 5+ unit buildings).
- This rent runs 35% of the median local income ($105k/yr) — at the standard rent-burdened threshold; future hikes will face affordability resistance.
Forward outlook
- Local home prices are declining (-3.0%/yr); year-one equity from $2k of loan paydown is wiped out by about $7k of value loss. Plan a longer hold.
- Los Angeles County population projected at +9% by 2050 — modest demand growth; plan on rents tracking national, not racing it.
- At projected returns (-3.0% appreciation + 0.0% rent growth), your $67k cash investment doubles in ~9 years — after that, you're playing with house money.
Negotiation context
- It's been on market 36 days — a 3% lower offer ($233k) is reasonable based on typical stale-listing flexibility.
- 3 sale attempts since 6y ago with the ask held roughly flat each time — persistent listings suggest the price (not the market) is what's stuck; bring a comps-based counter.
Risks & watch-outs
- Climate carrying-cost: major wildfire risk; extreme-heat days projected 7→20/yr by 2055 (HVAC capex compounding) — expect insurance premiums to compound above CPI over the hold.
Questions for the listing agent
- It's been on market 36 days. Have you received any prior offers? Is the seller open to a 3% concession, seller financing, or rate buy-down credit?
- Is there a deadline driving the sale (1031 exchange, divorce, estate, relocation)? That informs how much negotiation room exists.
- Schools are B-rated — typically a magnet for longer-tenancy family renters. What's the average tenant stay here, and is there a school-zone premium baked into asking?
- What's the average days-on-market for RENTAL listings here right now (not sales)? A rising rental-DOM trend means longer vacancies and softer asking-rent achievability than the comps imply.
- What's the recent tenant-quality profile in this submarket — average credit score on applications, eviction rate, late-payment / NSF rate, and stable-employment percentage? A property-management company in the area should have these aggregated.
- How much new for-sale + rental construction is in the pipeline within 1–3 miles? Heavy new supply typically softens prices + rents 12–24 months out; constrained supply supports both.
Investment metrics
- 1% rule
- 1.30% ✓
- Cap rate
- 11.55%
- Cash-on-cash
- 18.76%
- DSCR
- 1.83
- GRM
- 6.4
CMA / ARV
- ARV (median comp)
- $209,710
- List price
- $240,000
- Delta
- 14.44%
- Verdict
- OVERPRICED
- Comps
- 20 within 1.0 mi
Show comp detail 12 sales within ~0.75 mi
| Address | Dist | Beds/Ba | Sqft | Sold | Price | $/sf | Match |
|---|---|---|---|---|---|---|---|
| 1245 W Cienega Ave #183 | 0.00mi | 2/1.0 | 1,536 (+0%) | 4mo | $125,000 | $81 | 92 |
| 1245 W Cienega Ave #46 | 0.00mi | 3/2.0 (+1) | 1,512 (-1%) | 1mo | $270,000 | $179 | 91 |
| 1245 W Cienega Ave #18 | 0.00mi | 2/2.0 | 1,680 (+10%) | 4mo | $239,900 | $143 | 81 |
| 1245 W Cienega Ave #181 | 0.00mi | 3/2.0 (+1) | 1,624 (+6%) | 9mo | $260,000 | $160 | 77 |
| 1245 W Cienega Ave #123 | 0.00mi | 2/2.0 | 1,348 (-12%) | 9mo | $275,000 | $204 | 72 |
| 1245 W Cienega Ave #44 | 0.06mi | 2/2.0 | 1,368 (-11%) | 10mo | $132,200 | $97 | 71 |
| 1245 W Cienega Ave #88 | 0.00mi | 3/2.0 (+1) | 1,375 (-10%) | 10mo | $350,000 | $255 | 70 |
| 1245 W Cienega Ave #234 | 0.00mi | 3/2.0 (+1) | 1,694 (+10%) | 11mo | $412,000 | $243 | 69 |
| 1635 W Covina #53 | 0.52mi | 3/2.0 (+1) | 1,484 (-3%) | 3mo | $285,000 | $192 | 63 |
| 1630 W Covina Blvd #65 | 0.60mi | 2/2.0 | 1,392 (-9%) | 2mo | $215,000 | $154 | 55 |
| 1205 Cypress St #115 | 0.53mi | 2/2.0 | 1,344 (-12%) | 1mo | $215,000 | $160 | 54 |
| 1205 Cypress St #199 | 0.53mi | 3/2.0 (+1) | 1,344 (-12%) | 10mo | $290,000 | $216 | 41 |
Match score weights: distance 35% · size 25% · config 20% · recency 20%. Top-matched comps best support the ARV.
Projected returns pro-forma
-3.0% appreciation · 0.0% rent growth · sell at horizon
- IRR
- 7.4%
- Equity multiple
- 1.28×
- Total profit
- $18,794
- Equity at exit
- $35,785
- IRR
- 14.2%
- Equity multiple
- 1.99×
- Total profit
- $66,823
- Equity at exit
- $20,751
Cash invested: $67,200 (down + closing). Projections, not guarantees.
Landlord ↔ Tenant lean methodology
- Overall (STATE)
- 18 Strongly Tenant-Friendly
- State California
- 18 Strongly Tenant-Friendly · D+13
- County
- — inherits STATE
- City
- — inherits STATE
ZIP-level market 91773
- Rents YoY
- -1.0%
- Active inventory
- 85
- Price-to-rent
- 6.4×
Monthly cashflow live
- Estimated rent
- $3,115 high interval (Pro) →
- Mortgage (P&I)
- −$1,259
- Tax from tax record
- −$52 /mo · $623/yr
- Insurance
- −$100
- HOA
- −$0
- Vacancy / Maint / Mgmt
- −$654
- Net cashflow
- $1,051
Break-even live
UW: 25.0% down · 7.5% · 30yr · 1.5% tax · 5.0% vac · 8.0% maint · 8.0% mgmt
Financing live
Cash to close
- Down payment
- $60,000
- Closing costs
- $7,200
- Reserves months
- —
- Total cash needed
- —
Loan-product check · same deal, 3 products live
Conventional
25% down · 7.5% · 30yr
- Down + closing
- —
- Monthly P&I
- —
- Monthly cashflow
- —
- DSCR
- —
- Eligible?
- —
Personal DTI + credit; lowest rate.
DSCR
20% down · 8.5% · 30yr
- Down + closing
- —
- Monthly P&I
- —
- Monthly cashflow
- —
- DSCR
- —
- Eligible?
- —
No personal income docs; deal must DSCR.
Hard money
10% down · 12.0% · 12mo
- Down + closing
- —
- Monthly P&I
- —
- Monthly cashflow
- —
- DSCR
- —
- Eligible?
- —
Short-term bridge; refi at stabilization.
Rent comps 16 comps
| Address | Beds | Baths | Sqft | Rent | $/sqft | DOM | Units | Dist |
|---|---|---|---|---|---|---|---|---|
| 1189 Strawberry Ln Glendora, CA | 2.0 | 2.5 | 1292 | $2,900 | $2.24 | 43d | 1 | 0.48mi |
| 1430 W Badillo St San Dimas, CA | 3.0 | 1.5 | 1200 | $3,000 | $2.50 | 1d | 1 | 0.52mi |
| 1471 Cypress St San Dimas, CA | 2.0 | 2.0 | 1127 | $900 | $0.80 | 7d | 1 | 0.53mi |
| 1447 S Valley Center Ave Glendora, CA | 3.0 | 2.0 | 1345 | $3,500 | $2.60 | 1d | 1 | 0.65mi |
| 1746 S Sunflower Ave Unit 7 Glendora, CA | 2.0 | 2.0 | 1100 | $2,400 | $2.18 | 24d | 1 | 0.78mi |
| 1746 S Sunflower Ave Unit 10 Glendora, CA | 2.0 | 1.5 | 1100 | $2,400 | $2.18 | 43d | 1 | 0.78mi |
| 644 Pearlanna Dr San Dimas, CA | 3.0 | 1.5 | 1350 | $3,500 | $2.59 | 1d | 1 | 0.95mi |
| 522 W 4th St San Dimas, CA | 3.0 | 1.0 | 1113 | $3,550 | $3.19 | 43d | 1 | 1.01mi |
| 608 Claraday St Glendora, CA | 3.0 | 2.5 | 1600 | $3,500 | $2.19 | 43d | 1 | 1.16mi |
| 432 W Caldwell Ct San Dimas, CA | 2.0 | 3.0 | 1502 | $3,100 | $2.06 | 43d | 1 | 1.17mi |
| 807 Avenida Loma Vis San Dimas, CA | 3.0 | 2.0 | 1740 | $4,500 | $2.59 | 10d | 1 | 1.29mi |
| 220 W 1st St San Dimas, CA | 3.0 | 1.0 | 1200 | $845 | $0.70 | 17d | 1 | 1.32mi |
| 235 W 4th St San Dimas, CA | 3.0 | 2.0 | 1200 | $3,499 | $2.92 | 1d | 1 | 1.36mi |
| 204 San Luis Rey Dr San Dimas, CA | 2.0 | 3.0 | 1287 | $3,165 | $2.46 | 5d | 1 | 1.40mi |
| 20254 E Arrow Hwy Unit B Covina, CA | 3.0 | 2.5 | 1477 | $3,100 | $2.10 | 24d | 1 | 1.43mi |
| 20240 E Arrow Hwy Unit D Covina, CA | 3.0 | 2.5 | 1477 | $3,350 | $2.27 | 43d | 1 | 1.44mi |
Listing history 18 events
-
2026-06-18days on market $240,000 Active 36 DOM
-
2026-06-17days on market $240,000 Active 35 DOM
-
2026-06-16days on market $240,000 Active 34 DOM
-
2026-06-15days on market $240,000 Active 33 DOM
-
2026-06-13days on market $240,000 Active 31 DOM
-
2026-06-13days on market $240,000 Active 30 DOM
-
2026-06-09days on market $240,000 Active 27 DOM
-
2026-06-08days on market $240,000 Active 26 DOM
-
2026-06-07days on market $240,000 Active 25 DOM
-
2026-06-04days on market $240,000 Active 22 DOM
-
2026-06-03days on market $240,000 Active 21 DOM
-
2026-06-02days on market $240,000 Active 20 DOM
-
2026-06-01days on market $240,000 Active 19 DOM
-
2026-05-31days on market $240,000 Active 18 DOM
-
2026-05-13$240,000 Active 1179-char remark
-
2021-02-26status Pending Sale
-
2021-02-25status Active
-
2020-10-28$129,900 Active
ⓘ Source: listings_history table (triggers on properties + properties_extension) + one-shot
backfill from property_details.listing_events for pre-trigger history.
Tax reassessment forecast CA · Resets to sale price
- Current annual tax
- $623 · $52/mo
- Projected year-2 tax
- $1,824 · $152/mo
- Expected delta
- +$1,201/yr (+$100/mo · 192.7%)
ⓘ Screening estimate from a state-policy table — verify with the county assessor before closing.
Climate risk First Street
- Flood 1/10 Low FEMA zone X (unshaded) · 0% chance over 30 yrs
- Wildfire 7/10 Severe
- Heat 7/10 Severe 7 d/yr ≥99°F today · 20 d/yr by 30 yrs out
- Wind 1/10 Low
- Air quality 8/10 Severe 17 unhealthy d/yr today · 21 by 30 yrs out
Nearby sold comps map
Loading sold comps map…
Walkable amenities ~0.75 mi
Loading nearby amenities…
Taxation est. · year 1
- Rental income
- $37,386
- − Mortgage interest
- −$13,444
- − Property taxes
- −$623
- − Insurance
- −$1,200
- − Repairs & maintenance
- −$2,991
- − Management
- −$2,991
- − Depreciation
- −$6,982
- Taxable income
- $9,155
- Est. tax owed @ 24.0%
- −$2,197
- After-tax cash flow
- $10,411/yr
For passive investors: Depreciation is non-cash, so a rental often shows a tax loss while cash-flowing — sheltering income. Rental losses are passive: they offset passive income freely, and up to $25,000/yr can offset ordinary (W-2) income if you actively participate and your MAGI is under $100k (phasing out to $0 by $150k); unused losses carry forward. On sale, claimed depreciation is recaptured at up to 25%, and gains may owe capital-gains tax (a 1031 exchange can defer both). Figures are a year-1 estimate at your 24.0% rate — not tax advice; consult a CPA.
Condition & rehab AI · 12 photos
This manufactured home is in good condition with minimal repairs needed. It offers a good balance of updates and maintenance to increase its resale and rental value.
Value-add opportunities
- Both Painting exterior and interior walls — Enhances curb appeal and interior aesthetics
- Both Updating kitchen appliances — Modernizes the kitchen and improves functionality
- Both Upgrading bathroom fixtures — Enhances the bathrooms and adds value
- Both Landscaping improvements — Enhances curb appeal and adds value
Renovation cost estimate screening
Value-add ROI direction
- Both Painting exterior and interior walls — Enhances curb appeal and interior aesthetics ↑
- Both Updating kitchen appliances — Modernizes the kitchen and improves functionality ↑
- Both Upgrading bathroom fixtures — Enhances the bathrooms and adds value ↑
- Both Landscaping improvements — Enhances curb appeal and adds value ↑
ⓘ Cost ranges are severity-bucket heuristics (US national rule-of-thumb). Get contractor quotes + a written scope before underwriting a rehab budget.
Schools (NCES district)
- District
- Bonita Unified
- NCES district ID
- 0605610
- Math proficiency
- 59% ▲ 3.00%
- Reading proficiency
- 70% ▬ 0.00%
- Median HH income
- $76,196
- Composite
- 58.71/100
- National rank
- #2001
- State rank
- #151 of 1400 in CA
Livability — San Dimas
- Score
- 72/100
- State rank
- #192
- US rank
- #6164
Category grades
Schools grade is shown separately in the Schools card above.
Census & demographics
- Census place
- San Dimas, CA
- County
- Los Angeles County · 9,444,647 people
- City population
- 33,598
- Metro
- Los Angeles-Long Beach-Anaheim, CA
- Population (ZIP)
- 33,598
- Household income
- $105,338
- Rent vs Own
- Severe rent burden
- 1238.0
Population outlook (Los Angeles County) Hauer SSP2
- Today (2025)
- 10,940,515 people
- By 2030
- 11,256,481 · +2.9%
- By 2040
- 11,729,929 · +7.2%
- By 2050
- 11,948,407 · +9.2%
- By 2075
- 11,818,114 · +8.0%
- By 2100
- 10,842,928 · -0.9%
Race, ethnicity, and origin ACS 2023
- Neighborhood character
- Diverse neighborhood (Simpson 0.69)
- Race & ethnicity
- White 38% Hispanic / Latino 37% Two or more races 19% Asian 18% Black 3% Native American 1%
- Hispanic origin (detail)
- Mexican 27% Puerto Rican 1%
- Common ancestry
- Romanian 2% Lithuanian 2% Slovak 2%
- Foreign-born
- 22% · Canada, China, Vietnam
- Languages at home
- 64% English-only · Spanish 18% Chinese 8% Tagalog/Filipino 2%
Political lean MEDSL · Los Angeles
- 2024 margin
- Solid D (+32.9) · D 64.8% · R 31.9% · Other 3.3%
- 2008→2024 swing
- -7.4pp toward R · 2008: 40.4pp · 2024: 32.9pp
- All cycles
- 2024: D+32.9 2020: D+44.2 2016: D+48.0 2012: D+40.0 2008: D+40.4
Not yet ingested
- Civics
- —
Market trends
- HPI YoY
- ▼ -778.24%
- Current HPI
- 379.5269
- Rent YoY
- ▼ -0.97%
- Metro
- Los Angeles-Long Beach-Anaheim, CA
- State GDP YoY
- ▲ 3.21%
- F500 in state
- 116
Industry mix (Fortune 500 HQ in CA)
| Industry | F500 HQs | Revenue |
|---|---|---|
| Technology | 27 | $1,492B |
|
||
| Financial Services | 3 | $174B |
|
||
| Retail | 3 | $44B |
|
||
| Insurance | 3 | $26B |
|
||
| Media / Entertainment | 2 | $115B |
|
||
| Pharmaceuticals / Biotech | 2 | $62B |
|
||
Price history
+84.8% since first listed4 events — show timeline
- 2026-05-13 Listed $240,000 CRMLS
- 2021-02-26 Pending — CRMLS
- 2021-02-25 Relisted — CRMLS
- 2020-10-28 Listed $129,900 CRMLS
Property tax history
+6.6%/yrLatest (2025): $623 · +6.6% YoY. Source: county tax records.
Cash-flow waterfall
monthlySold comps — $/sqft
last 12 mo · ≤1 miLoading sold comps…