 🔨 Auction
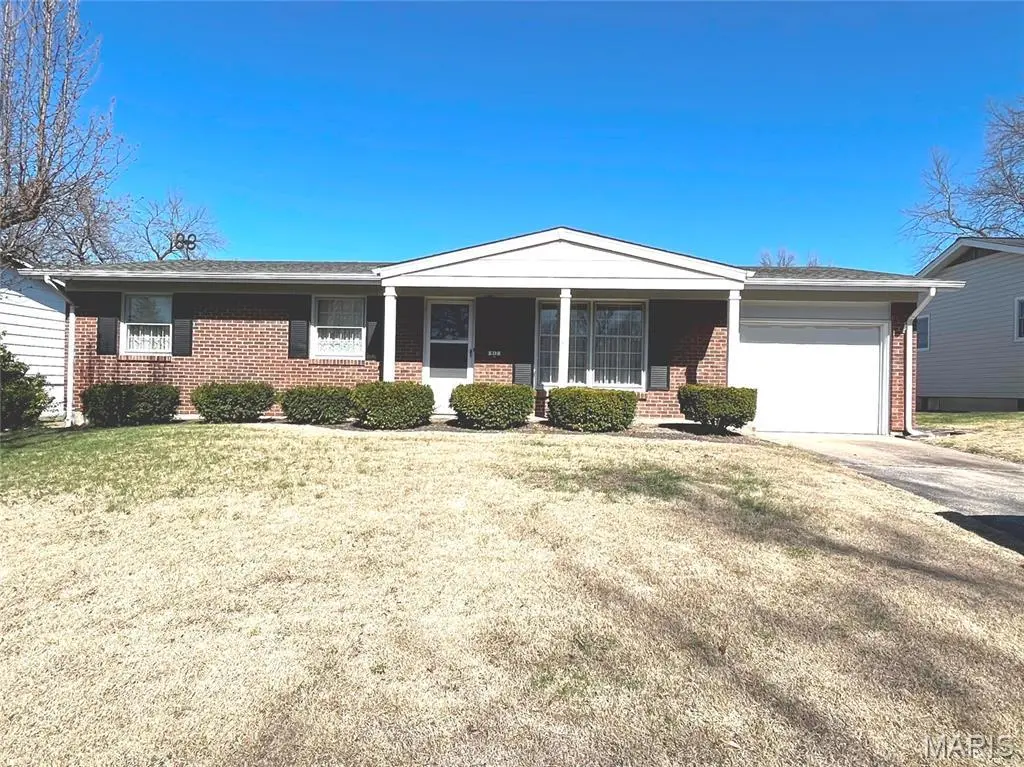
917 Wilmington Dr · St. Charles, MO
Flood risk 1/10 · Minimal
- FEMA flood zone
- X (unshaded)
- Chance of flooding over 30 yrs
- 0.0%
- Est. flood insurance / yr
- $473 – $860
Fire risk 1/10 · Minimal
- Est. fire insurance / yr
- $1,054 – $1,958
Heat risk 5/10 · Moderate
- Hot days now (above 106°F)
- 7 days/yr
- Hot days in 30 yrs
- 20 days/yr
Wind risk 2/10 · Minimal
- Chance of severe wind over 30 yrs
- 1.0%
Air-quality risk 3/10 · Minor
- Unhealthy air days now
- 2 days/yr
- Unhealthy air days in 30 yrs
- 3 days/yr
Risk factors via First Street. Map © Google.
Why this score? — see what drove the F grade
The composite is a weighted blend of 9 inputs, each scored 0–100. Each bar is that input's sub-score; the figure is the points it added to the 100-point composite (weight × sub-score).
- ARV discount +7.5/15.0
- Cash flow +4.9/30.0
- Schools +4.1/10.0
- Rent growth +3.3/5.0
- Livability +2.5/5.0
- Condition / age +2.2/5.0
- 1% rule +0.7/10.0
- DSCR +0.0/10.0
- Appreciation +0.0/10.0
$1
🖨 Deal sheet (PDF) 📄 Offer letter ✓ Due diligence
Listing remarks MLS
To be sold at public auction on Saturday, May 9, 2026 at 1:00 from our auction barn located at 421 John Deere Drive; Troy, MO Buyer responsibility to double school boundaries. Public Open House on Thursday April 16, 2026 from 4:00pm-6:00pm
Key facts
- 8,398 sq ft lot
- Garage
- Built 1967
Neighborhood map
What this means for you Summary
Snapshot
- This is a 3-bed/2.0-bath single-family listed at $1. Condition is rated fair.
Deal economics
- At list price, monthly cash flow is $-666 ($-8k/yr) — negative.
- The deal already cash-flows at list — no discount required.
- Meets the 1% rule at list price ($2k rent vs $1).
Location & tenants
- Location reads: area grade F — affects rentability + tenant quality, not the cash-flow math above.
- St. Charles R-VI (urban): math 44% / reading 52% proficiency, ranked #51 of 324 in MO (top 16%) — families likely to look elsewhere, expect single-tenant / working-renter base with shorter leases.
- Market conditions: Rents rising (+3.2%/yr); 301 active listings in the ZIP; 4 comparable units currently listed for rent nearby; rentals at typical pace (median 20d on market — plan ~3-4 weeks tenant-placement turnaround); solid renter incomes; 2,021 units permitted in St. Charles County in 2024 (568 in 5+ unit buildings).
Forward outlook
- Local home prices are declining (-3.0%/yr); year-one equity from $2k of loan paydown is wiped out by about $8k of value loss. Plan a longer hold.
- St. Charles County population projected at +22% by 2050 — long-run rental-demand tailwind backs the buy-and-hold thesis.
Negotiation context
- It's been on market 30 days — a 2% lower offer ($0) is reasonable based on typical stale-listing flexibility.
Risks & watch-outs
- Watch-outs: property tax is 413666.4% of price.
- Climate carrying-cost: extreme-heat days projected 7→20/yr by 2055 (HVAC capex compounding) — expect insurance premiums to compound above CPI over the hold.
Questions for the listing agent
- What do current leases actually rent for vs. the listed asking? Can we see a recent rent roll and the last 12 months of T-12 income?
- Have any recent inspections been done? Can we get a copy of the seller's disclosures and any deferred-maintenance estimates?
- Built in 1967 — when were the roof, HVAC, electrical panel, plumbing, and water heater last replaced?
- Property tax is high relative to price — has the assessment been appealed recently, and will the sale trigger a re-assessment?
- Is there a deadline driving the sale (1031 exchange, divorce, estate, relocation)? That informs how much negotiation room exists.
- The area grade is low — what's the realistic commute time and amenity access for the typical tenant pool here? Any planned neighborhood developments (good or bad) we should know about?
- What's the average days-on-market for RENTAL listings here right now (not sales)? A rising rental-DOM trend means longer vacancies and softer asking-rent achievability than the comps imply.
- What's the recent tenant-quality profile in this submarket — average credit score on applications, eviction rate, late-payment / NSF rate, and stable-employment percentage? A property-management company in the area should have these aggregated.
- How much new for-sale + rental construction is in the pipeline within 1–3 miles? Heavy new supply typically softens prices + rents 12–24 months out; constrained supply supports both.
Investment metrics
- 1% rule
- 0.57% ✗
- Cap rate
- 3.39%
- Cash-on-cash
- -10.35%
- DSCR
- 0.54
- GRM
- 14.6
CMA / ARV
- ARV (median comp)
- $275,778
- List price
- $1
- Delta
- -100.00%
- Verdict
- UNDERPRICED
- Comps
- 20 within 1.0 mi
Show comp detail 12 sales within ~0.75 mi
| Address | Dist | Beds/Ba | Sqft | Sold | Price | $/sf | Match |
|---|---|---|---|---|---|---|---|
| 917 Wilmington Dr | 0.00mi | 3/2.0 | 1,092 (0%) | 1mo | $1 | — | 99 |
| 2111 W Randolph St | 0.38mi | 3/2.0 | 1,144 (+5%) | 6mo | $280,000 | $245 | 69 |
| 2948 Homewood Ave | 0.62mi | 3/2.0 | 1,118 (+2%) | 4mo | $275,000 | $246 | 64 |
| 2422 W Adams St | 0.35mi | 3/2.0 | 1,185 (+8%) | 8mo | $270,000 | $228 | 63 |
| 404 N Duchesne Dr | 0.49mi | 3/1.5 | 1,040 (-5%) | 11mo | $225,000 | $216 | 58 |
| 324 Elmwood Dr | 0.51mi | 3/2.5 | 1,210 (+11%) | 3mo | $245,000 | $202 | 54 |
| 1718 Gallaher Ave | 0.69mi | 3/1.5 | 972 (-11%) | 8mo | $255,000 | $262 | 41 |
| 2502 Linden Pl | 0.73mi | 3/1.5 | 988 (-10%) | 12mo | $235,000 | $238 | 38 |
| 620 Pine St | 0.68mi | 3/1.0 | 967 (-11%) | 12mo | $225,000 | $233 | 36 |
| 616 Pine St | 0.68mi | 2/1.0 (-1) | 967 (-11%) | 9mo | $220,000 | $228 | 32 |
| 3000 Elm St | 0.74mi | 3/3.0 | 1,236 (+13%) | 12mo | $229,900 | $186 | 30 |
| 1036 Olive St | 0.68mi | 2/1.0 (-1) | 937 (-14%) | 9mo | $189,900 | $203 | 28 |
Match score weights: distance 35% · size 25% · config 20% · recency 20%. Top-matched comps best support the ARV.
Projected returns pro-forma
-3.0% appreciation · 3.2% rent growth · sell at horizon
- IRR
- -34.8%
- Equity multiple
- -0.12×
- Total profit
- $-86,783
- Equity at exit
- $41,119
- IRR
- -43.9%
- Equity multiple
- -0.67×
- Total profit
- $-128,811
- Equity at exit
- $23,844
Cash invested: $77,218 (down + closing). Projections, not guarantees.
Landlord ↔ Tenant lean methodology
- Overall (STATE)
- 81 Strongly Landlord-Friendly
- State Missouri
- 81 Strongly Landlord-Friendly · R+10
- County
- — inherits STATE
- City
- — inherits STATE
ZIP-level market 63301
- Rents YoY
- 3.2%
- Active inventory
- 301
Monthly cashflow live
- Estimated rent
- $1,569 medium interval (Pro) →
- Mortgage (P&I)
- −$1,446
- Tax est. 1.5%
- −$345 /mo · $4,137/yr
- Insurance
- −$115
- HOA
- −$0
- Vacancy / Maint / Mgmt
- −$330
- Net cashflow
- $-666
Break-even live
Sensitivity live
| Price | -10% $-476 | -5% $-571 | +0% $-666 | +5% $-762 | +10% $-857 |
|---|---|---|---|---|---|
| Rent | -10% $-790 | -5% $-728 | +0% $-666 | +5% $-604 | +10% $-542 |
| Rate | -1.0pp $-527 | -0.5pp $-596 | base $-666 | +0.5pp $-738 | +1.0pp $-810 |
UW: 25.0% down · 7.5% · 30yr · 1.5% tax · 5.0% vac · 8.0% maint · 8.0% mgmt
Financing live
Cash to close
- Down payment
- $68,944
- Closing costs
- $8,273
- Reserves months
- —
- Total cash needed
- —
Loan-product check · same deal, 3 products live
Conventional
25% down · 7.5% · 30yr
- Down + closing
- —
- Monthly P&I
- —
- Monthly cashflow
- —
- DSCR
- —
- Eligible?
- —
Personal DTI + credit; lowest rate.
DSCR
20% down · 8.5% · 30yr
- Down + closing
- —
- Monthly P&I
- —
- Monthly cashflow
- —
- DSCR
- —
- Eligible?
- —
No personal income docs; deal must DSCR.
Hard money
10% down · 12.0% · 12mo
- Down + closing
- —
- Monthly P&I
- —
- Monthly cashflow
- —
- DSCR
- —
- Eligible?
- —
Short-term bridge; refi at stabilization.
Rent comps 4 comps
| Address | Beds | Baths | Sqft | Rent | $/sqft | DOM | Units | Dist |
|---|---|---|---|---|---|---|---|---|
| 1514 N 5th St Saint Charles, MO | 2.0 | 1.5 | 750 | $1,400 | $1.87 | 5d | 1 | 0.85mi |
| 1514 N 5th St Unit 1513 St Charles, MO | 2.0 | 1.5 | 850 | $1,400 | $1.65 | 19d | 1 | 0.85mi |
| 236 S Cadillac Dr Saint Charles, MO | 3.0 | 1.0 | 864 | $1,600 | $1.85 | 6d | 1 | 0.90mi |
| 920 N Benton Ave Unit 918 St Charles, MO | 2.0 | 1.0 | 864 | $1,500 | $1.74 | 21d | 1 | 0.97mi |
Listing history 2 events
-
2026-05-13status Pending 239-char remark
Show marketing remark (239 chars)
To be sold at public auction on Saturday, May 9, 2026 at 1:00 from our auction barn located at 421 John Deere Drive; Troy, MO Buyer responsibility to double school boundaries. Public Open House on Thursday April 16, 2026 from 4:00pm-6:00pm
-
2026-04-13$1 Active 239-char remark
Show marketing remark (239 chars)
To be sold at public auction on Saturday, May 9, 2026 at 1:00 from our auction barn located at 421 John Deere Drive; Troy, MO Buyer responsibility to double school boundaries. Public Open House on Thursday April 16, 2026 from 4:00pm-6:00pm
ⓘ Source: listings_history table (triggers on properties + properties_extension) + one-shot
backfill from property_details.listing_events for pre-trigger history.
Climate risk First Street
- Flood 1/10 Low FEMA zone X (unshaded) · 0% chance over 30 yrs
- Wildfire 1/10 Low
- Heat 5/10 Major 7 d/yr ≥106°F today · 20 d/yr by 30 yrs out
- Wind 2/10 Low 100% chance of damaging wind over 30 yrs
- Air quality 3/10 Moderate 2 unhealthy d/yr today · 3 by 30 yrs out
Nearby sold comps map
Loading sold comps map…
Walkable amenities ~0.75 mi
Loading nearby amenities…
Taxation est. · year 1
- Rental income
- $18,829
- − Mortgage interest
- −$15,448
- − Property taxes
- −$4,137
- − Insurance
- −$1,379
- − Repairs & maintenance
- −$1,506
- − Management
- −$1,506
- − Depreciation
- −$8,023
- Taxable loss
- −$13,170
- Est. tax savings @ 24.0%
- +$3,161
- After-tax cash flow
- $-4,835/yr
For passive investors: Depreciation is non-cash, so a rental often shows a tax loss while cash-flowing — sheltering income. Rental losses are passive: they offset passive income freely, and up to $25,000/yr can offset ordinary (W-2) income if you actively participate and your MAGI is under $100k (phasing out to $0 by $150k); unused losses carry forward. On sale, claimed depreciation is recaptured at up to 25%, and gains may owe capital-gains tax (a 1031 exchange can defer both). Figures are a year-1 estimate at your 24.0% rate — not tax advice; consult a CPA.
Condition & rehab AI · 4 photos
This home requires moderate renovations, focusing on landscaping and exterior paint to improve its curb appeal and overall value.
Repairs flagged
- Major Landscaping — Overgrown and needs trimming
- Minor Exterior paint — Some discoloration
Value-add opportunities
- Both Landscaping and exterior paint — Improves curb appeal and enhances property value
- Both Interior updates — Fresh paint and minor repairs can significantly boost value
Renovation cost estimate screening
| Repair item | Severity | Est. cost |
|---|---|---|
| Landscaping · Overgrown and needs trimming | Major | $15,000–50,000 |
| Exterior paint · Some discoloration | Minor | $500–3,000 |
| Total estimated repair cost · 2 items | $15,500–53,000 |
Value-add ROI direction
- Both Landscaping and exterior paint — Improves curb appeal and enhances property value ↑
- Both Interior updates — Fresh paint and minor repairs can significantly boost value ↑
ⓘ Cost ranges are severity-bucket heuristics (US national rule-of-thumb). Get contractor quotes + a written scope before underwriting a rehab budget.
Schools (NCES district)
- District
- St. Charles R-VI
- NCES district ID
- 2928920
- Math proficiency
- 44% ▼ -4.00%
- Reading proficiency
- 52% ▼ -1.00%
- Median HH income
- $52,897
- Composite
- 41.38/100
- National rank
- #3486
- State rank
- #51 of 324 in MO
Livability — St. Charles
No livability data for this city. (Only ~50 U.S. cities are tracked.)
Census & demographics
- Census place
- St. Charles, MO
- County
- Saint Charles County · 399,703 people
- Metro
- St. Louis, MO-IL
- Population (ZIP)
- 52,667
- Household income
- $85,308
- Rent vs Own
- Severe rent burden
- 1118.0
Population outlook (St. Charles County) Hauer SSP2
- Today (2025)
- 437,857 people
- By 2030
- 461,707 · +5.4%
- By 2040
- 503,222 · +14.9%
- By 2050
- 534,684 · +22.1%
- By 2075
- 597,047 · +36.4%
- By 2100
- 609,682 · +39.2%
Race, ethnicity, and origin ACS 2023
- Neighborhood character
- Predominantly White (80%)
- Race & ethnicity
- White 80% Black 7% Two or more races 7% Hispanic / Latino 7% Asian 2%
- Hispanic origin (detail)
- Mexican 4%
- Common ancestry
- Lithuanian 3% Romanian 2% Italian 2%
- Foreign-born
- 5% · Canada, Guatemala
- Languages at home
- 93% English-only · Spanish 4%
Political lean MEDSL · St. Charles
- 2024 margin
- R (+17.0) · D 40.8% · R 57.8% · Other 1.4%
- 2008→2024 swing
- -7.2pp toward R · 2008: -9.7pp · 2024: -17.0pp
- All cycles
- 2024: R+17.0 2020: R+17.5 2016: R+26.4 2012: R+21.0 2008: R+9.7
Not yet ingested
- Civics
- —
Market trends
- HPI YoY
- ▼ -289.53%
- Current HPI
- 221.0637
- Rent YoY
- ▲ 3.20%
- Metro
- St. Louis, MO-IL
- State GDP YoY
- ▲ 1.84%
- F500 in state
- 20
Industry mix (Fortune 500 HQ in MO)
| Industry | F500 HQs | Revenue |
|---|---|---|
| Healthcare | 1 | $163B |
|
||
| Insurance | 1 | $21B |
|
||
| Industrial Technology | 1 | $17B |
|
||
| Retail | 1 | $16B |
|
||
| Industrial Distribution | 1 | $10B |
|
||
| Utilities | 1 | $9B |
|
||
Property tax history
+3.0%/yrLatest (2025): $2,516 · +1.9% YoY. Source: county tax records.
Cash-flow waterfall
monthlySold comps — $/sqft
last 12 mo · ≤1 miLoading sold comps…