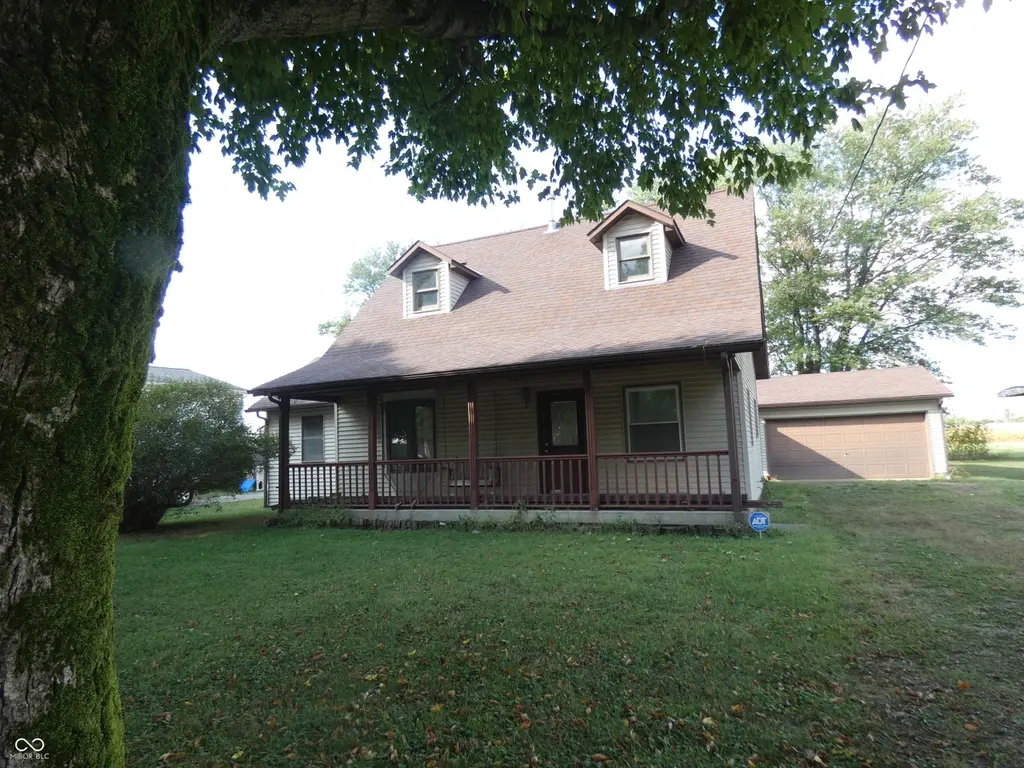
802 Park Rd · Greensburg, IN
Flood risk 1/10 · Minimal
- FEMA flood zone
- X (unshaded)
- Chance of flooding over 30 yrs
- 0.0%
- Est. flood insurance / yr
- $507 – $1,088
Fire risk 1/10 · Minimal
- Est. fire insurance / yr
- $717 – $1,331
Heat risk 3/10 · Minor
- Hot days now (above 102°F)
- 7 days/yr
- Hot days in 30 yrs
- 19 days/yr
Wind risk 2/10 · Minimal
- Chance of severe wind over 30 yrs
- 1.0%
Air-quality risk 2/10 · Minimal
- Unhealthy air days now
- 1 days/yr
- Unhealthy air days in 30 yrs
- 2 days/yr
Risk factors via First Street. Map © Google.
Why this score? — see what drove the B+ grade
The composite is a weighted blend of 9 inputs, each scored 0–100. Each bar is that input's sub-score; the figure is the points it added to the 100-point composite (weight × sub-score).
- Cash flow +30.0/30.0
- ARV discount +15.0/15.0
- 1% rule +10.0/10.0
- DSCR +10.0/10.0
- Schools +3.8/10.0
- Livability +3.5/5.0
- Rent growth +2.5/5.0
- Condition / age +2.5/5.0
- Appreciation +0.0/10.0
$135,000
🖨 Deal sheet 📄 Offer letter ✓ Due diligence
Listing remarks MLS
Fixer upper single-family residence nestled in Decatur County, offering a unique opportunity to own a piece of history. Step inside to find 1884 square feet of living area thoughtfully arranged across two stories, creating distinct spaces for both relaxation and rejuvenation. Imagine the possibilities within the three bedrooms, each offering a private retreat to unwind and recharge at the end of the day. The residence features one full bathroom. Over extended two car garage with workshop. This property sits on a generous 8712 square feet lot, providing ample space for outdoor enjoyment and recreation. Built in 1868, this historic home offers a chance to own a unique piece of Greensburg's past.
Key facts
- Generous lot
- Full bathroom
- Historic home
Tags
Neighborhood map
What this means for you Summary
Snapshot
- This is a 3-bed/1.0-bath single-family listed at $135k.
Deal economics
- At list price, monthly cash flow is $2k ($26k/yr) — positive.
- The deal already cash-flows at list — no discount required.
- Meets the 1% rule at list price ($4k rent vs $135k).
- Recommended offer: $119k (12.0% below list) — sets the bar for market timing.
- Cap rate 25.4% vs local median 5.9% in Greensburg — top-decile yield for the area; either an underpriced asset or a hidden risk that comps aren't pricing in. Stress-test before assuming the spread holds.
Location & tenants
- Location reads 69/100 on livability (#200 in IN) — a middle-class / working-renter tenant base. Strengths: cost of living A+, housing A+, crime B+; Watch: employment C-, schools D+, amenities F.
- Greensburg Community Schools (town): math 38% / reading 51% proficiency, ranked #102 of 301 in IN (top 34%) — families likely to look elsewhere, expect single-tenant / working-renter base with shorter leases.
- Market conditions: 155 active listings in the ZIP; 1 comparable units currently listed for rent nearby; 66 units permitted in Decatur County in 2024 (0 in 5+ unit buildings).
Forward outlook
- Local home prices are declining (-3.0%/yr); year-one equity from $933 of loan paydown is wiped out by about $4k of value loss. Plan a longer hold.
- Decatur County population projected at +6% by 2050 — modest demand growth; plan on rents tracking national, not racing it.
- At projected returns (-3.0% appreciation + 3.0% rent growth), your $38k cash investment doubles in ~2 years — after that, you're playing with house money.
Negotiation context
- It's been on market 254 days — a 12% lower offer ($119k) is reasonable based on typical stale-listing flexibility.
Risks & watch-outs
- Watch-outs: built in 1868 — expect roof / HVAC / electrical / plumbing capex.
Questions for the listing agent
- It's been on market 254 days. Have you received any prior offers? Is the seller open to a 12% concession, seller financing, or rate buy-down credit?
- Built in 1868 — when were the roof, HVAC, electrical panel, plumbing, and water heater last replaced?
- Why hasn't it sold? Are there any deal-killer items the seller is aware of (foundation, flood, title, zoning, code violations)?
- Is there a deadline driving the sale (1031 exchange, divorce, estate, relocation)? That informs how much negotiation room exists.
- Schools are D-rated, which usually means shorter tenancies and higher turnover. Who's the typical renter profile here, and what's been the actual vacancy rate?
- What's the average days-on-market for RENTAL listings here right now (not sales)? A rising rental-DOM trend means longer vacancies and softer asking-rent achievability than the comps imply.
- What's the recent tenant-quality profile in this submarket — average credit score on applications, eviction rate, late-payment / NSF rate, and stable-employment percentage? A property-management company in the area should have these aggregated.
- How much new for-sale + rental construction is in the pipeline within 1–3 miles? Heavy new supply typically softens prices + rents 12–24 months out; constrained supply supports both.
Investment metrics
- 1% rule
- 2.96% ✓
- Cap rate
- 25.42%
- Cash-on-cash
- 68.30%
- DSCR
- 4.04
- GRM
- 2.8
CMA / ARV
- ARV (median comp)
- $224,520
- List price
- $135,000
- Delta
- -39.87%
- Verdict
- UNDERPRICED
- Comps
- 20 within 1.0 mi
Show comp detail 11 sales within ~0.75 mi
| Address | Dist | Beds/Ba | Sqft | Sold | Price | $/sf | Match |
|---|---|---|---|---|---|---|---|
| 1015 S Creek Dr W | 0.16mi | 3/2.0 | 1,642 (-13%) | 1mo | $256,000 | $156 | 66 |
| 327 W Bryant St | 0.35mi | 3/1.0 | 1,709 (-9%) | 7mo | $200,000 | $117 | 63 |
| 713 S Ireland St | 0.30mi | 3/1.0 | 2,128 (+13%) | 8mo | $164,000 | $77 | 57 |
| 726 S Jordan Dr | 0.71mi | 3/2.0 | 1,935 (+3%) | 2mo | $355,000 | $183 | 57 |
| 621 W Washington St | 0.56mi | 4/2.0 (+1) | 1,764 (-6%) | 9mo | $284,900 | $162 | 47 |
| 431 W Main St W | 0.54mi | 3/2.0 | 1,821 (-3%) | 23mo | $199,900 | $110 | 46 |
| 724 S Kieran Dr | 0.66mi | 3/2.0 | 1,968 (+4%) | 21mo | $389,000 | $198 | 40 |
| 327 N Anderson St | 0.74mi | 2/1.0 (-1) | 1,818 (-4%) | 21mo | $107,500 | $59 | 38 |
| 336 S Franklin St | 0.71mi | 3/1.0 | 1,666 (-12%) | 15mo | $72,000 | $43 | 36 |
| 662 S County Road 150 W | 0.74mi | 4/2.0 (+1) | 2,088 (+11%) | 6mo | $318,500 | $153 | 34 |
| 338 W North St | 0.74mi | 4/3.0 (+1) | 1,791 (-5%) | 21mo | $155,000 | $87 | 27 |
Match score weights: distance 35% · size 25% · config 20% · recency 20%. Top-matched comps best support the ARV.
Projected returns pro-forma
-3.0% appreciation · 3.0% rent growth · sell at horizon
- IRR
- 67.7%
- Equity multiple
- 4.05×
- Total profit
- $115,256
- Equity at exit
- $20,129
- IRR
- 71.9%
- Equity multiple
- 8.33×
- Total profit
- $277,232
- Equity at exit
- $11,672
Cash invested: $37,800 (down + closing). Projections, not guarantees.
Landlord ↔ Tenant lean methodology
- Overall (STATE)
- 90 Strongly Landlord-Friendly
- State Indiana
- 90 Strongly Landlord-Friendly · R+11
- County
- — inherits STATE
- City
- — inherits STATE
ZIP-level market 47240
- Home prices YoY
- -25.0%
- Active inventory
- 155
- Price-to-rent
- 2.8×
Monthly cashflow live
- Estimated rent
- $3,995 medium interval (Pro) →
- Mortgage (P&I)
- −$708
- Tax from tax record
- −$240 /mo · $2,885/yr
- Insurance
- −$56
- HOA
- −$0
- Vacancy / Maint / Mgmt
- −$839
- Net cashflow
- $2,151
Break-even live
UW: 25.0% down · 7.5% · 30yr · 1.5% tax · 5.0% vac · 8.0% maint · 8.0% mgmt
Financing live
Cash to close
- Down payment
- $33,750
- Closing costs
- $4,050
- Reserves months
- —
- Total cash needed
- —
Loan-product check · same deal, 3 products live
Conventional
25% down · 7.5% · 30yr
- Down + closing
- —
- Monthly P&I
- —
- Monthly cashflow
- —
- DSCR
- —
- Eligible?
- —
Personal DTI + credit; lowest rate.
DSCR
20% down · 8.5% · 30yr
- Down + closing
- —
- Monthly P&I
- —
- Monthly cashflow
- —
- DSCR
- —
- Eligible?
- —
No personal income docs; deal must DSCR.
Hard money
10% down · 12.0% · 12mo
- Down + closing
- —
- Monthly P&I
- —
- Monthly cashflow
- —
- DSCR
- —
- Eligible?
- —
Short-term bridge; refi at stabilization.
Rent comps 1 comps
| Address | Beds | Baths | Sqft | Rent | $/sqft | DOM | Units | Dist |
|---|---|---|---|---|---|---|---|---|
| 1011 N Anderson St Greensburg, IN | 3.0 | 2.5 | 1620 | $3,995 | $2.47 | 11d | 1 | 1.22mi |
Listing history 17 events
-
2026-06-18days on market $135,000 Active 254 DOM
-
2026-06-17days on market $135,000 Active 253 DOM
-
2026-06-16days on market $135,000 Active 252 DOM
-
2026-06-15days on market $135,000 Active 251 DOM
-
2026-06-13days on market $135,000 Active 249 DOM
-
2026-06-12days on market $135,000 Active 248 DOM
-
2026-06-09days on market $135,000 Active 245 DOM
-
2026-06-08days on market $135,000 Active 244 DOM
-
2026-06-07days on market $135,000 Active 243 DOM
-
2026-06-05days on market $135,000 Active 241 DOM
-
2026-06-04days on market $135,000 Active 239 DOM
-
2026-06-02days on market $135,000 Active 238 DOM
-
2026-06-01days on market $135,000 Active 237 DOM
-
2026-05-31days on market $135,000 Active 236 DOM
-
2026-05-31days on market $135,000 Active 235 DOM
-
2026-03-12price $135,000 703-char remark
Show marketing remark (703 chars)
Fixer upper single-family residence nestled in Decatur County, offering a unique opportunity to own a piece of history. Step inside to find 1884 square feet of living area thoughtfully arranged across two stories, creating distinct spaces for both relaxation and rejuvenation. Imagine the possibilities within the three bedrooms, each offering a private retreat to unwind and recharge at the end of the day. The residence features one full bathroom. Over extended two car garage with workshop. This property sits on a generous 8712 square feet lot, providing ample space for outdoor enjoyment and recreation. Built in 1868, this historic home offers a chance to own a unique piece of Greensburg's past.
-
2025-10-07$145,000 Active 703-char remark
Show marketing remark (703 chars)
Fixer upper single-family residence nestled in Decatur County, offering a unique opportunity to own a piece of history. Step inside to find 1884 square feet of living area thoughtfully arranged across two stories, creating distinct spaces for both relaxation and rejuvenation. Imagine the possibilities within the three bedrooms, each offering a private retreat to unwind and recharge at the end of the day. The residence features one full bathroom. Over extended two car garage with workshop. This property sits on a generous 8712 square feet lot, providing ample space for outdoor enjoyment and recreation. Built in 1868, this historic home offers a chance to own a unique piece of Greensburg's past.
ⓘ Source: listings_history table (triggers on properties + properties_extension) + one-shot
backfill from property_details.listing_events for pre-trigger history.
Tax reassessment forecast IN · Partial reset (capped growth)
- Current annual tax
- $2,885 · $240/mo
- Projected year-2 tax
- $2,885 · $240/mo
- Expected delta
- $0/yr ($0/mo · 0.0%)
ⓘ Screening estimate from a state-policy table — verify with the county assessor before closing.
Climate risk First Street
- Flood 1/10 Low FEMA zone X (unshaded) · 0% chance over 30 yrs
- Wildfire 1/10 Low
- Heat 3/10 Moderate 7 d/yr ≥102°F today · 19 d/yr by 30 yrs out
- Wind 2/10 Low 100% chance of damaging wind over 30 yrs
- Air quality 2/10 Low 1 unhealthy d/yr today · 2 by 30 yrs out
Nearby sold comps map
Loading sold comps map…
Walkable amenities ~0.75 mi
Loading nearby amenities…
Taxation est. · year 1
- Rental income
- $47,940
- − Mortgage interest
- −$7,562
- − Property taxes
- −$2,885
- − Insurance
- −$675
- − Repairs & maintenance
- −$3,835
- − Management
- −$3,835
- − Depreciation
- −$3,927
- Taxable income
- $25,221
- Est. tax owed @ 24.0%
- −$6,053
- After-tax cash flow
- $19,765/yr
For passive investors: Depreciation is non-cash, so a rental often shows a tax loss while cash-flowing — sheltering income. Rental losses are passive: they offset passive income freely, and up to $25,000/yr can offset ordinary (W-2) income if you actively participate and your MAGI is under $100k (phasing out to $0 by $150k); unused losses carry forward. On sale, claimed depreciation is recaptured at up to 25%, and gains may owe capital-gains tax (a 1031 exchange can defer both). Figures are a year-1 estimate at your 24.0% rate — not tax advice; consult a CPA.
Schools (NCES district)
- District
- Greensburg Community Schools
- NCES district ID
- 1804080
- Math proficiency
- 38% ▼ -7.00%
- Reading proficiency
- 51% ▼ -2.00%
- Median HH income
- $47,723
- Composite
- 37.96/100
- National rank
- #4301
- State rank
- #102 of 301 in IN
Livability — Greensburg
- Score
- 69/100
- State rank
- #200
- US rank
- #8922
Category grades
Schools grade is shown separately in the Schools card above.
Census & demographics
- Census place
- Greensburg, IN
- Population (ZIP)
- 21,514
Population outlook (Decatur County) Hauer SSP2
- Today (2025)
- 27,709 people
- By 2030
- 28,278 · +2.1%
- By 2040
- 29,195 · +5.4%
- By 2050
- 29,512 · +6.5%
- By 2075
- 29,835 · +7.7%
- By 2100
- 27,192 · -1.9%
Race, ethnicity, and origin ACS 2023
- Neighborhood character
- Predominantly White (93%)
- Race & ethnicity
- White 93% Two or more races 5% Hispanic / Latino 3%
- Common ancestry
- Slovak 2% Serbian 1% Romanian 1%
- Foreign-born
- 1% · Canada
- Languages at home
- 98% English-only · Spanish 2%
Political lean MEDSL · Decatur
- 2024 margin
- Solid R (+58.5) · D 19.9% · R 78.4% · Other 1.8%
- 2008→2024 swing
- -34.1pp toward R · 2008: -24.4pp · 2024: -58.5pp
- All cycles
- 2024: R+58.5 2020: R+58.1 2016: R+57.4 2012: R+40.5 2008: R+24.4
Not yet ingested
- Civics
- —
Market trends
- HPI YoY
- ▼ -70.13%
- Current HPI
- 210.3591
- Rent YoY
- —
- Metro
- —
- State GDP YoY
- ▲ 2.90%
- F500 in state
- 18
Industry mix (Fortune 500 HQ in IN)
| Industry | F500 HQs | Revenue |
|---|---|---|
| Industrial Machinery | 2 | $37B |
|
||
| Healthcare | 1 | $177B |
|
||
| Pharmaceuticals | 1 | $45B |
|
||
| Metals / Steel | 1 | $18B |
|
||
| Agriculture | 1 | $17B |
|
||
| Packaging | 1 | $12B |
|
||
Price history
-6.9% since first listed2 events — show timeline
- 2026-03-12 Price Changed $135,000 MIBOR as Distributed by MLS Grid
- 2025-10-07 Listed $145,000 MIBOR as Distributed by MLS Grid
Property tax history
+5.6%/yrLatest (2023): $2,885 · +6.7% YoY. Source: county tax records.
Cash-flow waterfall
monthlySold comps — $/sqft
last 12 mo · ≤1 miLoading sold comps…