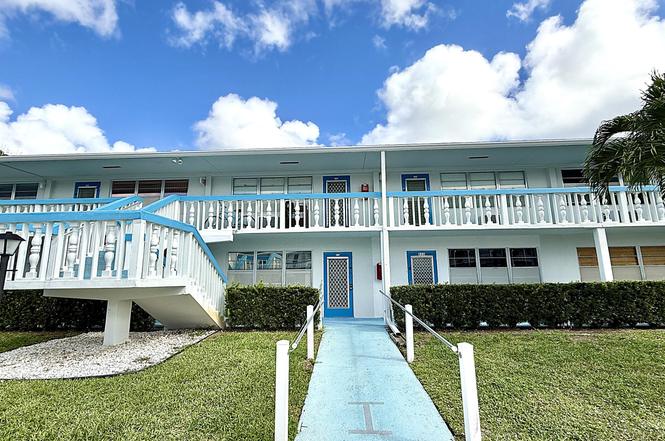
122 Oakridge I · Deerfield Beach, FL
Flood risk No data
- FEMA flood zone
- —
- Chance of flooding over 30 yrs
- —
- Est. flood insurance / yr
- —
Fire risk No data
- Est. fire insurance / yr
- —
Heat risk No data
- Hot days now (above threshold)
- —
- Hot days in 30 yrs
- —
Wind risk No data
- Chance of severe wind over 30 yrs
- —
Air-quality risk No data
- Unhealthy air days now
- —
- Unhealthy air days in 30 yrs
- —
Risk factors via First Street. Map © Google.
Why this score? — see what drove the C grade
The composite is a weighted blend of 9 inputs, each scored 0–100. Each bar is that input's sub-score; the figure is the points it added to the 100-point composite (weight × sub-score).
- Cash flow +20.9/30.0
- 1% rule +10.0/10.0
- ARV discount +7.5/15.0
- DSCR +6.7/10.0
- Schools +4.1/10.0
- Livability +3.8/5.0
- Condition / age +2.8/5.0
- Rent growth +2.5/5.0
- Appreciation +0.0/10.0
$84,900
🖨 Deal sheet (PDF) 📄 Offer letter ✓ Due diligence
Listing remarks
2nd Floor partially furnished 1 BR & 1.5 Bath in Garden Style Building. Walk out your front door and enjoy a serene walk along the canal. Laminate flooring throughout. Enclosed Patio with with garden view. Near Oakridge Community Pool. Living Room AC replaced 2025. Enjoy resort style active 55+ community w/ tons of amenities, 16 satellite pools, clubhouse, Olympic size indoor heated pool, professional exercise center, tennis, volley ball, bocce ball, luxury theater, movies, café, billiards, shuffle board, classes, sauna, outdoor pool, free bus transportation, near shopping & approx. 4 miles to beaches.
Key facts
- Tennis
- Garden view
- Bocce ball
Tags
Property features AI
Finance
- Financial info: Pets are not allowed; Marked as a senior community
- HOA & community: Association with monthly HOA fees; HOA amenities include billiard room, clubhouse, fitness center, game room, indoor pool, jogging path, shuffleboard court, tennis courts, trails, bocce ball, café/restaurant, courtesy bus, pickleball courts, putting green; HOA fee is collected monthly and includes cable TV, sewer, trash, and water
Exterior
- Parking: Assigned parking
- Utilities: Public water; Public sewer; Sewer and water available
- Home design: Condominium; Multi/split levels; Two-story building; Faces north; Resale property
- Construction: Other construction materials
- Exterior features: Covered patio; Patio
Interior
- Bedrooms: One bedroom on the main level
- Flooring: Ceramic tile; Laminate
- Bathrooms: One full bathroom; One half bathroom
- Heating & cooling: Window/wall heating; Wall/window cooling units
- Interior features: Partially furnished; Blinds on windows; No notable built-in interior features listed
Neighborhood map
What this means for you Summary
Snapshot
- This is a 1-bed/1.5-bath condo listed at $85k. Condition is rated average.
Deal economics
- At list price, monthly cash flow is $119 ($1k/yr) — positive.
- The deal already cash-flows at list — no discount required.
- Meets the 1% rule at list price ($2k rent vs $85k).
- Recommended offer: $75k (12.0% below list) — sets the bar for market timing.
- Cap rate 8.0% vs local median 4.1% in Deerfield Beach — top-decile yield for the area; either an underpriced asset or a hidden risk that comps aren't pricing in. Stress-test before assuming the spread holds.
Location & tenants
- Location reads 75/100 on livability (#250 in FL, #3,970 nationally) — a middle-class / working-renter tenant base. Strengths: housing A+, health & safety A+, cost of living A; Watch: amenities D-, employment D-.
- Broward (suburban): math 42% / reading 53% proficiency, ranked #46 of 73 in FL (top 63%) — families likely to look elsewhere, expect single-tenant / working-renter base with shorter leases.
- Zoned schools: Quiet Waters Elementary School (math 40% / reading 48%, grade F, #1,330 of 2,144 statewide, top 63%, 1,128 students, 62% FRL); Lyons Creek Middle School (math 49% / reading 53%, grade C, #237 of 571 statewide, top 43%, 1,757 students, 60% FRL); Deerfield Beach High School (math 12% / reading 37%, grade F, #505 of 667 statewide, top 79%, 2,251 students, 69% FRL).
- Market conditions: Rents flat; 584 active listings in the ZIP; 40 comparable units currently listed for rent nearby; rentals at typical pace (median 26d on market — plan ~3-4 weeks tenant-placement turnaround); 2,111 units permitted in Broward County in 2024 (1,265 in 5+ unit buildings).
- This rent runs 37% of the median local income ($53k/yr) — at the standard rent-burdened threshold; future hikes will face affordability resistance.
Forward outlook
- Local home prices are declining (-3.0%/yr); year-one equity from $587 of loan paydown is wiped out by about $3k of value loss. Plan a longer hold.
- Broward County population projected at +34% by 2050 — long-run rental-demand tailwind backs the buy-and-hold thesis.
Negotiation context
- It's been on market 142 days — a 12% lower offer ($75k) is reasonable based on typical stale-listing flexibility.
Risks & watch-outs
- Watch-outs: HOA is 36% of rent.
Questions for the listing agent
- It's been on market 142 days. Have you received any prior offers? Is the seller open to a 12% concession, seller financing, or rate buy-down credit?
- Built in 1977 — when were the roof, HVAC, electrical panel, plumbing, and water heater last replaced?
- What does the HOA fee cover, when was the last increase, and are there any pending special assessments or reserve-fund shortfalls?
- Any open or pending special assessments — roof, HVAC, plumbing, elevator, façade? What's the per-unit balance and payoff schedule, and is the seller paying it off at close or rolling it to the buyer?
- Why hasn't it sold? Are there any deal-killer items the seller is aware of (foundation, flood, title, zoning, code violations)?
- Is there a deadline driving the sale (1031 exchange, divorce, estate, relocation)? That informs how much negotiation room exists.
- Schools are D-rated, which usually means shorter tenancies and higher turnover. Who's the typical renter profile here, and what's been the actual vacancy rate?
- What's the average days-on-market for RENTAL listings here right now (not sales)? A rising rental-DOM trend means longer vacancies and softer asking-rent achievability than the comps imply.
- What's the recent tenant-quality profile in this submarket — average credit score on applications, eviction rate, late-payment / NSF rate, and stable-employment percentage? A property-management company in the area should have these aggregated.
- How much new apartment / multifamily construction is in the pipeline within 1–3 miles? Heavy new supply (>2% of stock underway) typically softens rents 12–24 months out; light construction supports rent growth.
Investment metrics
- 1% rule
- 1.93% ✓
- Cap rate
- 7.97%
- Cash-on-cash
- 6.00%
- DSCR
- 1.27
- GRM
- 4.3
CMA / ARV
No comps found within radius.
Projected returns pro-forma
-3.0% appreciation · 0.1% rent growth · sell at horizon
- IRR
- -12.8%
- Equity multiple
- 0.56×
- Total profit
- $-10,444
- Equity at exit
- $12,659
- IRR
- -15.7%
- Equity multiple
- 0.34×
- Total profit
- $-15,742
- Equity at exit
- $7,341
Cash invested: $23,772 (down + closing). Projections, not guarantees.
Landlord ↔ Tenant lean methodology
- Overall (STATE)
- 87 Strongly Landlord-Friendly
- State Florida
- 87 Strongly Landlord-Friendly · R+3
- County
- — inherits STATE
- City
- — inherits STATE
ZIP-level market 33442
- Rents YoY
- 0.1%
- Active inventory
- 584
- Price-to-rent
- 4.3×
Monthly cashflow live
- Estimated rent
- $1,635 high interval (Pro) →
- Mortgage (P&I)
- −$445
- Tax est. 1.5%
- −$106 /mo · $1,274/yr
- Insurance
- −$35
- HOA
- −$586
- Vacancy / Maint / Mgmt
- −$343
- Net cashflow
- $119
Break-even live
Sensitivity live
| Price | -10% $177 | -5% $148 | +0% $119 | +5% $89 | +10% $60 |
|---|---|---|---|---|---|
| Rent | -10% $-10 | -5% $54 | +0% $119 | +5% $183 | +10% $248 |
| Rate | -1.0pp $162 | -0.5pp $140 | base $119 | +0.5pp $97 | +1.0pp $74 |
UW: 25.0% down · 7.5% · 30yr · 1.5% tax · 5.0% vac · 8.0% maint · 8.0% mgmt
Financing live
Cash to close
- Down payment
- $21,225
- Closing costs
- $2,547
- Reserves months
- —
- Total cash needed
- —
Loan-product check · same deal, 3 products live
Conventional
25% down · 7.5% · 30yr
- Down + closing
- —
- Monthly P&I
- —
- Monthly cashflow
- —
- DSCR
- —
- Eligible?
- —
Personal DTI + credit; lowest rate.
DSCR
20% down · 8.5% · 30yr
- Down + closing
- —
- Monthly P&I
- —
- Monthly cashflow
- —
- DSCR
- —
- Eligible?
- —
No personal income docs; deal must DSCR.
Hard money
10% down · 12.0% · 12mo
- Down + closing
- —
- Monthly P&I
- —
- Monthly cashflow
- —
- DSCR
- —
- Eligible?
- —
Short-term bridge; refi at stabilization.
Rent comps 40 comps
| Address | Beds | Baths | Sqft | Rent | $/sqft | DOM | Units | Dist |
|---|---|---|---|---|---|---|---|---|
| 111 Oakridge I #111 Deerfield Beach, FL | 1.0 | 1.5 | 706 | $1,595 | $2.26 | 26d | 1 | 0.02mi |
| 306 Newport T #306 Deerfield Beach, FL | 1.0 | 1.0 | 585 | $1,350 | $2.31 | 26d | 1 | 0.09mi |
| 436 Markham S #436 Deerfield Beach, FL | 1.0 | 1.0 | 585 | $1,400 | $2.39 | 26d | 1 | 0.12mi |
| 358 Markham Cres Unit 358 Deerfield Beach, FL | 1.0 | 1.5 | 700 | $1,500 | $2.14 | 26d | 1 | 0.15mi |
| 295 Newport Dr Unit 295 Deerfield Beach, FL | 1.0 | 1.0 | 595 | $1,450 | $2.44 | 26d | 1 | 0.16mi |
| 125 Newport I Unit I Deerfield Beach, FL | 1.0 | 1.5 | 700 | $1,600 | $2.29 | 26d | 1 | 0.19mi |
| 125 Newport I Unit I Deerfield Beach, FL | 1.0 | 1.5 | 700 | $1,600 | $2.29 | 0d | 1 | 0.19mi |
| 226 Newport O Deerfield Beach, FL | 1.0 | 1.5 | 700 | $1,700 | $2.43 | 26d | 1 | 0.20mi |
| 226 Newport O Deerfield Beach, FL | 1.0 | 1.5 | 700 | $1,600 | $2.29 | 4d | 1 | 0.20mi |
| 308 Markham N Deerfield Beach, FL | 1.0 | 1.5 | 700 | $1,200 | $1.71 | 26d | 1 | 0.21mi |
| 181 Newport Ct #181 Deerfield Beach, FL | 1.0 | 1.5 | 700 | $1,650 | $2.36 | 26d | 1 | 0.26mi |
| 170 Newport K Deerfield Beach, FL | 1.0 | 1.0 | 585 | $1,430 | $2.44 | 26d | 1 | 0.26mi |
| 27 Newport B Deerfield Beach, FL | 1.0 | 1.5 | 700 | $1,550 | $2.21 | 23d | 1 | 0.30mi |
| 25 Newport Ct Unit 25 Deerfield Beach, FL | 1.0 | 1.0 | 700 | $1,549 | $2.21 | 26d | 1 | 0.30mi |
| 4031 Harwood E Unit 4031 Deerfield Beach, FL | 1.0 | 1.5 | 738 | $1,700 | $2.30 | 0d | 1 | 0.30mi |
| 188 Prescott E Unit 188 Deerfield Beach, FL | 1.0 | 1.5 | 700 | $1,800 | $2.57 | 26d | 1 | 0.32mi |
| 20 Prescott E Unit 20 Deerfield Beach, FL | 1.0 | 1.5 | 700 | $1,600 | $2.29 | 26d | 1 | 0.34mi |
| 12 Prescott E Unit 12 Deerfield Beach, FL | 1.0 | 1.5 | 700 | $1,550 | $2.21 | 0d | 1 | 0.34mi |
| 111 Tilford F #111 Deerfield Beach, FL | 1.0 | 1.0 | 585 | $1,500 | $2.56 | 7d | 1 | 0.37mi |
| 111 Tilford F #111 Deerfield Beach, FL | 1.0 | 1.0 | 585 | $1,500 | $2.56 | 22d | 1 | 0.37mi |
| 181 Tilford I Unit I Deerfield Beach, FL | 1.0 | 1.5 | 700 | $1,350 | $1.93 | 26d | 1 | 0.38mi |
| 260 Prescott N Unit 260 Deerfield Beach, FL | 1.0 | 1.5 | 700 | $1,500 | $2.14 | 26d | 1 | 0.55mi |
| 137 Farnham F #137 Deerfield Beach, FL | 1.0 | 1.5 | 700 | $2,500 | $3.57 | 26d | 1 | 0.68mi |
| 137 Farnham F Deerfield Beach, FL | 1.0 | 1.5 | 708 | $2,000 | $2.82 | 26d | 1 | 0.69mi |
| 329 Farnham P #329 Deerfield Beach, FL | 1.0 | 1.5 | 700 | $1,450 | $2.07 | 26d | 1 | 0.77mi |
| 6 Ventnor a Deerfield Beach, FL | 1.0 | 1.0 | 600 | $1,429 | $2.38 | 26d | 1 | 0.80mi |
| 178 Durham E Unit 178 Deerfield Beach, FL | 1.0 | 1.0 | 593 | $1,350 | $2.28 | 12d | 1 | 0.81mi |
| 178 Durham E Unit 178 Deerfield Beach, FL | 1.0 | 1.0 | 593 | $1,350 | $2.28 | 4d | 1 | 0.81mi |
| 384 Durham Cir Unit 384 Deerfield Beach, FL | 1.0 | 1.0 | 593 | $1,400 | $2.36 | 26d | 1 | 0.83mi |
| 3016 Cambridge A Unit A Deerfield Beach, FL | 1.0 | 1.5 | 700 | $1,350 | $1.93 | 26d | 1 | 0.84mi |
| 41 Deer Creek Rd Unit G106 Deerfield Beach, FL | — | 1.0 | 550 | $1,850 | $3.36 | 26d | 1 | 0.89mi |
| 127 Westbury Cir Deerfield Beach, FL | 1.0 | 1.0 | 585 | $1,425 | $2.44 | 26d | 1 | 0.91mi |
| 98 Westbury E #98 Deerfield Beach, FL | 1.0 | 1.0 | 585 | $1,600 | $2.74 | 26d | 1 | 0.92mi |
| 98 Westbury E Unit E Deerfield Beach, FL | 1.0 | 1.0 | 585 | $1,600 | $2.74 | 0d | 1 | 0.92mi |
| 102 Westbury E #102 Deerfield Beach, FL | 1.0 | 1.0 | 585 | $1,900 | $3.25 | 9d | 1 | 0.92mi |
| 125 Westbury E Deerfield Beach, FL | 1.0 | 1.0 | 585 | $1,600 | $2.74 | 26d | 1 | 0.94mi |
| 149 Westbury I #149 Deerfield Beach, FL | 1.0 | 1.0 | 585 | $1,700 | $2.91 | 26d | 1 | 0.96mi |
| 731 Cypress Ln Unit D Pompano Beach, FL | 1.0 | 1.0 | 605 | $1,650 | $2.73 | 20d | 1 | 1.19mi |
| 660 Cypress Club Way Unit L11 Deerfield Beach, FL | 1.0 | 1.0 | 605 | $1,625 | $2.69 | 13d | 1 | 1.23mi |
| 4359 SW 10th Pl Deerfield Beach, FL | 1.0 | 1.0 | 718 | $1,913 | $2.66 | 23d | 1 | 1.31mi |
HOA detail condo
- Monthly dues
- $586 · $7,032/yr
- Likely covers
- pool
- Assessments
- None detected in remarks — confirm with the listing agent.
Listing history 15 events
-
2026-06-21days on market $84,900 Active 142 DOM
-
2026-06-18days on market $84,900 Active 139 DOM
-
2026-06-17days on market $84,900 Active 138 DOM
-
2026-06-16days on market $84,900 Active 137 DOM
-
2026-06-15days on market $84,900 Active 136 DOM
-
2026-06-13days on market $84,900 Active 134 DOM
-
2026-06-09days on market $84,900 Active 130 DOM
-
2026-06-07days on market $84,900 Active 128 DOM
-
2026-06-04days on market $84,900 Active 125 DOM
-
2026-06-03days on market $84,900 Active 124 DOM
-
2026-06-02days on market $84,900 Active 123 DOM
-
2026-06-01days on market $84,900 Active 122 DOM
-
2026-05-31days on market $84,900 Active 121 DOM
-
2026-01-31price $84,900
-
2026-01-30$89,900 Active
ⓘ Source: listings_history table (triggers on properties + properties_extension) + one-shot
backfill from property_details.listing_events for pre-trigger history.
Nearby sold comps map
Loading sold comps map…
Walkable amenities ~0.75 mi
Loading nearby amenities…
Taxation est. · year 1
- Rental income
- $19,618
- − Mortgage interest
- −$4,756
- − Property taxes
- −$1,274
- − Insurance
- −$424
- − Repairs & maintenance
- −$1,569
- − Management
- −$1,569
- − HOA
- −$7,032
- − Depreciation
- −$2,470
- Taxable income
- $523
- Est. tax owed @ 24.0%
- −$126
- After-tax cash flow
- $1,300/yr
For passive investors: Depreciation is non-cash, so a rental often shows a tax loss while cash-flowing — sheltering income. Rental losses are passive: they offset passive income freely, and up to $25,000/yr can offset ordinary (W-2) income if you actively participate and your MAGI is under $100k (phasing out to $0 by $150k); unused losses carry forward. On sale, claimed depreciation is recaptured at up to 25%, and gains may owe capital-gains tax (a 1031 exchange can defer both). Figures are a year-1 estimate at your 24.0% rate — not tax advice; consult a CPA.
Condition & rehab AI · 13 photos
This 2nd floor townhouse is in average condition with cosmetic updates needed, particularly in the kitchen and exterior paint. Updating these areas would significantly increase its resale and rental value.
Repairs flagged
- Minor paint — exterior walls show peeling
- Moderate kitchen cabinetry — dated and in need of updating
Value-add opportunities
- Both update kitchen cabinetry and countertops — modernizing the kitchen would appeal to both buyers and renters
- Both paint exterior walls — fresh paint would improve curb appeal and home value
Renovation cost estimate screening
| Repair item | Severity | Est. cost |
|---|---|---|
| paint · exterior walls show peeling | Minor | $500–3,000 |
| kitchen cabinetry · dated and in need of updating | Moderate | $3,000–15,000 |
| Total estimated repair cost · 2 items | $3,500–18,000 |
Value-add ROI direction
- Both update kitchen cabinetry and countertops — modernizing the kitchen would appeal to both buyers and renters ↑
- Both paint exterior walls — fresh paint would improve curb appeal and home value ↑
ⓘ Cost ranges are severity-bucket heuristics (US national rule-of-thumb). Get contractor quotes + a written scope before underwriting a rehab budget.
Schools (NCES district)
- District
- Broward
- NCES district ID
- 1200180
- Math proficiency
- 42% ▼ -18.00%
- Reading proficiency
- 53% ▼ -5.00%
- Median HH income
- $52,139
- Composite
- 40.88/100
- National rank
- #3621
- State rank
- #46 of 73 in FL
Livability — Deerfield Beach
- Score
- 75/100
- State rank
- #250
- US rank
- #3970
Category grades
Schools grade is shown separately in the Schools card above.
Census & demographics
- Census place
- Deerfield Beach, FL
- County
- Broward County · 1,963,430 people
- City population
- 61,449
- Metro
- Miami-Fort Lauderdale-Pompano Beach, FL
- Population (ZIP)
- 31,296
- Household income
- $53,254
- Rent vs Own
- Severe rent burden
- 2169.0
Population outlook (Broward County) Hauer SSP2
- Today (2025)
- 2,207,033 people
- By 2030
- 2,360,704 · +7.0%
- By 2040
- 2,661,208 · +20.6%
- By 2050
- 2,946,698 · +33.5%
- By 2075
- 3,602,273 · +63.2%
- By 2100
- 3,970,984 · +79.9%
Race, ethnicity, and origin ACS 2023
- Neighborhood character
- Diverse neighborhood (Simpson 0.61)
- Race & ethnicity
- White 57% Hispanic / Latino 23% Two or more races 19% Black 10% Asian 2%
- Hispanic origin (detail)
- Mexican 1% Puerto Rican 4% Cuban 3%
- Common ancestry
- Estonian 7% Romanian 4% Hispanic 3%
- Foreign-born
- 34% · Canada, Jamaica, Dominican Republic
- Languages at home
- 59% English-only · Spanish 20% Other Indo-European 13% French/Haitian/Cajun 4%
Political lean MEDSL · Broward
- 2024 margin
- D (+17.0) · D 58.0% · R 41.0%
- 2008→2024 swing
- -17.8pp toward R · 2008: 34.7pp · 2024: 17.0pp
- All cycles
- 2024: D+17.0 2020: D+29.8 2016: D+35.0 2012: D+34.9 2008: D+34.7
Not yet ingested
- Civics
- —
Market trends
- HPI YoY
- ▼ -280.44%
- Current HPI
- 323.0166
- Rent YoY
- ▲ 0.10%
- Metro
- Miami-Fort Lauderdale-Pompano Beach, FL
- State GDP YoY
- ▲ 3.28%
- F500 in state
- 36
Industry mix (Fortune 500 HQ in FL)
| Industry | F500 HQs | Revenue |
|---|---|---|
| Industrial Technology | 2 | $29B |
|
||
| Insurance | 2 | $17B |
|
||
| Retail | 1 | $60B |
|
||
| Technology Distribution | 1 | $58B |
|
||
| Homebuilding | 1 | $35B |
|
||
| Technology Manufacturing | 1 | $35B |
|
||
Price history
-5.6% since first listed2 events — show timeline
- 2026-01-31 Price Changed $84,900 Beaches MLS
- 2026-01-30 Listed $89,900 Beaches MLS
Cash-flow waterfall
monthlySold comps — $/sqft
last 12 mo · ≤1 miLoading sold comps…