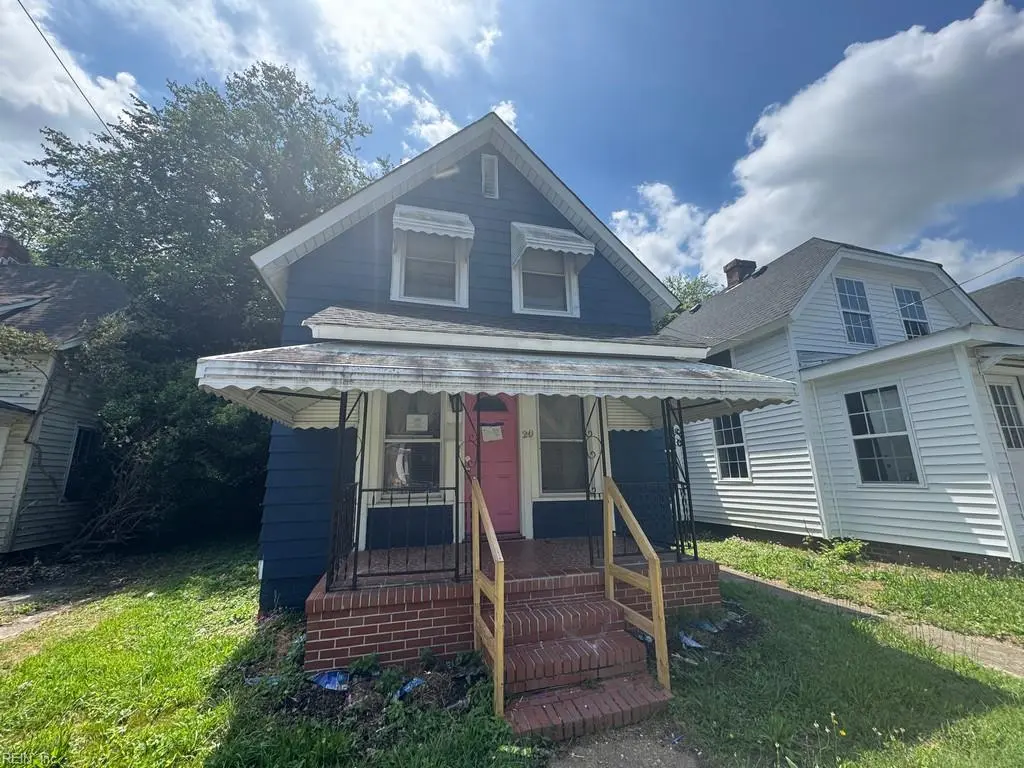
20 Dewey St · Portsmouth, VA
Flood risk 3/10 · Minor
- FEMA flood zone
- X (unshaded)
- Chance of flooding over 30 yrs
- 0.2%
- Est. flood insurance / yr
- $507 – $1,088
Fire risk 1/10 · Minimal
- Est. fire insurance / yr
- $666 – $1,236
Heat risk 9/10 · Severe
- Hot days now (above 106°F)
- 7 days/yr
- Hot days in 30 yrs
- 16 days/yr
Wind risk 8/10 · Major
- Chance of severe wind over 30 yrs
- 80.0%
Air-quality risk 5/10 · Moderate
- Unhealthy air days now
- 6 days/yr
- Unhealthy air days in 30 yrs
- 7 days/yr
Risk factors via First Street. Map © Google.
Why this score? — see what drove the B- grade
The composite is a weighted blend of 9 inputs, each scored 0–100. Each bar is that input's sub-score; the figure is the points it added to the 100-point composite (weight × sub-score).
- Cash flow +24.9/30.0
- ARV discount +15.0/15.0
- DSCR +8.1/10.0
- 1% rule +6.5/10.0
- Schools +3.9/10.0
- Livability +3.7/5.0
- Rent growth +3.3/5.0
- Condition / age +2.5/5.0
- Appreciation +0.0/10.0
$135,500
🖨 Deal sheet (PDF) 📄 Offer letter ✓ Due diligence
Listing remarks
Opportunity to bring your vision to this 1.5-story home featuring 3 bedrooms and 2 bathrooms. Offering plenty of potential, this property is ready for updates and personal touches to restore it to its full charm. Whether you're an owner-occupant looking to build equity or an investor seeking your next project, this home presents a great opportunity. Bring your ideas and make it your own! Conveniently located near the interstate and more! Call today for more information and to schedule your tour!
Key facts
- 3,049 sq ft lot
- Built 1919
- Listed 20 days
Property features AI
Finance
- HOA & community: No HOA fees
Exterior
- Utilities: City/County water; City/County sewer; Electric water heater
- Home design: Detached traditional-style home; 2 stories; Crawl space foundation; Simple ownership
- Construction: Asphalt shingle roof
- Exterior features: Back fenced yard; Has fence
Interior
- Bedrooms: Bedroom and full bathroom on the first floor; Total of 5 rooms (includes bedrooms and living spaces)
- Flooring: Carpet
- Bathrooms: 1 full bathroom; 1 half bathroom
- Heating & cooling: Forced hot air heating; Central air conditioning
- Interior features: Carpet flooring
Neighborhood map
What this means for you Summary
Snapshot
- This is a 3-bed/2.0-bath single-family listed at $136k.
Deal economics
- At list price, monthly cash flow is $290 ($3k/yr) — positive.
- The deal already cash-flows at list — no discount required.
- Meets the 1% rule at list price ($2k rent vs $136k).
- Recommended offer: $133k (1.5% below list) — sets the bar for market timing.
- Cap rate 8.9% vs local median 4.6% in Portsmouth — top-decile yield for the area; either an underpriced asset or a hidden risk that comps aren't pricing in. Stress-test before assuming the spread holds.
Location & tenants
- Location reads 73/100 on livability (#172 in VA) — a middle-class / working-renter tenant base. Strengths: amenities A+, cost of living A+, housing A+; Watch: employment C-, crime F, commute F.
- Portsmouth City Public School District (urban): math 34% / reading 58% proficiency, ranked #107 of 131 in VA (top 82%) — families likely to look elsewhere, expect single-tenant / working-renter base with shorter leases.
- Zoned schools: Douglass Park Elementary (math 12% / reading 37%, grade F, #1,051 of 1,108 statewide, top 96%, 550 students, 98% FRL); Cradock Middle (math 32% / reading 62%, grade D+, #257 of 342 statewide, top 77%, 533 students, 100% FRL); I.C. Norcom High (math 39% / reading 58%, grade D, #301 of 319 statewide, top 95%, 1,043 students, 100% FRL) — zoned schools average 99% FRL vs 60% district-wide (39 pts higher); higher-poverty schools than district average — tighter screening recommended.
- Market conditions: Rents rising (+3.3%/yr); 135 active listings in the ZIP; 25 comparable units currently listed for rent nearby; rentals at typical pace (median 25d on market — plan ~3-4 weeks tenant-placement turnaround); 300 units permitted in Portsmouth city in 2024 (112 in 5+ unit buildings).
- This rent runs 38% of the median local income ($50k/yr) — at the standard rent-burdened threshold; future hikes will face affordability resistance.
Forward outlook
- Local home prices are declining (-3.0%/yr); year-one equity from $937 of loan paydown is wiped out by about $4k of value loss. Plan a longer hold.
Negotiation context
- It's been on market 20 days — a 2% lower offer ($133k) is reasonable based on typical stale-listing flexibility.
- 4 sale attempts since 5y ago with the ask held roughly flat each time — persistent listings suggest the price (not the market) is what's stuck; bring a comps-based counter.
Risks & watch-outs
- Watch-outs: built in 1919 — expect roof / HVAC / electrical / plumbing capex.
- Climate carrying-cost: severe wind risk, 80% chance of damaging wind over 30y; extreme-heat days projected 7→16/yr by 2055 (HVAC capex compounding) — expect insurance premiums to compound above CPI over the hold.
Questions for the listing agent
- Built in 1919 — when were the roof, HVAC, electrical panel, plumbing, and water heater last replaced?
- Is there a deadline driving the sale (1031 exchange, divorce, estate, relocation)? That informs how much negotiation room exists.
- Schools are B-rated — typically a magnet for longer-tenancy family renters. What's the average tenant stay here, and is there a school-zone premium baked into asking?
- Crime grade is F in this area — have there been break-ins, vandalism, or insurance claims at this property in the last 3 years? What carrier currently insures it and at what premium?
- What's the average days-on-market for RENTAL listings here right now (not sales)? A rising rental-DOM trend means longer vacancies and softer asking-rent achievability than the comps imply.
- What's the recent tenant-quality profile in this submarket — average credit score on applications, eviction rate, late-payment / NSF rate, and stable-employment percentage? A property-management company in the area should have these aggregated.
- How much new for-sale + rental construction is in the pipeline within 1–3 miles? Heavy new supply typically softens prices + rents 12–24 months out; constrained supply supports both.
Investment metrics
- 1% rule
- 1.15% ✓
- Cap rate
- 8.86%
- Cash-on-cash
- 9.16%
- DSCR
- 1.41
- GRM
- 7.2
CMA / ARV
- ARV (on-the-fly)
- $205,184
- Comps found
- 12
Show comp detail 12 sales within ~0.75 mi
| Address | Dist | Beds/Ba | Sqft | Sold | Price | $/sf | Match |
|---|---|---|---|---|---|---|---|
| 2600 Roanoke Ave | 0.40mi | 3/1.0 | 900 (+0%) | 2mo | $107,000 | $119 | 75 |
| 321 Beacon Rd | 0.44mi | 3/1.0 | 864 (-4%) | 1mo | $155,000 | $179 | 68 |
| 113 Baldwin Ave | 0.30mi | 2/1.5 (-1) | 973 (+9%) | 4mo | $95,000 | $98 | 62 |
| 521 Beacon Rd | 0.62mi | 3/1.0 | 864 (-4%) | 1mo | $135,000 | $156 | 60 |
| 312 Killian Ave | 0.42mi | 3/1.0 | 992 (+11%) | 2mo | $255,000 | $257 | 57 |
| 222 Charles Ave | 0.48mi | 2/1.0 (-1) | 822 (-8%) | 0mo | $219,900 | $268 | 54 |
| 1536 Centre Ave | 0.62mi | 3/1.5 | 975 (+9%) | 1mo | $110,000 | $113 | 54 |
| 117 Edison Ave | 0.36mi | 2/1.0 (-1) | 1,000 (+12%) | 2mo | $227,500 | $228 | 53 |
| 1921 Nashville Ave | 0.48mi | 2/1.0 (-1) | 800 (-11%) | 1mo | $194,000 | $243 | 50 |
| 109 Woodstock St | 0.72mi | 3/1.0 | 960 (+7%) | 3mo | $220,000 | $229 | 48 |
| 9 Shelby St | 0.60mi | 3/2.0 | 1,028 (+15%) | 2mo | $239,000 | $232 | 46 |
| 2200 Deep Creek Blvd | 0.46mi | 2/1.0 (-1) | 768 (-14%) | 1mo | $200,000 | $260 | 45 |
Match score weights: distance 35% · size 25% · config 20% · recency 20%. Top-matched comps best support the ARV.
Projected returns pro-forma
-3.0% appreciation · 3.31% rent growth · sell at horizon
- IRR
- -2.1%
- Equity multiple
- 0.92×
- Total profit
- $-2,986
- Equity at exit
- $20,203
- IRR
- 8.0%
- Equity multiple
- 1.61×
- Total profit
- $23,301
- Equity at exit
- $11,716
Cash invested: $37,940 (down + closing). Projections, not guarantees.
Landlord ↔ Tenant lean methodology
- Overall (STATE)
- 55 Moderately Landlord-Leaning
- State Virginia
- 55 Moderately Landlord-Leaning · D+2
- County
- — inherits STATE
- City
- — inherits STATE
ZIP-level market 23704
- Home prices YoY
- -4.6%
- Rents YoY
- 3.3%
- Active inventory
- 135
- Price-to-rent
- 7.2×
Monthly cashflow live
- Estimated rent
- $1,564 high interval (Pro) →
- Mortgage (P&I)
- −$711
- Tax from tax record
- −$179 /mo · $2,147/yr
- Insurance
- −$56
- HOA
- −$0
- Vacancy / Maint / Mgmt
- −$328
- Net cashflow
- $290
Break-even live
Sensitivity live
| Price | -10% $366 | -5% $328 | +0% $290 | +5% $251 | +10% $213 |
|---|---|---|---|---|---|
| Rent | -10% $166 | -5% $228 | +0% $290 | +5% $352 | +10% $413 |
| Rate | -1.0pp $358 | -0.5pp $324 | base $290 | +0.5pp $255 | +1.0pp $219 |
UW: 25.0% down · 7.5% · 30yr · 1.5% tax · 5.0% vac · 8.0% maint · 8.0% mgmt
Financing live
Cash to close
- Down payment
- $33,875
- Closing costs
- $4,065
- Reserves months
- —
- Total cash needed
- —
Loan-product check · same deal, 3 products live
Conventional
25% down · 7.5% · 30yr
- Down + closing
- —
- Monthly P&I
- —
- Monthly cashflow
- —
- DSCR
- —
- Eligible?
- —
Personal DTI + credit; lowest rate.
DSCR
20% down · 8.5% · 30yr
- Down + closing
- —
- Monthly P&I
- —
- Monthly cashflow
- —
- DSCR
- —
- Eligible?
- —
No personal income docs; deal must DSCR.
Hard money
10% down · 12.0% · 12mo
- Down + closing
- —
- Monthly P&I
- —
- Monthly cashflow
- —
- DSCR
- —
- Eligible?
- —
Short-term bridge; refi at stabilization.
Rent comps 25 comps
| Address | Beds | Baths | Sqft | Rent | $/sqft | DOM | Units | Dist |
|---|---|---|---|---|---|---|---|---|
| 3304 Killian Ave Portsmouth, VA | 3.0 | 1.0 | 800 | $2,000 | $2.50 | 25d | 1 | 0.27mi |
| 70 Manly St Portsmouth, VA | 2.0 | 1.0 | 1000 | $1,350 | $1.35 | 45d | 1 | 0.27mi |
| 2810 Roanoke Ave Portsmouth, VA | 3.0 | 1.5 | 1100 | $2,100 | $1.91 | 45d | 1 | 0.41mi |
| 231 Edison Ave Unit 231 Portsmouth, VA | 2.0 | 1.5 | 1050 | $1,275 | $1.21 | 12d | 1 | 0.45mi |
| 231 Edison Ave Portsmouth, VA | 2.0 | 1.5 | 1100 | $1,275 | $1.16 | 21d | 1 | 0.45mi |
| 1 Shelby St Portsmouth, VA | 2.0 | 1.0 | 700 | $1,250 | $1.79 | 25d | 1 | 0.55mi |
| 3724 Deep Creek Blvd Unit 3728 Portsmouth, VA | 2.0 | 1.0 | 900 | $995 | $1.11 | 25d | 1 | 0.56mi |
| 3724 Deep Creek Blvd Unit 3754 Portsmouth, VA | 2.0 | 1.0 | 900 | $995 | $1.11 | 14d | 1 | 0.56mi |
| 11 Carver Cir Portsmouth, VA | 2.0 | 1.0 | 695 | $1,395 | $2.01 | 45d | 1 | 0.56mi |
| 21 DeKalb Ave Portsmouth, VA | 2.0 | 1.0 | 984 | $1,550 | $1.58 | 45d | 1 | 0.64mi |
| 49 Carver Cir Portsmouth, VA | 2.0 | 2.0 | 800 | $1,450 | $1.81 | 25d | 1 | 0.69mi |
| 1915 Des Moines Ave Portsmouth, VA | 3.0 | 1.0 | 1070 | $1,700 | $1.59 | 25d | 1 | 0.70mi |
| 1915 Des Moines Ave Portsmouth, VA | 3.0 | 1.0 | 1070 | $1,700 | $1.59 | 17d | 1 | 0.70mi |
| 1915 Lansing Ave Portsmouth, VA | 3.0 | 1.0 | 1085 | $1,675 | $1.54 | 5d | 1 | 0.74mi |
| 1416 Richmond Ave Portsmouth, VA | 2.0 | 1.0 | 1024 | $1,150 | $1.12 | 45d | 1 | 0.98mi |
| 2007 Elm Ave Portsmouth, VA | 3.0 | 1.0 | 903 | $1,300 | $1.44 | 21d | 1 | 1.01mi |
| 2756 Peach St Portsmouth, VA | 2.0 | 1.5 | 1040 | $1,495 | $1.44 | 25d | 1 | 1.09mi |
| 2906 Chestnut St Unit 1328007P Portsmouth, VA | 2.0 | 1.0 | 947 | $4,650 | $4.91 | 9d | 1 | 1.19mi |
| 923 Randolph St Portsmouth, VA | 2.0 | 1.0 | 800 | $1,062 | $1.33 | 45d | 1 | 1.28mi |
| 3626 Bart St Unit BAR3626-DF Portsmouth, VA | 2.0 | 1.0 | 900 | $1,000 | $1.11 | 9d | 1 | 1.32mi |
| 3310 Glasgow St Portsmouth, VA | 2.0 | 1.0 | 1100 | $1,600 | $1.45 | 5d | 1 | 1.45mi |
| 98 Francis St Portsmouth, VA | 2.0 | 2.0 | 984 | $1,395 | $1.42 | 16d | 1 | 1.45mi |
| 102 Francis St #98 Portsmouth, VA | 2.0 | 1.5 | 1000 | $1,395 | $1.40 | 17d | 1 | 1.45mi |
| 18 Cooper Dr Portsmouth, VA | 2.0 | 1.0 | 920 | $1,400 | $1.52 | 18d | 1 | 1.49mi |
| 811 Randolph St Unit A Portsmouth, VA | 2.0 | 1.0 | 800 | $1,150 | $1.44 | 45d | 1 | 1.50mi |
Listing history 12 events
-
2026-06-21days on market $135,500 Active 20 DOM
-
2026-06-18days on market $135,500 Active 17 DOM
-
2026-06-17days on market $135,500 Active 16 DOM
-
2026-06-16days on market $135,500 Active 15 DOM
-
2026-06-15days on market $135,500 Active 14 DOM
-
2026-06-13days on market $135,500 Active 12 DOM
-
2026-06-09days on market $135,500 Active 8 DOM
-
2026-06-08days on market $135,500 Active 7 DOM
-
2026-06-07days on market $135,500 Active 6 DOM
-
2026-06-03days on market $135,500 Active 2 DOM
-
2026-06-02remarks 500-char remark
-
2026-06-02$135,500 Active 1 DOM
ⓘ Source: listings_history table (triggers on properties + properties_extension) + one-shot
backfill from property_details.listing_events for pre-trigger history.
Tax reassessment forecast VA · Resets to sale price
- Current annual tax
- $2,147 · $179/mo
- Projected year-2 tax
- $2,147 · $179/mo
- Expected delta
- $0/yr ($0/mo · 0.0%)
ⓘ Screening estimate from a state-policy table — verify with the county assessor before closing.
Climate risk First Street
- Flood 3/10 Moderate FEMA zone X (unshaded) · 20% chance over 30 yrs
- Wildfire 1/10 Low
- Heat 9/10 Extreme 7 d/yr ≥106°F today · 16 d/yr by 30 yrs out
- Wind 8/10 Severe 80% chance of damaging wind over 30 yrs
- Air quality 5/10 Major 6 unhealthy d/yr today · 7 by 30 yrs out
Nearby sold comps map
Loading sold comps map…
Walkable amenities ~0.75 mi
Loading nearby amenities…
Taxation est. · year 1
- Rental income
- $18,769
- − Mortgage interest
- −$7,590
- − Property taxes
- −$2,147
- − Insurance
- −$678
- − Repairs & maintenance
- −$1,502
- − Management
- −$1,502
- − Depreciation
- −$3,942
- Taxable income
- $1,410
- Est. tax owed @ 24.0%
- −$338
- After-tax cash flow
- $3,138/yr
For passive investors: Depreciation is non-cash, so a rental often shows a tax loss while cash-flowing — sheltering income. Rental losses are passive: they offset passive income freely, and up to $25,000/yr can offset ordinary (W-2) income if you actively participate and your MAGI is under $100k (phasing out to $0 by $150k); unused losses carry forward. On sale, claimed depreciation is recaptured at up to 25%, and gains may owe capital-gains tax (a 1031 exchange can defer both). Figures are a year-1 estimate at your 24.0% rate — not tax advice; consult a CPA.
Schools (NCES district)
- District
- Portsmouth City Public School District
- NCES district ID
- 5103000
- Math proficiency
- 34% ▼ -40.00%
- Reading proficiency
- 58% ▼ -12.00%
- Median HH income
- $46,152
- Composite
- 39.01/100
- National rank
- #4071
- State rank
- #107 of 131 in VA
Livability — Portsmouth
- Score
- 73/100
- State rank
- #172
- US rank
- #5381
Category grades
Schools grade is shown separately in the Schools card above.
Census & demographics
- Census place
- Portsmouth, VA
- County
- Portsmouth City · 96,366 people
- City population
- 96,366
- Metro
- Virginia Beach-Norfolk-Newport News, VA-NC
- Population (ZIP)
- 19,207
- Household income
- $49,583
- Rent vs Own
- Severe rent burden
- 1727.0
Population outlook (Portsmouth County) Hauer SSP2
- Today (2025)
- 96,730 people
- By 2030
- 96,760 · +0.0%
- By 2040
- 96,573 · -0.2%
- By 2050
- 95,606 · -1.2%
- By 2075
- 93,579 · -3.3%
- By 2100
- 83,756 · -13.4%
Race, ethnicity, and origin ACS 2023
- Neighborhood character
- Predominantly Black (66%)
- Race & ethnicity
- Black 66% White 24% Two or more races 6% Hispanic / Latino 4% Asian 2%
- Common ancestry
- Slovak 1% Romanian 1% Lithuanian 1%
- Foreign-born
- 2% · Canada
- Languages at home
- 96% English-only · Spanish 2%
Political lean MEDSL · Portsmouth
- 2024 margin
- Solid D (+38.6) · D 68.6% · R 30.0% · Other 1.4%
- 2008→2024 swing
- -0.7pp no change · 2008: 39.3pp · 2024: 38.6pp
- All cycles
- 2024: D+38.6 2020: D+40.8 2016: D+36.5 2012: D+39.6 2008: D+39.3
Not yet ingested
- Civics
- —
Market trends
- HPI YoY
- ▼ -15.69%
- Current HPI
- 322.7335
- Rent YoY
- ▲ 3.31%
- Metro
- Virginia Beach-Norfolk-Newport News, VA-NC
- State GDP YoY
- ▲ 2.40%
- F500 in state
- 50
Industry mix (Fortune 500 HQ in VA)
| Industry | F500 HQs | Revenue |
|---|---|---|
| Aerospace / Defense | 4 | $236B |
|
||
| Technology / Defense | 3 | $32B |
|
||
| Financial Services | 2 | $176B |
|
||
| Utilities | 2 | $27B |
|
||
| Insurance | 2 | $25B |
|
||
| Technology | 2 | $15B |
|
||
Price history
-1.1% since first listed10 events — show timeline
- 2026-06-01 Listed $135,500 REINMLS
- 2025-11-25 Listing Removed — REINMLS
- 2025-10-29 Relisted — REINMLS
- 2025-07-03 Contingent — REINMLS
- 2025-07-02 Listed $100,000 REINMLS
- 2021-05-26 Sold (Public Records) $135,000 Public Records
- 2021-05-06 Contingent — REINMLS
- 2021-04-15 Price Changed $133,900 REINMLS
- 2021-03-17 Price Changed $134,000 REINMLS
- 2021-03-12 Listed $137,000 REINMLS
Property tax history
+11.7%/yrLatest (2025): $2,147 · +1.9% YoY. Source: county tax records.
Cash-flow waterfall
monthlySold comps — $/sqft
last 12 mo · ≤1 miLoading sold comps…