208 Carillo Dr · Columbia, SC
Flood risk No data
- FEMA flood zone
- —
- Chance of flooding over 30 yrs
- —
- Est. flood insurance / yr
- —
Fire risk No data
- Est. fire insurance / yr
- —
Heat risk No data
- Hot days now (above threshold)
- —
- Hot days in 30 yrs
- —
Wind risk No data
- Chance of severe wind over 30 yrs
- —
Air-quality risk No data
- Unhealthy air days now
- —
- Unhealthy air days in 30 yrs
- —
Risk factors via First Street. Map © Google.
Why this score? — see what drove the D- grade
The composite is a weighted blend of 9 inputs, each scored 0–100. Each bar is that input's sub-score; the figure is the points it added to the 100-point composite (weight × sub-score).
- Cash flow +11.7/30.0
- ARV discount +7.5/15.0
- Livability +3.9/5.0
- 1% rule +3.8/10.0
- Schools +3.6/10.0
- DSCR +3.4/10.0
- Rent growth +2.6/5.0
- Condition / age +2.5/5.0
- Appreciation +0.0/10.0
$214,990
🖨 Deal sheet (PDF) 📄 Offer letter ✓ Due diligence
Listing remarks
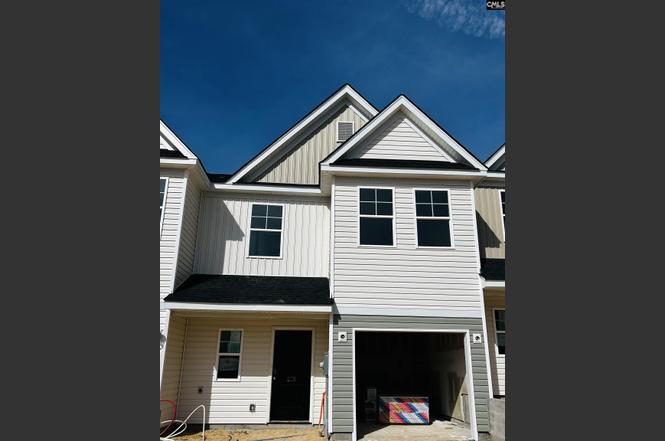
Move in Ready, so call and ask about our “Quick Move In Special” today! Discover the epitome of contemporary living in this exquisite 3-bedroom, 2.5-bathroom townhome in a brand new subdivision: Percival Village in Columbia, SC. Nestled in a prime location, these homes provide a perfect blend of style, convenience, and accessibility. The open concept main floor is spacious and built for entertaining; with a perfectly appointed kitchen featuring white cabinets, stainless appliances, and beautiful quartz countertops. You will appreciate the ease of low-maintenance, energy efficient living, with HE appliances, dual programmable thermostats, low E windows, a tankless hot water heate
Key facts
- Private patio
- $70 HOA
- Garage
Tags
Property features AI
Finance
- Other: Home comes with 12-month home warranty and new construction builder warranty; Directions: From Percival Road turn onto Alpine Road. At the roundabout take first right onto Old Percival Road. Percival Village is on the left.
- HOA & community: Homeowners association with common area maintenance, front yard maintenance and landscaping included; Sidewalk community
Exterior
- Parking: Attached garage (main level); Two parking spaces total, including one garage space
- Utilities: Public sewer; Thermopane windows; Energy Star construction
- Home design: Two-story home
- Construction: Vinyl exterior; Slab foundation
- Exterior features: Patio; Rear vinyl fencing; Paved road access; Public water
Interior
- Kitchen: Eat-in kitchen with island and pantry; Painted cabinets; Quartz countertops; Recessed lighting
- Bedrooms: Master bedroom on second floor with double vanity, private bath, separate shower, separate water closet, walk-in closet, and carpet and luxury vinyl plank flooring; Second bedroom on second floor with shared bath, high ceilings and private closet; Third bedroom on second floor with shared bath, high ceilings and private closet
- Flooring: Luxury vinyl plank and carpet
- Bathrooms: Two full baths and one half bath
- Heating & cooling: Central cooling; Gas pack heating with zoned system
- Interior features: Attic with pull-down access; High ceilings; Recessed lighting; Tankless water heater
- Laundry & utility: Laundry closet in heated space (washer/dryer area on second floor); Disposal
Neighborhood map
What this means for you Summary
Snapshot
- This is a 3-bed/2.5-bath townhouse listed at $215k.
Deal economics
- At list price, monthly cash flow is $-62 ($-749/yr) — negative.
- To cash-flow at today's rent, offer at most $206k (4.2% below list).
- To meet the 1% rule (rent ≥ 1% of price), the offer needs to be $189k (12.1% below list).
- Recommended offer: $189k (12.1% below list) — sets the bar for 1% rule.
Location & tenants
- Location reads 78/100 on livability (#18 in SC, #2,436 nationally) — a middle-class / working-renter tenant base. Strengths: amenities A+, commute A+, cost of living A+; Watch: employment D, crime F.
- Richland 02 (suburban): math 35% / reading 47% proficiency, ranked #29 of 80 in SC (top 36%) — families likely to look elsewhere, expect single-tenant / working-renter base with shorter leases.
- Zoned schools: Windsor Elementary (math 21% / reading 23%, grade F, #475 of 597 statewide, top 81%, 537 students, 100% FRL) — zoned schools average 100% FRL vs 38% district-wide (62 pts higher); higher-poverty schools than district average — tighter screening recommended.
- Zoned-school proficiency averages 22% at this address vs 41% district-wide (-19 pts) — the specific schools serving this property underperform the Richland 02 average; the district grade overstates school quality for this exact location.
- Market conditions: Rents flat; 341 active listings in the ZIP; 7 comparable units currently listed for rent nearby; rentals at typical pace (median 24d on market — plan ~3-4 weeks tenant-placement turnaround); 3,472 units permitted in Richland County in 2024 (1,096 in 5+ unit buildings).
- This rent runs 36% of the median local income ($62k/yr) — at the standard rent-burdened threshold; future hikes will face affordability resistance.
Forward outlook
- Local home prices are declining (-3.0%/yr); year-one equity from $1k of loan paydown is wiped out by about $6k of value loss. Plan a longer hold.
- Richland County population projected at +30% by 2050 — long-run rental-demand tailwind backs the buy-and-hold thesis.
Negotiation context
- It's been on market 141 days — a 12% lower offer ($189k) is reasonable based on typical stale-listing flexibility.
Questions for the listing agent
- What do current leases actually rent for vs. the listed asking? Can we see a recent rent roll and the last 12 months of T-12 income?
- It's been on market 141 days. Have you received any prior offers? Is the seller open to a 12% concession, seller financing, or rate buy-down credit?
- What does the HOA fee cover, when was the last increase, and are there any pending special assessments or reserve-fund shortfalls?
- Why hasn't it sold? Are there any deal-killer items the seller is aware of (foundation, flood, title, zoning, code violations)?
- Is there a deadline driving the sale (1031 exchange, divorce, estate, relocation)? That informs how much negotiation room exists.
- Schools are D-rated, which usually means shorter tenancies and higher turnover. Who's the typical renter profile here, and what's been the actual vacancy rate?
- Crime grade is F in this area — have there been break-ins, vandalism, or insurance claims at this property in the last 3 years? What carrier currently insures it and at what premium?
- The area grade is low — what's the realistic commute time and amenity access for the typical tenant pool here? Any planned neighborhood developments (good or bad) we should know about?
- What's the average days-on-market for RENTAL listings here right now (not sales)? A rising rental-DOM trend means longer vacancies and softer asking-rent achievability than the comps imply.
- What's the recent tenant-quality profile in this submarket — average credit score on applications, eviction rate, late-payment / NSF rate, and stable-employment percentage? A property-management company in the area should have these aggregated.
- How much new for-sale + rental construction is in the pipeline within 1–3 miles? Heavy new supply typically softens prices + rents 12–24 months out; constrained supply supports both.
Investment metrics
- 1% rule
- 0.88% ✗
- Cap rate
- 5.94%
- Cash-on-cash
- -1.24%
- DSCR
- 0.94
- GRM
- 9.5
CMA / ARV
No comps found within radius.
Projected returns pro-forma
-3.0% appreciation · 0.21% rent growth · sell at horizon
- IRR
- -21.6%
- Equity multiple
- 0.27×
- Total profit
- $-43,904
- Equity at exit
- $32,056
- IRR
- -24.5%
- Equity multiple
- -0.05×
- Total profit
- $-63,093
- Equity at exit
- $18,588
Cash invested: $60,197 (down + closing). Projections, not guarantees.
Landlord ↔ Tenant lean methodology
- Overall (STATE)
- 90 Strongly Landlord-Friendly
- State South Carolina
- 90 Strongly Landlord-Friendly · R+6
- County
- — inherits STATE
- City
- — inherits STATE
ZIP-level market 29223
- Rents YoY
- 0.2%
- Active inventory
- 341
- Price-to-rent
- 9.5×
Monthly cashflow live
- Estimated rent
- $1,890 high interval (Pro) →
- Mortgage (P&I)
- −$1,127
- Tax est. 1.5%
- −$269 /mo · $3,225/yr
- Insurance
- −$90
- HOA
- −$70
- Vacancy / Maint / Mgmt
- −$397
- Net cashflow
- $-62
Break-even live
Sensitivity live
| Price | -10% $86 | -5% $12 | +0% $-62 | +5% $-137 | +10% $-211 |
|---|---|---|---|---|---|
| Rent | -10% $-212 | -5% $-137 | +0% $-62 | +5% $12 | +10% $87 |
| Rate | -1.0pp $46 | -0.5pp $-8 | base $-62 | +0.5pp $-118 | +1.0pp $-175 |
UW: 25.0% down · 7.5% · 30yr · 1.5% tax · 5.0% vac · 8.0% maint · 8.0% mgmt
Financing live
Cash to close
- Down payment
- $53,748
- Closing costs
- $6,450
- Reserves months
- —
- Total cash needed
- —
Loan-product check · same deal, 3 products live
Conventional
25% down · 7.5% · 30yr
- Down + closing
- —
- Monthly P&I
- —
- Monthly cashflow
- —
- DSCR
- —
- Eligible?
- —
Personal DTI + credit; lowest rate.
DSCR
20% down · 8.5% · 30yr
- Down + closing
- —
- Monthly P&I
- —
- Monthly cashflow
- —
- DSCR
- —
- Eligible?
- —
No personal income docs; deal must DSCR.
Hard money
10% down · 12.0% · 12mo
- Down + closing
- —
- Monthly P&I
- —
- Monthly cashflow
- —
- DSCR
- —
- Eligible?
- —
Short-term bridge; refi at stabilization.
Rent comps 7 comps
| Address | Beds | Baths | Sqft | Rent | $/sqft | DOM | Units | Dist |
|---|---|---|---|---|---|---|---|---|
| 1270 Polo Rd Columbia, SC | 1.0–3.0 | 1.0–2.0 | 1167 | $1,841 | $1.58 | 4d | 41 | 0.39mi |
| 1725 Cheltenham Ln Columbia, SC | 3.0 | 2.0 | 1444 | $1,675 | $1.16 | 24d | 1 | 0.92mi |
| 119 Manzanita Ln Columbia, SC | 4.0 | 2.5 | 2200 | $2,450 | $1.11 | 11d | 1 | 1.29mi |
| 232 Allans Mill Dr Columbia, SC | 4.0 | 2.5 | 1696 | $2,100 | $1.24 | 24d | 1 | 1.31mi |
| 8720 Windsor Lake Blvd Columbia, SC | 1.0–3.0 | 1.0–2.0 | 967 | $1,415 | $1.46 | 24d | 15 | 1.33mi |
| 811 Mallet Hill Rd Columbia, SC | 1.0–3.0 | 1.0–2.0 | 1137 | $2,041 | $1.80 | 3d | 18 | 1.39mi |
| 117 Greenfield Rd Columbia, SC | 3.0 | 2.0 | 2055 | $1,981 | $0.96 | 24d | 1 | 1.44mi |
HOA detail
- Monthly dues
- $70 · $840/yr
- Likely covers
- water
Listing history 18 events
-
2026-06-18days on market $214,990 Active 141 DOM
-
2026-06-17days on market $214,990 Active 140 DOM
-
2026-06-16days on market $214,990 Active 139 DOM
-
2026-06-15days on market $214,990 Active 138 DOM
-
2026-06-14days on market $214,990 Active 136 DOM
-
2026-06-13days on market $214,990 Active 135 DOM
-
2026-06-10days on market $214,990 Active 133 DOM
-
2026-06-09days on market $214,990 Active 132 DOM
-
2026-06-08days on market $214,990 Active 131 DOM
-
2026-06-07days on market $214,990 Active 130 DOM
-
2026-06-05days on market $214,990 Active 127 DOM
-
2026-06-03days on market $214,990 Active 126 DOM
-
2026-06-03days on market $214,990 Active 125 DOM
-
2026-06-01days on market $214,990 Active 124 DOM
-
2026-05-31days on market $214,990 Active 123 DOM
-
2026-05-08price $214,990
-
2026-04-16price $221,990
-
2026-01-28$225,990 Active
ⓘ Source: listings_history table (triggers on properties + properties_extension) + one-shot
backfill from property_details.listing_events for pre-trigger history.
Nearby sold comps map
Loading sold comps map…
Walkable amenities ~0.75 mi
Loading nearby amenities…
Taxation est. · year 1
- Rental income
- $22,684
- − Mortgage interest
- −$12,043
- − Property taxes
- −$3,225
- − Insurance
- −$1,075
- − Repairs & maintenance
- −$1,815
- − Management
- −$1,815
- − HOA
- −$840
- − Depreciation
- −$6,254
- Taxable loss
- −$4,383
- Est. tax savings @ 24.0%
- +$1,052
- After-tax cash flow
- $303/yr
For passive investors: Depreciation is non-cash, so a rental often shows a tax loss while cash-flowing — sheltering income. Rental losses are passive: they offset passive income freely, and up to $25,000/yr can offset ordinary (W-2) income if you actively participate and your MAGI is under $100k (phasing out to $0 by $150k); unused losses carry forward. On sale, claimed depreciation is recaptured at up to 25%, and gains may owe capital-gains tax (a 1031 exchange can defer both). Figures are a year-1 estimate at your 24.0% rate — not tax advice; consult a CPA.
Schools (NCES district)
- District
- Richland 02
- NCES district ID
- 4503390
- Math proficiency
- 35% ▼ -15.00%
- Reading proficiency
- 47% ▼ -5.00%
- Median HH income
- $59,684
- Composite
- 36.2/100
- National rank
- #4730
- State rank
- #29 of 80 in SC
Livability — Columbia
- Score
- 78/100
- State rank
- #18
- US rank
- #2436
Category grades
Schools grade is shown separately in the Schools card above.
Census & demographics
- Census place
- Columbia, SC
- County
- Richland County · 389,530 people
- City population
- 335,994
- Metro
- Columbia, SC
- Population (ZIP)
- 53,074
- Household income
- $62,408
- Rent vs Own
- Severe rent burden
- 2857.0
Population outlook (Richland County) Hauer SSP2
- Today (2025)
- 459,667 people
- By 2030
- 487,524 · +6.1%
- By 2040
- 542,035 · +17.9%
- By 2050
- 595,371 · +29.5%
- By 2075
- 732,998 · +59.5%
- By 2100
- 820,415 · +78.5%
Race, ethnicity, and origin ACS 2023
- Neighborhood character
- Diverse neighborhood (Simpson 0.60)
- Race & ethnicity
- Black 57% White 23% Hispanic / Latino 11% Two or more races 6% Asian 4%
- Hispanic origin (detail)
- Mexican 5% Puerto Rican 2%
- Common ancestry
- Slovak 1% Serbian 1% Italian 1%
- Foreign-born
- 10% · Canada, South Korea
- Languages at home
- 86% English-only · Spanish 8% Other Indo-European 2% Korean 1%
Political lean MEDSL · Richland
- 2024 margin
- Solid D (+34.6) · D 66.4% · R 31.8% · Other 1.8%
- 2008→2024 swing
- +5.7pp toward D · 2008: 28.9pp · 2024: 34.6pp
- All cycles
- 2024: D+34.6 2020: D+38.3 2016: D+32.9 2012: D+33.3 2008: D+28.9
Not yet ingested
- Civics
- —
Market trends
- HPI YoY
- ▼ -135.96%
- Current HPI
- 195.3158
- Rent YoY
- ▲ 0.21%
- Metro
- Columbia, SC
- State GDP YoY
- ▲ 4.51%
- F500 in state
- 2
Industry mix (Fortune 500 HQ in SC)
| Industry | F500 HQs | Revenue |
|---|---|---|
| Packaging | 1 | $7B |
|
||
Price history
-4.9% since first listed3 events — show timeline
- 2026-05-08 Price Changed $214,990 Consolidated MLS
- 2026-04-16 Price Changed $221,990 Consolidated MLS
- 2026-01-28 Listed $225,990 Consolidated MLS
Cash-flow waterfall
monthlySold comps — $/sqft
last 12 mo · ≤1 miLoading sold comps…