7410 72nd Ln N · Brooklyn Park, MN
Flood risk 1/10 · Minimal
- FEMA flood zone
- X (unshaded)
- Chance of flooding over 30 yrs
- 0.0%
- Est. flood insurance / yr
- $473 – $860
Fire risk 1/10 · Minimal
- Est. fire insurance / yr
- $888 – $1,650
Heat risk 2/10 · Minimal
- Hot days now (above 99°F)
- 7 days/yr
- Hot days in 30 yrs
- 14 days/yr
Wind risk 2/10 · Minimal
- Chance of severe wind over 30 yrs
- —
Air-quality risk 2/10 · Minimal
- Unhealthy air days now
- 1 days/yr
- Unhealthy air days in 30 yrs
- 2 days/yr
Risk factors via First Street. Map © Google.
Why this score? — see what drove the D grade
The composite is a weighted blend of 9 inputs, each scored 0–100. Each bar is that input's sub-score; the figure is the points it added to the 100-point composite (weight × sub-score).
- Cash flow +10.1/30.0
- 1% rule +10.0/10.0
- ARV discount +7.5/15.0
- Schools +4.2/10.0
- Livability +4.0/5.0
- Rent growth +3.1/5.0
- DSCR +2.9/10.0
- Condition / age +2.5/5.0
- Appreciation +0.0/10.0
$79,000
🖨 Deal sheet 📄 Offer letter ✓ Due diligence
Listing remarks MLS
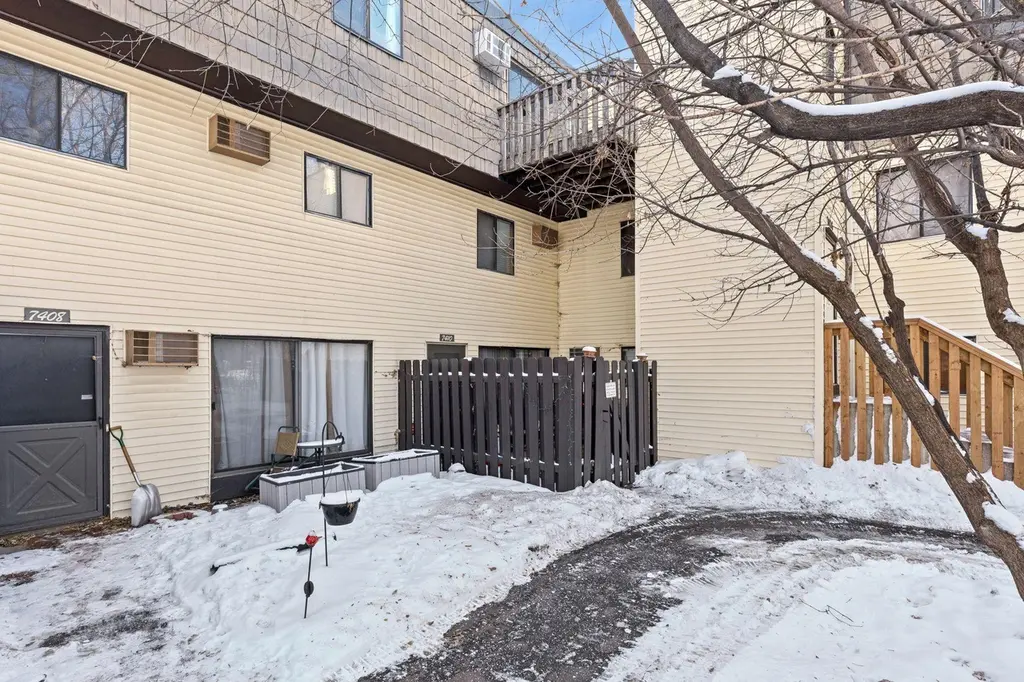
Updated Two-Level Condo with Private Entrance and In-Unit Laundry This beautifully updated 2-bedroom, 1-bath end-unit condo offers a rare two-story layout and private entrance, combining the comfort of townhome-style living with the convenience of a condominium community. Thoughtfully updated, this property is an excellent opportunity for both owner-occupants and investors alike. The main level features a bright and open living space that complements any décor. The remodeled kitchen is equipped with modern cabinetry, updated countertops, and stainless steel appliances, offering both style and functionality. A full-size washer and dryer are conveniently located in the unit, adding everyday ease and eliminating the need for shared laundry facilities. Upstairs, you’ll find two generously sized bedrooms and a fully renovated bathroom featuring a new vanity, updated fixtures, and contemporary tile finishes. The separation between living and sleeping areas provides added privacy and a practical layout for daily living. As an end unit, the home enjoys increased natural light, added privacy, and no neighbors above. Located close to shopping, public transportation, and nearby parks, this low-maintenance condo offers a blend of modern updates, strong rental appeal, and long-term value. Pets allowed. Main level units 2 per household with a maximum combined weight of 80lbs. No single pet weight over 60lbs.
Key facts
- Remodeled kitchen
- Private entrance
- In unit laundry
Tags
Neighborhood map
What this means for you Summary
Snapshot
- This is a 2-bed/1.0-bath condo listed at $79k.
Deal economics
- At list price, monthly cash flow is $-47 ($-558/yr) — negative.
- To cash-flow at today's rent, offer at most $71k (10.4% below list).
- Meets the 1% rule at list price ($1k rent vs $79k).
- Recommended offer: $71k (10.4% below list) — sets the bar for cash-flow.
- Cap rate 5.6% vs local median 3.3% in Brooklyn Park — top-decile yield for the area; either an underpriced asset or a hidden risk that comps aren't pricing in. Stress-test before assuming the spread holds.
Location & tenants
- Location reads 81/100 on livability (#50 in MN, #1,308 nationally) — a professional / high-income tenant draw. Strengths: commute A+, employment A+, housing A+; Watch: crime C-, schools D, amenities F.
- Osseo Public School District (suburban): math 42% / reading 51% proficiency, ranked #129 of 301 in MN (top 43%) — families likely to look elsewhere, expect single-tenant / working-renter base with shorter leases.
- Market conditions: Rents rising (+2.5%/yr); 109 active listings in the ZIP; 21 comparable units currently listed for rent nearby; rentals leasing fast (median 13d on market — plan ~1-2 weeks tenant-placement turnaround); 4,651 units permitted in Hennepin County in 2024 (2,443 in 5+ unit buildings).
Forward outlook
- Local home prices are declining (-3.0%/yr); year-one equity from $546 of loan paydown is wiped out by about $2k of value loss. Plan a longer hold.
- Hennepin County population projected at +30% by 2050 — long-run rental-demand tailwind backs the buy-and-hold thesis.
Negotiation context
- It's been on market 70 days — a 6% lower offer ($74k) is reasonable based on typical stale-listing flexibility.
- 6 sale attempts since 34y ago with the ask held roughly flat each time — persistent listings suggest the price (not the market) is what's stuck; bring a comps-based counter.
- Current owner paid $32k; list at $79k implies a 143% gain — meaningful room to come down on a strong offer.
Risks & watch-outs
- Watch-outs: HOA is 42% of rent.
Questions for the listing agent
- What do current leases actually rent for vs. the listed asking? Can we see a recent rent roll and the last 12 months of T-12 income?
- It's been on market 70 days. Have you received any prior offers? Is the seller open to a 10% concession, seller financing, or rate buy-down credit?
- Built in 1974 — when were the roof, HVAC, electrical panel, plumbing, and water heater last replaced?
- What does the HOA fee cover, when was the last increase, and are there any pending special assessments or reserve-fund shortfalls?
- Any open or pending special assessments — roof, HVAC, plumbing, elevator, façade? What's the per-unit balance and payoff schedule, and is the seller paying it off at close or rolling it to the buyer?
- Why hasn't it sold? Are there any deal-killer items the seller is aware of (foundation, flood, title, zoning, code violations)?
- Is there a deadline driving the sale (1031 exchange, divorce, estate, relocation)? That informs how much negotiation room exists.
- Schools are D-rated, which usually means shorter tenancies and higher turnover. Who's the typical renter profile here, and what's been the actual vacancy rate?
- The area grade is low — what's the realistic commute time and amenity access for the typical tenant pool here? Any planned neighborhood developments (good or bad) we should know about?
- What's the average days-on-market for RENTAL listings here right now (not sales)? A rising rental-DOM trend means longer vacancies and softer asking-rent achievability than the comps imply.
- What's the recent tenant-quality profile in this submarket — average credit score on applications, eviction rate, late-payment / NSF rate, and stable-employment percentage? A property-management company in the area should have these aggregated.
- How much new apartment / multifamily construction is in the pipeline within 1–3 miles? Heavy new supply (>2% of stock underway) typically softens rents 12–24 months out; light construction supports rent growth.
Investment metrics
- 1% rule
- 1.70% ✓
- Cap rate
- 5.59%
- Cash-on-cash
- -2.52%
- DSCR
- 0.89
- GRM
- 4.9
CMA / ARV
No comps found within radius.
Projected returns pro-forma
-3.0% appreciation · 2.52% rent growth · sell at horizon
- IRR
- -21.0%
- Equity multiple
- 0.27×
- Total profit
- $-16,044
- Equity at exit
- $11,779
- IRR
- -15.4%
- Equity multiple
- 0.14×
- Total profit
- $-18,924
- Equity at exit
- $6,830
Cash invested: $22,120 (down + closing). Projections, not guarantees.
Landlord ↔ Tenant lean methodology
- Overall (STATE)
- 46 Balanced
- State Minnesota
- 46 Balanced · D+2
- County
- — inherits STATE
- City
- — inherits STATE
ZIP-level market 55428
- Rents YoY
- 2.5%
- Active inventory
- 109
- Price-to-rent
- 4.9×
Monthly cashflow live
- Estimated rent
- $1,347 high interval (Pro) →
- Mortgage (P&I)
- −$414
- Tax from tax record
- −$93 /mo · $1,120/yr
- Insurance
- −$33
- HOA
- −$570
- Vacancy / Maint / Mgmt
- −$283
- Net cashflow
- $-47
Break-even live
UW: 25.0% down · 7.5% · 30yr · 1.5% tax · 5.0% vac · 8.0% maint · 8.0% mgmt
Financing live
Cash to close
- Down payment
- $19,750
- Closing costs
- $2,370
- Reserves months
- —
- Total cash needed
- —
Loan-product check · same deal, 3 products live
Conventional
25% down · 7.5% · 30yr
- Down + closing
- —
- Monthly P&I
- —
- Monthly cashflow
- —
- DSCR
- —
- Eligible?
- —
Personal DTI + credit; lowest rate.
DSCR
20% down · 8.5% · 30yr
- Down + closing
- —
- Monthly P&I
- —
- Monthly cashflow
- —
- DSCR
- —
- Eligible?
- —
No personal income docs; deal must DSCR.
Hard money
10% down · 12.0% · 12mo
- Down + closing
- —
- Monthly P&I
- —
- Monthly cashflow
- —
- DSCR
- —
- Eligible?
- —
Short-term bridge; refi at stabilization.
Rent comps 21 comps
| Address | Beds | Baths | Sqft | Rent | $/sqft | DOM | Units | Dist |
|---|---|---|---|---|---|---|---|---|
| 7468 72nd Ln N #301 Minneapolis, MN | 1.0 | 1.0 | 608 | $1,350 | $2.22 | 4d | 1 | 0.03mi |
| 7254 72nd Ln N #354 Minneapolis, MN | 1.0 | 1.0 | 702 | $1,250 | $1.78 | 24d | 1 | 0.10mi |
| 7282 72nd Ln N #343 Minneapolis, MN | 1.0 | 1.0 | 608 | $1,255 | $2.06 | 4d | 1 | 0.11mi |
| 7242 72nd Ln N Minneapolis, MN | 2.0 | 1.0 | 900 | $1,400 | $1.56 | 12d | 1 | 0.12mi |
| 7617 69th Ave N Minneapolis, MN | 2.0 | 1.0 | 900 | $1,300 | $1.44 | 24d | 1 | 0.43mi |
| 7531 Jersey Ave N Minneapolis, MN | 1.0–2.0 | 1.0 | 880 | $1,415 | $1.61 | 2d | 10 | 0.49mi |
| 5840 73rd Ave N Minneapolis, MN | 1.0–2.0 | 1.0 | 1031 | $1,650 | $1.60 | 14d | 1 | 0.98mi |
| 5805 73rd Ave N Brooklyn Park, MN | 1.0 | 1.0 | 685 | $1,233 | $1.80 | 4d | 2 | 1.05mi |
| 6200 78th Ave N Minneapolis, MN | 1.0 | 1.0 | 750 | $1,092 | $1.46 | 1d | 3 | 1.12mi |
| 6802 63rd Ave N Brooklyn Park, MN | 1.0–2.0 | 1.0 | 827 | $1,550 | $1.87 | 20d | 1 | 1.13mi |
| 6232 65th Ave N Brooklyn Park, MN | 1.0 | 1.0 | 750 | $1,062 | $1.42 | 43d | 3 | 1.15mi |
| 6289 Louisiana Ave N Minneapolis, MN | 2.0 | 1.0 | 900 | $1,233 | $1.37 | 3d | 3 | 1.20mi |
| 6810 63rd Ave N Brooklyn Park, MN | 2.0 | 1.0 | 890 | $1,550 | $1.74 | 43d | 1 | 1.21mi |
| 5625 69th Ave N Minneapolis, MN | 1.0–2.0 | 1.0 | 750 | $1,435 | $1.91 | 24d | 11 | 1.22mi |
| 7870 Zane Ave N Minneapolis, MN | 1.0–2.0 | 1.0 | 760 | $1,375 | $1.81 | 1d | 12 | 1.25mi |
| 5521 Brookdale Dr N Brooklyn Park, MN | 1.0–2.0 | 1.0 | 855 | $1,525 | $1.78 | 1d | 10 | 1.25mi |
| 6390 Douglas Dr N Brooklyn Park, MN | 1.0–2.0 | 1.0 | 850 | $1,409 | $1.66 | 12d | 3 | 1.29mi |
| 7449 Imperial Dr N Minneapolis, MN | 3.0 | 1.0 | 775 | $1,376 | $1.78 | 43d | 1 | 1.34mi |
| 6455 Zane Ave N Minneapolis, MN | 1.0–3.0 | 1.0 | 952 | $1,400 | $1.47 | 4d | 12 | 1.34mi |
| 7449 Imperial Dr N Minneapolis, MN | 1.0 | 1.0 | 700 | $1,159 | $1.66 | 10d | 3 | 1.34mi |
| 8104 Zane Ave N Minneapolis, MN | 1.0–2.0 | 1.0 | 900 | $1,395 | $1.55 | 17d | 3 | 1.42mi |
HOA detail condo
- Monthly dues
- $570 · $6,840/yr
- Assessments
- None detected in remarks — confirm with the listing agent.
Listing history 27 events
-
2026-06-09days on market $79,000 Active 70 DOM
-
2026-06-08days on market $79,000 Active 69 DOM
-
2026-06-07days on market $79,000 Active 68 DOM
-
2026-06-04days on market $79,000 Active 65 DOM
-
2026-06-03days on market $79,000 Active 64 DOM
-
2026-06-02days on market $79,000 Active 63 DOM
-
2026-06-01days on market $79,000 Active 62 DOM
-
2026-05-31days on market $79,000 Active 61 DOM
-
2026-03-31$79,000 Active 1440-char remark
Show marketing remark (1440 chars)
Updated Two-Level Condo with Private Entrance and In-Unit Laundry This beautifully updated 2-bedroom, 1-bath end-unit condo offers a rare two-story layout and private entrance, combining the comfort of townhome-style living with the convenience of a condominium community. Thoughtfully updated, this property is an excellent opportunity for both owner-occupants and investors alike. The main level features a bright and open living space that complements any décor. The remodeled kitchen is equipped with modern cabinetry, updated countertops, and stainless steel appliances, offering both style and functionality. A full-size washer and dryer are conveniently located in the unit, adding everyday ease and eliminating the need for shared laundry facilities. Upstairs, you’ll find two generously sized bedrooms and a fully renovated bathroom featuring a new vanity, updated fixtures, and contemporary tile finishes. The separation between living and sleeping areas provides added privacy and a practical layout for daily living. As an end unit, the home enjoys increased natural light, added privacy, and no neighbors above. Located close to shopping, public transportation, and nearby parks, this low-maintenance condo offers a blend of modern updates, strong rental appeal, and long-term value. Pets allowed. Main level units 2 per household with a maximum combined weight of 80lbs. No single pet weight over 60lbs.
-
2026-03-30historical
-
2026-03-20price $85,000
-
2026-03-02price $89,000
-
2026-02-04$95,000 Active
-
2016-01-15soldstatus $32,500 Sold
-
2015-12-05status Pending
-
2015-11-30historical
-
2015-11-14$34,000 Active
-
2012-10-23historical
-
2012-08-03$800
-
2002-05-17soldstatus $88,900
-
2002-03-18historical
-
2002-03-01$88,900
-
2000-05-31soldstatus $53,900
-
1999-03-18soldstatus $32,000
-
1992-09-12historical
-
1992-03-12$35,900
-
1979-03-01soldstatus $37,500
ⓘ Source: listings_history table (triggers on properties + properties_extension) + one-shot
backfill from property_details.listing_events for pre-trigger history.
Tax reassessment forecast MN · Partial reset (capped growth)
- Current annual tax
- $1,120 · $93/mo
- Projected year-2 tax
- $1,120 · $93/mo
- Expected delta
- $0/yr ($0/mo · 0.0%)
ⓘ Screening estimate from a state-policy table — verify with the county assessor before closing.
Climate risk First Street
- Flood 1/10 Low FEMA zone X (unshaded) · 0% chance over 30 yrs
- Wildfire 1/10 Low
- Heat 2/10 Low 7 d/yr ≥99°F today · 14 d/yr by 30 yrs out
- Wind 2/10 Low
- Air quality 2/10 Low 1 unhealthy d/yr today · 2 by 30 yrs out
Nearby sold comps map
Loading sold comps map…
Walkable amenities ~0.75 mi
Loading nearby amenities…
Taxation est. · year 1
- Rental income
- $16,163
- − Mortgage interest
- −$4,425
- − Property taxes
- −$1,120
- − Insurance
- −$395
- − Repairs & maintenance
- −$1,293
- − Management
- −$1,293
- − HOA
- −$6,840
- − Depreciation
- −$2,298
- Taxable loss
- −$1,502
- Est. tax savings @ 24.0%
- +$360
- After-tax cash flow
- $-198/yr
For passive investors: Depreciation is non-cash, so a rental often shows a tax loss while cash-flowing — sheltering income. Rental losses are passive: they offset passive income freely, and up to $25,000/yr can offset ordinary (W-2) income if you actively participate and your MAGI is under $100k (phasing out to $0 by $150k); unused losses carry forward. On sale, claimed depreciation is recaptured at up to 25%, and gains may owe capital-gains tax (a 1031 exchange can defer both). Figures are a year-1 estimate at your 24.0% rate — not tax advice; consult a CPA.
Schools (NCES district)
- District
- Osseo Public School District
- NCES district ID
- 2725200
- Math proficiency
- 42% ▼ -7.00%
- Reading proficiency
- 51% ▼ -4.00%
- Median HH income
- $76,168
- Composite
- 42.35/100
- National rank
- #3250
- State rank
- #129 of 301 in MN
Livability — Brooklyn Park
- Score
- 81/100
- State rank
- #50
- US rank
- #1308
Category grades
Schools grade is shown separately in the Schools card above.
Census & demographics
- Census place
- Brooklyn Park, MN
- County
- Hennepin County · 1,150,272 people
- City population
- 33,660
- Metro
- Minneapolis-St. Paul-Bloomington, MN-WI
- Population (ZIP)
- 32,499
- Household income
- $74,860
- Rent vs Own
- Severe rent burden
- 1939.0
Population outlook (Hennepin County) Hauer SSP2
- Today (2025)
- 1,405,227 people
- By 2030
- 1,492,650 · +6.2%
- By 2040
- 1,660,157 · +18.1%
- By 2050
- 1,823,498 · +29.8%
- By 2075
- 2,221,283 · +58.1%
- By 2100
- 2,509,976 · +78.6%
Race, ethnicity, and origin ACS 2023
- Neighborhood character
- Diverse neighborhood (Simpson 0.65)
- Race & ethnicity
- White 49% Black 30% Hispanic / Latino 8% Asian 7% Two or more races 7%
- Hispanic origin (detail)
- Mexican 5%
- Common ancestry
- Swiss 8% Portuguese 6% Romanian 2%
- Foreign-born
- 20% · Canada
- Languages at home
- 80% English-only · Spanish 6% Other Asian/Pacific 5% French/Haitian/Cajun 1%
Political lean MEDSL · Hennepin
- 2024 margin
- Solid D (+42.6) · D 70.2% · R 27.5% · Other 2.3%
- 2008→2024 swing
- +14.0pp toward D · 2008: 28.6pp · 2024: 42.6pp
- All cycles
- 2024: D+42.6 2020: D+43.2 2016: D+35.3 2012: D+27.1 2008: D+28.6
Not yet ingested
- Civics
- —
Market trends
- HPI YoY
- ▼ -276.37%
- Current HPI
- 239.4693
- Rent YoY
- ▲ 2.52%
- Metro
- Minneapolis-St. Paul-Bloomington, MN-WI
- State GDP YoY
- ▲ 2.41%
- F500 in state
- 34
Industry mix (Fortune 500 HQ in MN)
| Industry | F500 HQs | Revenue |
|---|---|---|
| Healthcare | 2 | $407B |
|
||
| Retail | 2 | $150B |
|
||
| Consumer Goods | 2 | $32B |
|
||
| Industrial Machinery | 2 | $6B |
|
||
| Agriculture | 1 | $40B |
|
||
| Healthcare / Medical Devices | 1 | $32B |
|
||
Price history
+110.7% since first listed19 events — show timeline
- 2026-03-31 Listed $79,000 NORTHSTARMLS as Distributed by MLS Grid
- 2026-03-30 Listing Removed — NORTHSTARMLS as Distributed by MLS Grid
- 2026-03-20 Price Changed $85,000 NORTHSTARMLS as Distributed by MLS Grid
- 2026-03-02 Price Changed $89,000 NORTHSTARMLS as Distributed by MLS Grid
- 2026-02-04 Listed $95,000 NORTHSTARMLS as Distributed by MLS Grid
- 2016-01-15 Sold (MLS) $32,500 NORTHSTARMLS as Distributed by MLS Grid
- 2015-12-05 Pending — NORTHSTARMLS as Distributed by MLS Grid
- 2015-11-30 Listing Removed — NORTHSTARMLS as Distributed by MLS Grid
- 2015-11-14 Listed $34,000 NORTHSTARMLS as Distributed by MLS Grid
- 2012-10-23 Listing Removed — NORTHSTARMLS as Distributed by MLS Grid
- 2012-08-03 Listed $800 NORTHSTARMLS as Distributed by MLS Grid
- 2002-05-17 Sold (MLS) $88,900 NORTHSTARMLS as Distributed by MLS Grid
- 2002-03-18 Listing Removed — NORTHSTARMLS as Distributed by MLS Grid
- 2002-03-01 Listed $88,900 NORTHSTARMLS as Distributed by MLS Grid
- 2000-05-31 Sold (Public Records) $53,900 Public Records
- 1999-03-18 Sold (Public Records) $32,000 Public Records
- 1992-09-12 Listing Removed — NORTHSTARMLS as Distributed by MLS Grid
- 1992-03-12 Listed $35,900 NORTHSTARMLS as Distributed by MLS Grid
- 1979-03-01 Sold (Public Records) $37,500 Public Records
Property tax history
+10.5%/yrLatest (2025): $1,120 · +9.1% YoY. Source: county tax records.
Cash-flow waterfall
monthlySold comps — $/sqft
last 12 mo · ≤1 miLoading sold comps…