 Duplex
13600 Santa Rosa Dr · Detroit, MI
Flood risk 1/10 · Minimal
- FEMA flood zone
- X (unshaded)
- Chance of flooding over 30 yrs
- 0.0%
- Est. flood insurance / yr
- $473 – $860
Fire risk 1/10 · Minimal
- Est. fire insurance / yr
- $784 – $1,456
Heat risk 3/10 · Minor
- Hot days now (above 97°F)
- 7 days/yr
- Hot days in 30 yrs
- 15 days/yr
Wind risk 2/10 · Minimal
- Chance of severe wind over 30 yrs
- —
Air-quality risk 4/10 · Minor
- Unhealthy air days now
- 4 days/yr
- Unhealthy air days in 30 yrs
- 6 days/yr
Risk factors via First Street. Map © Google.
Why this score? — see what drove the B grade
The composite is a weighted blend of 9 inputs, each scored 0–100. Each bar is that input's sub-score; the figure is the points it added to the 100-point composite (weight × sub-score).
- Cash flow +30.0/30.0
- ARV discount +10.9/15.0
- DSCR +10.0/10.0
- 1% rule +9.8/10.0
- Rent growth +4.0/5.0
- Livability +3.7/5.0
- Condition / age +2.5/5.0
- Schools +1.3/10.0
- Appreciation +0.0/10.0
$147,900
🖨 Deal sheet 📄 Offer letter ✓ Due diligence
Multi-family units
County records classify this as Multi-Family (2-4 Unit). Listing-text estimate: 2 units. confirmed
Listing remarks MLS
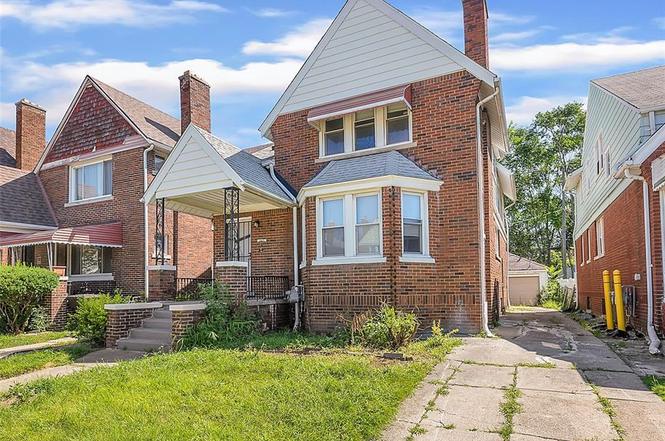
Welcome to 13600 Santa Rosa, a classic Detroit 2-family flat offering the perfect blend of income potential and urban living. Whether you're an investor seeking cash flow or a buyer looking to offset your mortgage through house hacking, this property delivers flexibility and opportunity. Each unit features spacious living areas, generous room sizes, and the timeless character that makes Detroit multifamily properties so desirable. Live comfortably in one unit while collecting rental income from the other, or lease both units to maximize your return. The versatile layout makes it an excellent fit for first-time investors, owner-occupants, and seasoned portfolio builders alike. Located in Detroit's historic northwest side, you'll enjoy convenient access to major thoroughfares, parks, shopping, dining, and employment centers. With strong rental demand and continued investment throughout the surrounding area, this property is well-positioned for both immediate income and long-term appreciation. Whether you're looking to build wealth through real estate, reduce your monthly housing costs, or add a multifamily asset to your portfolio, 13600 Santa Rosa presents a compelling opportunity to do it all under one roof.
Key facts
- Versatile layout
- Generous room sizes
- Convenient access
Tags
Property features AI
Finance
- Other: Above-grade finished area reported as 2,076 square feet; Lot dimensions approximately 35 x 108 (0.09 acre)
Exterior
- Utilities: Public sewer
- Home design: Multi-family residential property; Two-story building
- Construction: Brick construction; Block foundation
- Exterior features: Paved road access; Pets allowed; Zoned for multifamily/residential
Interior
- Bedrooms: One unit is 2-bedroom (unit-level details provided)
- Bathrooms: Two full bathrooms and two half bathrooms; One unit listed with 1 bathroom (unit-level detail)
- Heating & cooling: Forced air heating; Natural gas heating; No central cooling listed
- Interior features: Unfinished basement
Neighborhood map
What this means for you Summary
Snapshot
- This is a 2 × 2-bed/1.5-bath units multifamily listed at $148k.
Deal economics
- At list price, monthly cash flow is $648 ($8k/yr) — positive. Per door: $324/mo.
- The deal already cash-flows at list — no discount required.
- Meets the 1% rule at list price ($2k rent vs $148k).
Location & tenants
- Location reads 73/100 on livability (#218 in MI) — a middle-class / working-renter tenant base. Strengths: amenities A+, commute A+, cost of living A+; Watch: schools F, crime F, employment F.
- Detroit Public Schools Community District (urban): math 10% / reading 24% proficiency, ranked #499 of 540 in MI (top 92%) — low school quality limits family demand, transient renter base, plan for 1-2y turnover; 90% free/reduced lunch — lower-income household profile, screen leases tightly.
- Market conditions: Rents rising fast (+6.1%/yr); 346 active listings in the ZIP; 20 comparable units currently listed for rent nearby; rentals at typical pace (median 25d on market — plan ~3-4 weeks tenant-placement turnaround); 40% of comp listings sitting > 30 days — soft ceiling on asking rent; lower-income renter base — watch delinquency; 2,639 units permitted in Wayne County in 2024 (1,216 in 5+ unit buildings).
- At $2,193/mo this rent would consume 79% of the median local household income ($33k/yr) (locally 2172% of renters already pay >50% of income on rent) — very limited rent-growth headroom before tenants either downsize or default.
Forward outlook
- Local home prices are declining (-3.0%/yr); year-one equity from $1k of loan paydown is wiped out by about $4k of value loss. Plan a longer hold.
- Wayne County population projected at -17% by 2050 — secular population decline; favor cash flow + early exit over multi-decade hold.
- At projected returns (-3.0% appreciation + 6.1% rent growth), your $41k cash investment doubles in ~6 years — after that, you're playing with house money.
Negotiation context
- Only 1 days on market — expect competitive offers; lowballing is unlikely to land.
- 13 sale attempts since 3y ago with the ask held roughly flat each time — persistent listings suggest the price (not the market) is what's stuck; bring a comps-based counter.
- Current owner paid $128k; 16% above their basis — modest negotiation headroom, anchor on the comps not their cost.
Risks & watch-outs
- Watch-outs: built in 1927 — expect roof / HVAC / electrical / plumbing capex.
Questions for the listing agent
- Can we see the unit-by-unit rent roll, current vacancy, and any below-market leases? What's the average tenancy length?
- What capital expenditures (roof, boiler, parking lot, exteriors) have been made in the last 5 years, and what's planned in the next 2?
- Built in 1927 — when were the roof, HVAC, electrical panel, plumbing, and water heater last replaced?
- Is there a deadline driving the sale (1031 exchange, divorce, estate, relocation)? That informs how much negotiation room exists.
- Schools are F-rated, which usually means shorter tenancies and higher turnover. Who's the typical renter profile here, and what's been the actual vacancy rate?
- Crime grade is F in this area — have there been break-ins, vandalism, or insurance claims at this property in the last 3 years? What carrier currently insures it and at what premium?
- What's the average days-on-market for RENTAL listings here right now (not sales)? A rising rental-DOM trend means longer vacancies and softer asking-rent achievability than the comps imply.
- What's the recent tenant-quality profile in this submarket — average credit score on applications, eviction rate, late-payment / NSF rate, and stable-employment percentage? A property-management company in the area should have these aggregated.
- How much new apartment / multifamily construction is in the pipeline within 1–3 miles? Heavy new supply (>2% of stock underway) typically softens rents 12–24 months out; light construction supports rent growth.
Investment metrics
- 1% rule
- 1.48% ✓
- Cap rate
- 11.55%
- Cash-on-cash
- 18.77%
- DSCR
- 1.84
- GRM
- 5.6
CMA / ARV
- ARV (on-the-fly)
- $159,852
- Comps found
- 12
Show comp detail 12 sales within ~0.75 mi
| Address | Dist | Beds/Ba | Sqft | Sold | Price | $/sf | Match |
|---|---|---|---|---|---|---|---|
| 13531 Santa Rosa Dr | 0.07mi | 4/2.0 | 2,050 (-1%) | 10mo | $95,000 | $46 | 86 |
| 4343 Waverly St | 0.24mi | 4/2.5 | 2,046 (-1%) | 12mo | $175,000 | $86 | 74 |
| 13233 Santa Rosa Dr | 0.14mi | 5/2.0 (+1) | 2,279 (+10%) | 2mo | $175,000 | $77 | 71 |
| 12771 Northlawn St | 0.68mi | 4/2.0 | 2,040 (-2%) | 6mo | $127,500 | $63 | 61 |
| 4268 Cortland St | 0.64mi | 4/2.0 | 2,000 (-4%) | 8mo | $157,000 | $79 | 58 |
| 4308 Tyler St | 0.28mi | 5/2.0 (+1) | 2,300 (+11%) | 9mo | $195,000 | $85 | 56 |
| 13621 Northlawn St | 0.61mi | 4/2.0 | 2,016 (-3%) | 18mo | $105,000 | $52 | 52 |
| 4754 Cortland St | 0.60mi | 5/2.0 (+1) | 2,124 (+2%) | 15mo | $45,000 | $21 | 51 |
| 3242 Tyler St | 0.73mi | 4/2.0 | 2,050 (-1%) | 18mo | $85,000 | $41 | 49 |
| 13900 Cherrylawn St | 0.63mi | 4/2.0 | 1,868 (-10%) | 10mo | $150,000 | $80 | 46 |
| 3838 Tyler St | 0.46mi | 3/2.5 (-1) | 1,898 (-9%) | 17mo | $181,000 | $95 | 43 |
| 12362 Monica St | 0.54mi | 4/2.0 | 2,328 (+12%) | 16mo | $72,000 | $31 | 41 |
Match score weights: distance 35% · size 25% · config 20% · recency 20%. Top-matched comps best support the ARV.
Projected returns pro-forma
-3.0% appreciation · 6.14% rent growth · sell at horizon
- IRR
- 14.2%
- Equity multiple
- 1.59×
- Total profit
- $24,517
- Equity at exit
- $22,052
- IRR
- 25.4%
- Equity multiple
- 3.56×
- Total profit
- $106,055
- Equity at exit
- $12,788
Cash invested: $41,412 (down + closing). Projections, not guarantees.
Landlord ↔ Tenant lean methodology
- Overall (STATE)
- 62 Landlord-Friendly
- State Michigan
- 62 Landlord-Friendly · EVEN
- County
- — inherits STATE
- City
- — inherits STATE
ZIP-level market 48238
- Home prices YoY
- -14.4%
- Rents YoY
- 6.1%
- Active inventory
- 346
- Price-to-rent
- 11.2×
Monthly cashflow live
- Estimated rent
- $2,193 high interval (Pro) →
- Mortgage (P&I)
- −$776
- Tax from tax record
- −$247 /mo · $2,968/yr
- Insurance
- −$62
- HOA
- −$0
- Vacancy / Maint / Mgmt
- −$461
- Net cashflow
- $648
Break-even live
2-unit breakdown (identical units grouped — click to expand)
| Units | Beds | Baths | Est. rent |
|---|---|---|---|
| 2× units | 2 | 1.5 | $2,192 |
| #1 | 2 | 1.5 | $1,096 |
| #2 | 2 | 1.5 | $1,096 |
| Total (2 units) | $2,193 | ||
UW: 25.0% down · 7.5% · 30yr · 1.5% tax · 5.0% vac · 8.0% maint · 8.0% mgmt
Financing live
Cash to close
- Down payment
- $36,975
- Closing costs
- $4,437
- Reserves months
- —
- Total cash needed
- —
Loan-product check · same deal, 3 products live
Conventional
25% down · 7.5% · 30yr
- Down + closing
- —
- Monthly P&I
- —
- Monthly cashflow
- —
- DSCR
- —
- Eligible?
- —
Personal DTI + credit; lowest rate.
DSCR
20% down · 8.5% · 30yr
- Down + closing
- —
- Monthly P&I
- —
- Monthly cashflow
- —
- DSCR
- —
- Eligible?
- —
No personal income docs; deal must DSCR.
Hard money
10% down · 12.0% · 12mo
- Down + closing
- —
- Monthly P&I
- —
- Monthly cashflow
- —
- DSCR
- —
- Eligible?
- —
Short-term bridge; refi at stabilization.
Rent comps 20 comps
| Address | Beds | Baths | Sqft | Rent | $/sqft | DOM | Units | Dist |
|---|---|---|---|---|---|---|---|---|
| 13225 Santa Rosa Dr Detroit, MI | 5.0 | 2.0 | 2100 | $1,700 | $0.81 | 5d | 1 | 0.16mi |
| 4341 Glendale St Detroit, MI | 4.0 | 2.5 | 1832 | $1,680 | $0.92 | 5d | 1 | 0.38mi |
| 12546 Broadstreet Ave Detroit, MI | 3.0 | 1.5 | 1899 | $1,250 | $0.66 | 44d | 1 | 0.50mi |
| 3747 Tyler St Detroit, MI | 3.0 | 1.0 | 2600 | $1,700 | $0.65 | 24d | 1 | 0.52mi |
| 3209 W Grand St Detroit, MI | 3.0 | 1.0 | 1550 | $1,103 | $0.71 | 44d | 1 | 0.70mi |
| 14242 Ohio St Detroit, MI | 4.0 | 1.0 | 1400 | $1,000 | $0.71 | 44d | 1 | 0.78mi |
| 12303 Cloverlawn St Detroit, MI | 3.0 | 1.5 | 1454 | $1,400 | $0.96 | 44d | 1 | 0.82mi |
| Ohio St Unit 4 Detroit, MI | 4.0 | 1.5 | 1400 | $750 | $0.54 | 44d | 1 | 0.88mi |
| 2986 Richton St Detroit, MI | 3.0 | 1.0 | 2600 | $1,200 | $0.46 | 17d | 1 | 1.01mi |
| 3322 Webb St Detroit, MI | 3.0 | 1.0 | 1600 | $1,250 | $0.78 | 17d | 1 | 1.07mi |
| 3322 Webb St Unit 1 Detroit, MI | 3.0 | 1.0 | 1656 | $1,350 | $0.82 | 44d | 1 | 1.08mi |
| 3322 Webb St Unit 2 Detroit, MI | 3.0 | 1.0 | 1656 | $1,350 | $0.82 | 44d | 1 | 1.08mi |
| 12650 Griggs St Detroit, MI | 3.0 | 2.0 | 1628 | $1,375 | $0.84 | 24d | 1 | 1.15mi |
| 2474 Fullerton St Detroit, MI | 3.0 | 1.0 | 1400 | $1,300 | $0.93 | 15d | 1 | 1.23mi |
| 3241 Lawrence St Detroit, MI | 4.0 | 2.0 | 2636 | $1,800 | $0.68 | 17d | 1 | 1.25mi |
| 3031 Lawrence St Detroit, MI | 4.0 | 1.0 | 1700 | $1,600 | $0.94 | 17d | 1 | 1.29mi |
| 15457 Cloverlawn St Detroit, MI | 3.0 | 2.0 | 1500 | $1,275 | $0.85 | 24d | 1 | 1.34mi |
| 15537 Normandy St Detroit, MI | 3.0 | 1.0 | 2626 | $1,400 | $0.53 | 44d | 1 | 1.44mi |
| 2925 Calvert St Detroit, MI | 3.0 | 1.0 | 1400 | $1,300 | $0.93 | 17d | 1 | 1.45mi |
| 2655 Collingwood St Detroit, MI | 4.0 | 1.5 | 1881 | $2,700 | $1.44 | 2d | 1 | 1.48mi |
Listing history 2 events
-
2026-06-19remarks 699-char remark
-
2026-06-19$147,900 Active 1 DOM
ⓘ Source: listings_history table (triggers on properties + properties_extension) + one-shot
backfill from property_details.listing_events for pre-trigger history.
Tax reassessment forecast MI · Partial reset (capped growth)
- Current annual tax
- $2,968 · $247/mo
- Projected year-2 tax
- $2,968 · $247/mo
- Expected delta
- $0/yr ($0/mo · 0.0%)
ⓘ Screening estimate from a state-policy table — verify with the county assessor before closing.
Climate risk First Street
- Flood 1/10 Low FEMA zone X (unshaded) · 0% chance over 30 yrs
- Wildfire 1/10 Low
- Heat 3/10 Moderate 7 d/yr ≥97°F today · 15 d/yr by 30 yrs out
- Wind 2/10 Low
- Air quality 4/10 Moderate 4 unhealthy d/yr today · 6 by 30 yrs out
Nearby sold comps map
Loading sold comps map…
Walkable amenities ~0.75 mi
Loading nearby amenities…
Taxation est. · year 1
- Rental income
- $26,316
- − Mortgage interest
- −$8,285
- − Property taxes
- −$2,968
- − Insurance
- −$740
- − Repairs & maintenance
- −$2,105
- − Management
- −$2,105
- − Depreciation
- −$4,303
- Taxable income
- $5,811
- Est. tax owed @ 24.0%
- −$1,395
- After-tax cash flow
- $6,380/yr
For passive investors: Depreciation is non-cash, so a rental often shows a tax loss while cash-flowing — sheltering income. Rental losses are passive: they offset passive income freely, and up to $25,000/yr can offset ordinary (W-2) income if you actively participate and your MAGI is under $100k (phasing out to $0 by $150k); unused losses carry forward. On sale, claimed depreciation is recaptured at up to 25%, and gains may owe capital-gains tax (a 1031 exchange can defer both). Figures are a year-1 estimate at your 24.0% rate — not tax advice; consult a CPA.
Schools (NCES district)
- District
- Detroit Public Schools Community District
- NCES district ID
- 2601103
- Math proficiency
- 10% ▼ -2.00%
- Reading proficiency
- 24% ▲ 6.00%
- Median HH income
- $25,815
- Composite
- 13.06/100
- National rank
- #9564
- State rank
- #499 of 540 in MI
Livability — Detroit
- Score
- 73/100
- State rank
- #218
- US rank
- #5427
Category grades
Schools grade is shown separately in the Schools card above.
Census & demographics
- Census place
- Detroit, MI
- County
- Wayne County · 1,562,939 people
- City population
- 572,865
- Metro
- Detroit-Warren-Dearborn, MI
- Population (ZIP)
- 24,731
- Household income
- $33,315
- Rent vs Own
- Severe rent burden
- 2172.0
Population outlook (Wayne County) Hauer SSP2
- Today (2025)
- 1,675,273 people
- By 2030
- 1,620,300 · -3.3%
- By 2040
- 1,502,341 · -10.3%
- By 2050
- 1,384,039 · -17.4%
- By 2075
- 1,124,592 · -32.9%
- By 2100
- 881,193 · -47.4%
Race, ethnicity, and origin ACS 2023
- Neighborhood character
- Predominantly Black (94%)
- Race & ethnicity
- Black 94% Two or more races 3% White 1%
- Foreign-born
- 1%
Political lean MEDSL · Wayne
- 2024 margin
- Strong D (+29.0) · D 62.7% · R 33.7% · Other 3.6%
- 2008→2024 swing
- -20.5pp toward R · 2008: 49.5pp · 2024: 29.0pp
- All cycles
- 2024: D+29.0 2020: D+38.1 2016: D+37.3 2012: D+46.9 2008: D+49.5
Not yet ingested
- Civics
- —
Market trends
- HPI YoY
- ▼ -31.96%
- Current HPI
- 189.6227
- Rent YoY
- ▲ 6.14%
- Metro
- Detroit-Warren-Dearborn, MI
- State GDP YoY
- ▲ 1.37%
- F500 in state
- 28
Industry mix (Fortune 500 HQ in MI)
| Industry | F500 HQs | Revenue |
|---|---|---|
| Automotive Parts | 3 | $48B |
|
||
| Automotive | 2 | $372B |
|
||
| Chemicals | 1 | $45B |
|
||
| Automotive Retail | 1 | $29B |
|
||
| Healthcare / Medical Devices | 1 | $23B |
|
||
| Automotive Technology | 1 | $20B |
|
||
Price history
-1.4% since first listed36 events — show timeline
- 2026-06-15 Listed $147,900 REALCOMP
- 2026-06-15 Listed $147,900 MiRealSource-MiMLS
- 2025-10-06 Sold (Public Records) $128,000 Public Records
- 2024-11-11 Listing Removed — MiRealSource-MiMLS
- 2024-11-11 Listing Removed — MiRealSource-MiMLS
- 2024-11-11 Listing Removed — REALCOMP
- 2024-11-11 Listing Removed — REALCOMP
- 2024-10-18 Relisted — MiRealSource-MiMLS
- 2024-10-18 Relisted — MiRealSource-MiMLS
- 2024-10-18 Relisted — REALCOMP
- 2024-10-18 Relisted — REALCOMP
- 2024-09-02 Pending — MiRealSource-MiMLS
- 2024-09-02 Pending — MiRealSource-MiMLS
- 2024-09-02 Pending — REALCOMP
- 2024-09-02 Pending — REALCOMP
- 2024-08-14 Listed $144,900 MiRealSource-MiMLS
- 2024-08-14 Listed $144,900 MiRealSource-MiMLS
- 2024-08-14 Listed $144,900 REALCOMP
- 2024-08-14 Listed $144,900 REALCOMP
- 2024-08-12 Coming Soon — MiRealSource-MiMLS
- 2024-08-12 Coming Soon — REALCOMP
- 2024-08-12 Coming Soon — MiRealSource-MiMLS
- 2024-08-12 Coming Soon — REALCOMP
- 2023-12-18 Listing Removed — MiRealSource-MiMLS
- 2023-12-17 Relisted — REALCOMP
- 2023-10-31 Listing Removed — REALCOMP
- 2023-08-21 Pending — MiRealSource-MiMLS
- 2023-08-21 Pending — REALCOMP
- 2023-08-08 Price Changed $99,900 MiRealSource-MiMLS
- 2023-08-08 Price Changed $99,900 REALCOMP
- 2023-07-08 Price Changed $119,900 MiRealSource-MiMLS
- 2023-07-07 Price Changed $119,900 REALCOMP
- 2023-06-18 Price Changed $139,900 MiRealSource-MiMLS
- 2023-06-18 Price Changed $139,900 REALCOMP
- 2023-05-28 Listed $150,000 MiRealSource-MiMLS
- 2023-05-28 Listed $150,000 REALCOMP
Property tax history
+8.0%/yrLatest (2025): $2,968 · +205.3% YoY. Source: county tax records.
Cash-flow waterfall
monthlySold comps — $/sqft
last 12 mo · ≤1 miLoading sold comps…