 🏗️ New Construction
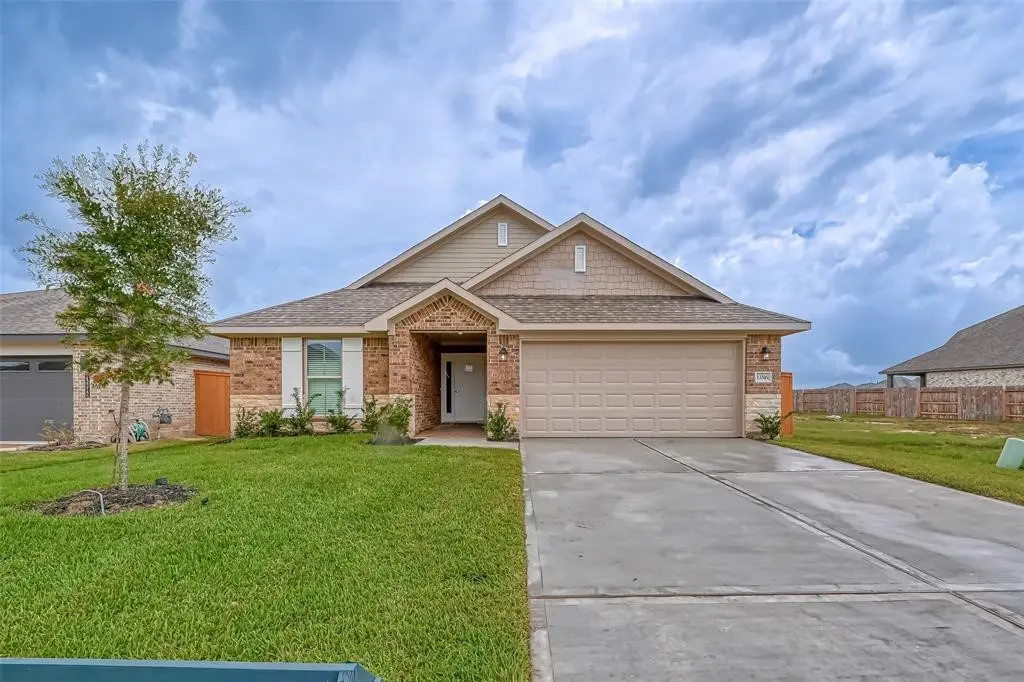
13705 Sorico Bay Dr · Texas City, TX
Flood risk 1/10 · Minimal
- FEMA flood zone
- X (unshaded)
- Chance of flooding over 30 yrs
- 0.0%
- Est. flood insurance / yr
- $507 – $1,088
Fire risk 4/10 · Minor
- Est. fire insurance / yr
- $1,222 – $2,270
Heat risk 10/10 · Severe
- Hot days now (above 109°F)
- 6 days/yr
- Hot days in 30 yrs
- 23 days/yr
Wind risk 10/10 · Severe
- Chance of severe wind over 30 yrs
- 99.0%
Air-quality risk 2/10 · Minimal
- Unhealthy air days now
- 1 days/yr
- Unhealthy air days in 30 yrs
- 1 days/yr
Risk factors via First Street. Map © Google.
Why this score? — see what drove the C grade
The composite is a weighted blend of 9 inputs, each scored 0–100. Each bar is that input's sub-score; the figure is the points it added to the 100-point composite (weight × sub-score).
- Cash flow +23.2/30.0
- DSCR +7.5/10.0
- ARV discount +7.5/15.0
- 1% rule +5.9/10.0
- Rent growth +3.5/5.0
- Schools +3.5/10.0
- Livability +3.1/5.0
- Condition / age +2.5/5.0
- Appreciation +0.0/10.0
$268,400
🖨 Deal sheet 📄 Offer letter ✓ Due diligence
Listing remarks
Come out to Lago Mar and tour this gorgeous 1635 plan from Adams Homes. This 4 sided brick home was built with everything you need. Adams Homes has equipped this home with stainless steel appliances, granite countertops, vinyl flooring, subway tile backsplashes and so much more. This home is priced to sell and won't last long!
Key facts
- Vinyl flooring
- Granite countertops
- 5,998 sq ft lot
Tags
Property features AI
Finance
- Other: Lot on concrete road surface; Lot in subdivision
- HOA & community: Association: PMG Houston; Annual association fee; Association amenities include fitness center, playground, and pool; Association fee covers common areas and recreation facilities
Exterior
- Parking: Attached 2-car garage
- Security: Smoke detector(s)
- Utilities: Public water; Public sewer
- Home design: Residential property; New construction (2026); Single-story (entry level: first floor); Facing unspecified
- Construction: Built in 2026; Brick, cement siding, and wood siding exterior; Composition roof; Slab foundation
- Exterior features: Smoke detectors; Association pool
Interior
- Kitchen: Dishwasher; Garbage disposal; Gas oven; Gas range; Microwave
- Bedrooms: Primary bedroom (first floor); Bedroom (first floor); Bedroom (first floor); Bedroom (first floor)
- Flooring: Carpet; Vinyl
- Bathrooms: 2 full bathrooms
- Heating & cooling: Central heating (gas); Central air conditioning (electric)
- Interior features: Breakfast bar; Double vanity; Granite counters; High ceilings; Kitchen and family room combo; Pantry; Soaking tub; Separate shower; Tub/shower combination; Ceiling fans; Kitchen and dining combo; Living and dining room
- Laundry & utility: Washer hookup; Electric dryer hookup
Neighborhood map
What this means for you Summary
Snapshot
- This is a 4-bed/2.0-bath land listed at $268k.
Deal economics
- At list price, monthly cash flow is $486 ($6k/yr) — positive.
- The deal already cash-flows at list — no discount required.
- Meets the 1% rule at list price ($3k rent vs $268k).
- Cap rate 8.5% vs local median 4.3% in Texas City — top-decile yield for the area; either an underpriced asset or a hidden risk that comps aren't pricing in. Stress-test before assuming the spread holds.
Location & tenants
- Location reads 62/100 on livability (#907 in TX) — a middle-class / working-renter tenant base. Strengths: cost of living A+, housing A+; Watch: crime D+, amenities F, commute F.
- Dickinson ISD (suburban): math 39% / reading 40% proficiency, ranked #366 of 826 in TX (top 44%) — families likely to look elsewhere, expect single-tenant / working-renter base with shorter leases; 60% free/reduced lunch — lower-income household profile, screen leases tightly.
- Zoned schools: Elva C Lobit Middle (math 31% / reading 27%, grade F, #1,103 of 1,662 statewide, top 67%, 582 students, 52% FRL); Dickinson H S (math 30% / reading 46%, grade F, #880 of 1,632 statewide, top 54%, 3,619 students, 64% FRL) — zoned schools at 58% FRL track the district average.
- Market conditions: Rents rising (+4.0%/yr); 654 active listings in the ZIP; 3 comparable units currently listed for rent nearby; rentals leasing fast (median 12d on market — plan ~1-2 weeks tenant-placement turnaround); 3,258 units permitted in Galveston County in 2024 (0 in 5+ unit buildings).
- At $2,930/mo this rent would consume 47% of the median local household income ($75k/yr) (locally 700% of renters already pay >50% of income on rent) — very limited rent-growth headroom before tenants either downsize or default.
Forward outlook
- Local home prices are declining (-3.0%/yr); year-one equity from $2k of loan paydown is wiped out by about $8k of value loss. Plan a longer hold.
- Galveston County population projected at +43% by 2050 — long-run rental-demand tailwind backs the buy-and-hold thesis.
Negotiation context
- Only 10 days on market — expect competitive offers; lowballing is unlikely to land.
Risks & watch-outs
- Climate carrying-cost: severe wind risk, 99% chance of damaging wind over 30y; extreme-heat days projected 6→23/yr by 2055 (HVAC capex compounding) — expect insurance premiums to compound above CPI over the hold.
Questions for the listing agent
- What does the HOA fee cover, when was the last increase, and are there any pending special assessments or reserve-fund shortfalls?
- Is there a deadline driving the sale (1031 exchange, divorce, estate, relocation)? That informs how much negotiation room exists.
- Schools are F-rated, which usually means shorter tenancies and higher turnover. Who's the typical renter profile here, and what's been the actual vacancy rate?
- Crime grade is D in this area — have there been break-ins, vandalism, or insurance claims at this property in the last 3 years? What carrier currently insures it and at what premium?
- What's the average days-on-market for RENTAL listings here right now (not sales)? A rising rental-DOM trend means longer vacancies and softer asking-rent achievability than the comps imply.
- What's the recent tenant-quality profile in this submarket — average credit score on applications, eviction rate, late-payment / NSF rate, and stable-employment percentage? A property-management company in the area should have these aggregated.
- How much new for-sale + rental construction is in the pipeline within 1–3 miles? Heavy new supply typically softens prices + rents 12–24 months out; constrained supply supports both.
Investment metrics
- 1% rule
- 1.09% ✓
- Cap rate
- 8.47%
- Cash-on-cash
- 7.77%
- DSCR
- 1.35
- GRM
- 7.6
CMA / ARV
No comps found within radius.
Projected returns pro-forma
-3.0% appreciation · 3.95% rent growth · sell at horizon
- IRR
- -3.4%
- Equity multiple
- 0.87×
- Total profit
- $-9,657
- Equity at exit
- $40,019
- IRR
- 7.3%
- Equity multiple
- 1.58×
- Total profit
- $43,424
- Equity at exit
- $23,206
Cash invested: $75,152 (down + closing). Projections, not guarantees.
Landlord ↔ Tenant lean methodology
- Overall (STATE)
- 87 Strongly Landlord-Friendly
- State Texas
- 87 Strongly Landlord-Friendly · R+5
- County
- — inherits STATE
- City
- — inherits STATE
ZIP-level market 77568
- Home prices YoY
- -22.7%
- Rents YoY
- 4.0%
- Active inventory
- 654
- Price-to-rent
- 7.6×
Monthly cashflow live
- Estimated rent
- $2,930 medium interval (Pro) →
- Mortgage (P&I)
- −$1,408
- Tax from tax record
- −$184 /mo · $2,209/yr
- Insurance
- −$112
- HOA
- −$125
- Vacancy / Maint / Mgmt
- −$615
- Net cashflow
- $486
Break-even live
UW: 25.0% down · 7.5% · 30yr · 1.5% tax · 5.0% vac · 8.0% maint · 8.0% mgmt
Financing live
Cash to close
- Down payment
- $67,100
- Closing costs
- $8,052
- Reserves months
- —
- Total cash needed
- —
Loan-product check · same deal, 3 products live
Conventional
25% down · 7.5% · 30yr
- Down + closing
- —
- Monthly P&I
- —
- Monthly cashflow
- —
- DSCR
- —
- Eligible?
- —
Personal DTI + credit; lowest rate.
DSCR
20% down · 8.5% · 30yr
- Down + closing
- —
- Monthly P&I
- —
- Monthly cashflow
- —
- DSCR
- —
- Eligible?
- —
No personal income docs; deal must DSCR.
Hard money
10% down · 12.0% · 12mo
- Down + closing
- —
- Monthly P&I
- —
- Monthly cashflow
- —
- DSCR
- —
- Eligible?
- —
Short-term bridge; refi at stabilization.
Rent comps 3 comps
| Address | Beds | Baths | Sqft | Rent | $/sqft | DOM | Units | Dist |
|---|---|---|---|---|---|---|---|---|
| 13817 Starboard Reach Dr Santa Fe, TX | 3.0–4.0 | 2.0–3.5 | 2268 | $3,630 | $1.60 | 1d | 1 | 0.71mi |
| 640 Totem Trail Dr La Marque, TX | 4.0 | 2.5 | 2134 | $2,309 | $1.08 | 11d | 1 | 1.02mi |
| 12524 Jetty Cv Santa Fe, TX | 3.0 | 2.0 | 1803 | $2,506 | $1.39 | 22d | 1 | 1.25mi |
HOA detail
- Monthly dues
- $125 · $1,500/yr
Listing history 3 events
-
2026-05-13status Pending 328-char remark
-
2026-05-11price $268,400 328-char remark
-
2026-05-03$263,400 Active 328-char remark
ⓘ Source: listings_history table (triggers on properties + properties_extension) + one-shot
backfill from property_details.listing_events for pre-trigger history.
Tax reassessment forecast TX · Resets to sale price
- Current annual tax
- $2,209 · $184/mo
- Projected year-2 tax
- $4,912 · $409/mo
- Expected delta
- +$2,703/yr (+$225/mo · 122.4%)
ⓘ Screening estimate from a state-policy table — verify with the county assessor before closing.
Climate risk First Street
- Flood 1/10 Low FEMA zone X (unshaded) · 0% chance over 30 yrs
- Wildfire 4/10 Moderate
- Heat 10/10 Extreme 6 d/yr ≥109°F today · 23 d/yr by 30 yrs out
- Wind 10/10 Extreme 99% chance of damaging wind over 30 yrs
- Air quality 2/10 Low 1 unhealthy d/yr today · 1 by 30 yrs out
Nearby sold comps map
Loading sold comps map…
Walkable amenities ~0.75 mi
Loading nearby amenities…
Taxation est. · year 1
- Rental income
- $35,162
- − Mortgage interest
- −$15,035
- − Property taxes
- −$2,209
- − Insurance
- −$1,342
- − Repairs & maintenance
- −$2,813
- − Management
- −$2,813
- − HOA
- −$1,500
- − Depreciation
- −$7,808
- Taxable income
- $1,643
- Est. tax owed @ 24.0%
- −$394
- After-tax cash flow
- $5,443/yr
For passive investors: Depreciation is non-cash, so a rental often shows a tax loss while cash-flowing — sheltering income. Rental losses are passive: they offset passive income freely, and up to $25,000/yr can offset ordinary (W-2) income if you actively participate and your MAGI is under $100k (phasing out to $0 by $150k); unused losses carry forward. On sale, claimed depreciation is recaptured at up to 25%, and gains may owe capital-gains tax (a 1031 exchange can defer both). Figures are a year-1 estimate at your 24.0% rate — not tax advice; consult a CPA.
Schools (NCES district)
- District
- Dickinson ISD
- NCES district ID
- 4817070
- Math proficiency
- 39% ▼ -11.00%
- Reading proficiency
- 40% ▼ -2.00%
- Median HH income
- $61,318
- Composite
- 35.16/100
- National rank
- #5005
- State rank
- #366 of 826 in TX
Livability — Texas City
- Score
- 62/100
- State rank
- #907
- US rank
- #16268
Category grades
Schools grade is shown separately in the Schools card above.
Census & demographics
- Census place
- Texas City, TX
- County
- Galveston County · 357,330 people
- City population
- 49,936
- Metro
- Houston-The Woodlands-Sugar Land, TX
- Population (ZIP)
- 23,083
- Household income
- $74,694
- Rent vs Own
- Severe rent burden
- 700.0
Population outlook (Galveston County) Hauer SSP2
- Today (2025)
- 390,640 people
- By 2030
- 425,226 · +8.9%
- By 2040
- 493,765 · +26.4%
- By 2050
- 559,698 · +43.3%
- By 2075
- 719,260 · +84.1%
- By 2100
- 819,628 · +109.8%
Race, ethnicity, and origin ACS 2023
- Neighborhood character
- Highly diverse neighborhood (Simpson 0.71)
- Race & ethnicity
- White 37% Hispanic / Latino 29% Black 26% Two or more races 17% Asian 3%
- Hispanic origin (detail)
- Mexican 22% Puerto Rican 1%
- Common ancestry
- Lithuanian 1% Italian 1% Serbian 1%
- Foreign-born
- 8% · Canada
- Languages at home
- 77% English-only · Spanish 21% Tagalog/Filipino 1% Other Asian/Pacific 1%
Political lean MEDSL · Galveston
- 2024 margin
- Strong R (+27.4) · D 35.7% · R 63.1% · Other 1.2%
- 2008→2024 swing
- -7.9pp toward R · 2008: -19.5pp · 2024: -27.4pp
- All cycles
- 2024: R+27.4 2020: R+22.6 2016: R+22.6 2012: R+26.9 2008: R+19.5
Not yet ingested
- Civics
- —
Market trends
- HPI YoY
- ▼ -69.39%
- Current HPI
- 236.0239
- Rent YoY
- ▲ 3.95%
- Metro
- Houston-The Woodlands-Sugar Land, TX
- State GDP YoY
- ▲ 3.95%
- F500 in state
- 110
Industry mix (Fortune 500 HQ in TX)
| Industry | F500 HQs | Revenue |
|---|---|---|
| Energy | 16 | $1,198B |
|
||
| Technology | 5 | $198B |
|
||
| Engineering / Construction | 4 | $72B |
|
||
| Energy Services | 3 | $60B |
|
||
| Utilities | 3 | $41B |
|
||
| Healthcare | 2 | $330B |
|
||
Price history
+1.9% since first listed4 events — show timeline
- 2026-06-11 Sold (MLS) — HARMLS
- 2026-05-13 Pending — HARMLS
- 2026-05-11 Price Changed $268,400 HARMLS
- 2026-05-03 Listed $263,400 HARMLS
Property tax history
+8.4%/yrLatest (2025): $2,209 · +19.4% YoY. Source: county tax records.
Cash-flow waterfall
monthlySold comps — $/sqft
last 12 mo · ≤1 miLoading sold comps…