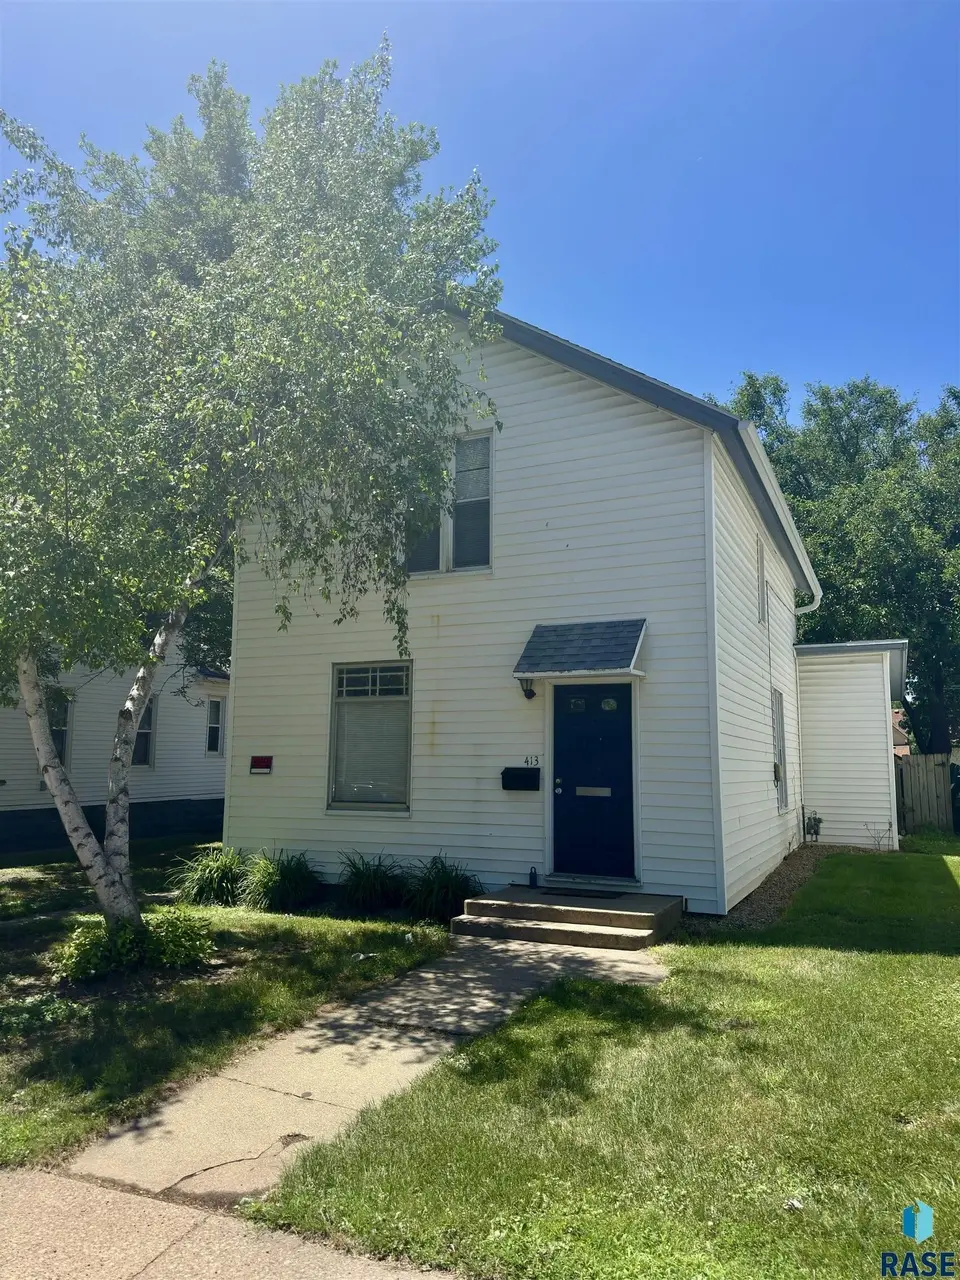
413 S Walts Ave Ave · Sioux Falls, SD
Flood risk 1/10 · Minimal
- FEMA flood zone
- X (unshaded)
- Chance of flooding over 30 yrs
- 0.0%
- Est. flood insurance / yr
- $507 – $1,088
Fire risk 1/10 · Minimal
- Est. fire insurance / yr
- $1,342 – $2,492
Heat risk 2/10 · Minimal
- Hot days now (above 99°F)
- 7 days/yr
- Hot days in 30 yrs
- 13 days/yr
Wind risk 2/10 · Minimal
- Chance of severe wind over 30 yrs
- —
Air-quality risk 2/10 · Minimal
- Unhealthy air days now
- 1 days/yr
- Unhealthy air days in 30 yrs
- 1 days/yr
Risk factors via First Street. Map © Google.
Why this score? — see what drove the D- grade
The composite is a weighted blend of 9 inputs, each scored 0–100. Each bar is that input's sub-score; the figure is the points it added to the 100-point composite (weight × sub-score).
- Cash flow +9.6/30.0
- ARV discount +7.5/15.0
- Rent growth +4.2/5.0
- Livability +4.2/5.0
- Schools +3.7/10.0
- 1% rule +2.9/10.0
- DSCR +2.7/10.0
- Condition / age +2.5/5.0
- Appreciation +0.0/10.0
$159,900
🖨 Deal sheet 📄 Offer letter ✓ Due diligence
Listing remarks MLS
FIXER UPPER! This property offers 3 bedrooms, formal dining room, spacious living area, vinyl siding, patio, shed and mature trees. There is a lot of work to be done here - an equity building opportunity! Sold AS-IS.
Key facts
- Beautiful staircase
- Gleaming wood floors
- Historic home
Tags
Property features AI
Exterior
- Parking: Gravel parking; Room to add a garage
- Utilities: Public water; Public sewer
- Home design: Single-family residence; 1.5-story; Above-grade finished area listed; Below-grade unfinished area listed; Located inside city limits
- Construction: Vinyl siding; Composition roof; Other type foundation
- Exterior features: Shed(s); City lot; Lot dimensions approximately 50 x 142
Interior
- Kitchen: Electric range; Dishwasher; Refrigerator; Kitchen on main level (approx. 11 x 11)
- Bedrooms: Three upper-level bedrooms (Master: 10 x 16; Bedroom 2: 13 x 10; Bedroom 3: 9 x 13)
- Flooring: Carpet; Wood; Vinyl
- Bathrooms: One full bathroom (main level)
- Heating & cooling: Natural gas heating; Central air conditioning
- Interior features: Partial basement; Three or more bedrooms on the same level; 6 total rooms
- Laundry & utility: Electric water heater; No water softener
Neighborhood map
What this means for you Summary
Snapshot
- This is a 3-bed/2.0-bath other listed at $160k.
Deal economics
- At list price, monthly cash flow is $-108 ($-1k/yr) — negative.
- To cash-flow at today's rent, offer at most $141k (12.0% below list).
- To meet the 1% rule (rent ≥ 1% of price), the offer needs to be $127k (20.8% below list).
- Recommended offer: $127k (20.8% below list) — sets the bar for 1% rule.
- Cap rate 5.5% vs local median 2.6% in Sioux Falls — top-decile yield for the area; either an underpriced asset or a hidden risk that comps aren't pricing in. Stress-test before assuming the spread holds.
Location & tenants
- Location reads 85/100 on livability (#3 in SD, #610 nationally) — a professional / high-income tenant draw. Strengths: amenities A+, commute A+, cost of living A+; Watch: crime F.
- Sioux Falls School District 49-5 (urban): math 39% / reading 48% proficiency, ranked #45 of 59 in SD (top 76%) — families likely to look elsewhere, expect single-tenant / working-renter base with shorter leases.
- Zoned schools: Jefferson High School - 67 (1,749 students, 34% FRL) — zoned schools at 34% FRL track the district average.
- Market conditions: Rents rising fast (+7.0%/yr); 153 active listings in the ZIP; 40 comparable units currently listed for rent nearby; rentals at typical pace (median 21d on market — plan ~3-4 weeks tenant-placement turnaround); 2,425 units permitted in Minnehaha County in 2024 (1,367 in 5+ unit buildings).
Forward outlook
- Local home prices are declining (-3.0%/yr); year-one equity from $1k of loan paydown is wiped out by about $5k of value loss. Plan a longer hold.
- Minnehaha County population projected at +46% by 2050 — long-run rental-demand tailwind backs the buy-and-hold thesis.
Negotiation context
- Only 6 days on market — expect competitive offers; lowballing is unlikely to land.
- 3 sale attempts since 8y ago with the ask held roughly flat each time — persistent listings suggest the price (not the market) is what's stuck; bring a comps-based counter.
- Current owner paid $39k; list at $160k implies a 310% gain — meaningful room to come down on a strong offer.
Risks & watch-outs
- Watch-outs: built in 1880 — expect roof / HVAC / electrical / plumbing capex.
Questions for the listing agent
- What do current leases actually rent for vs. the listed asking? Can we see a recent rent roll and the last 12 months of T-12 income?
- Built in 1880 — when were the roof, HVAC, electrical panel, plumbing, and water heater last replaced?
- Is there a deadline driving the sale (1031 exchange, divorce, estate, relocation)? That informs how much negotiation room exists.
- Schools are B-rated — typically a magnet for longer-tenancy family renters. What's the average tenant stay here, and is there a school-zone premium baked into asking?
- Crime grade is F in this area — have there been break-ins, vandalism, or insurance claims at this property in the last 3 years? What carrier currently insures it and at what premium?
- The area grade is low — what's the realistic commute time and amenity access for the typical tenant pool here? Any planned neighborhood developments (good or bad) we should know about?
- What's the average days-on-market for RENTAL listings here right now (not sales)? A rising rental-DOM trend means longer vacancies and softer asking-rent achievability than the comps imply.
- What's the recent tenant-quality profile in this submarket — average credit score on applications, eviction rate, late-payment / NSF rate, and stable-employment percentage? A property-management company in the area should have these aggregated.
- How much new for-sale + rental construction is in the pipeline within 1–3 miles? Heavy new supply typically softens prices + rents 12–24 months out; constrained supply supports both.
Investment metrics
- 1% rule
- 0.79% ✗
- Cap rate
- 5.48%
- Cash-on-cash
- -2.90%
- DSCR
- 0.87
- GRM
- 10.5
CMA / ARV
No comps found within radius.
Projected returns pro-forma
-3.0% appreciation · 6.99% rent growth · sell at horizon
- IRR
- -16.8%
- Equity multiple
- 0.39×
- Total profit
- $-27,497
- Equity at exit
- $23,842
- IRR
- -2.6%
- Equity multiple
- 0.79×
- Total profit
- $-9,186
- Equity at exit
- $13,825
Cash invested: $44,772 (down + closing). Projections, not guarantees.
Landlord ↔ Tenant lean methodology
- Overall (STATE)
- 83 Strongly Landlord-Friendly
- State South Dakota
- 83 Strongly Landlord-Friendly · R+16
- County
- — inherits STATE
- City
- — inherits STATE
ZIP-level market 57104
- Home prices YoY
- -27.1%
- Rents YoY
- 7.0%
- Active inventory
- 153
- Price-to-rent
- 10.5×
Monthly cashflow live
- Estimated rent
- $1,266 high interval (Pro) →
- Mortgage (P&I)
- −$839
- Tax from tax record
- −$203 /mo · $2,436/yr
- Insurance
- −$67
- HOA
- −$0
- Vacancy / Maint / Mgmt
- −$266
- Net cashflow
- $-108
Break-even live
UW: 25.0% down · 7.5% · 30yr · 1.5% tax · 5.0% vac · 8.0% maint · 8.0% mgmt
Financing live
Cash to close
- Down payment
- $39,975
- Closing costs
- $4,797
- Reserves months
- —
- Total cash needed
- —
Loan-product check · same deal, 3 products live
Conventional
25% down · 7.5% · 30yr
- Down + closing
- —
- Monthly P&I
- —
- Monthly cashflow
- —
- DSCR
- —
- Eligible?
- —
Personal DTI + credit; lowest rate.
DSCR
20% down · 8.5% · 30yr
- Down + closing
- —
- Monthly P&I
- —
- Monthly cashflow
- —
- DSCR
- —
- Eligible?
- —
No personal income docs; deal must DSCR.
Hard money
10% down · 12.0% · 12mo
- Down + closing
- —
- Monthly P&I
- —
- Monthly cashflow
- —
- DSCR
- —
- Eligible?
- —
Short-term bridge; refi at stabilization.
Rent comps 40 comps
| Address | Beds | Baths | Sqft | Rent | $/sqft | DOM | Units | Dist |
|---|---|---|---|---|---|---|---|---|
| 915 W 12th St Sioux Falls, SD | 3.0 | 2.0 | 1100 | $1,395 | $1.27 | 21d | 1 | 0.02mi |
| 718 W 12th St Unit 4 Sioux Falls, SD | 2.0 | 1.0 | 1000 | $875 | $0.88 | 21d | 1 | 0.14mi |
| 219 S Menlo Ave Sioux Falls, SD | 1.0–2.0 | 1.0 | 847 | $1,004 | $1.19 | 13d | 4 | 0.16mi |
| 708 S Euclid Ave Sioux Falls, SD | 2.0 | 1.0 | 700 | $899 | $1.28 | 13d | 1 | 0.28mi |
| 1330 W 14th St Sioux Falls, SD | 3.0 | 1.0 | 1032 | $1,499 | $1.45 | 43d | 1 | 0.31mi |
| 203 S Covell Ave Unit 3 Sioux Falls, SD | 2.0 | 1.0 | 750 | $850 | $1.13 | 43d | 1 | 0.32mi |
| 602 W 9th St Sioux Falls, SD | 2.0 | 1.0 | 900 | $1,100 | $1.22 | 13d | 1 | 0.38mi |
| 500 W 16th St Apt 6 Sioux Falls, SD | 2.0 | 1.0 | 725 | $825 | $1.14 | 43d | 1 | 0.40mi |
| 425 W 16th St Unit 427 Sioux Falls, SD | 3.0 | 1.5 | 1200 | $1,200 | $1.00 | 43d | 1 | 0.44mi |
| 1000 S Summit Ave Unit 03 Sioux Falls, SD | 2.0 | 2.0 | 950 | $1,050 | $1.11 | 21d | 1 | 0.48mi |
| 1009 W 7th St Sioux Falls, SD | 2.0 | 1.5 | 1125 | $1,600 | $1.42 | 43d | 1 | 0.49mi |
| 1605 W 10th St Sioux Falls, SD | 2.0 | 1.0 | 1100 | $1,295 | $1.18 | 21d | 1 | 0.53mi |
| 811 S Glendale Ave Sioux Falls, SD | 3.0 | 2.0 | 1368 | $1,650 | $1.21 | 43d | 1 | 0.54mi |
| 633 S Main Ave Unit 2 Sioux Falls, SD | 2.0 | 1.5 | 980 | $950 | $0.97 | 43d | 1 | 0.56mi |
| 647 S Main Ave Sioux Falls, SD | 2.0 | 2.0 | 1224 | $1,097 | $0.90 | 13d | 2 | 0.57mi |
| 101 S Main Ave Sioux Falls, SD | 1.0–2.0 | 1.0–2.0 | 1143 | $2,450 | $2.14 | 43d | 2 | 0.58mi |
| 1733 W 11th St Sioux Falls, SD | 2.0 | 1.0 | 875 | $1,350 | $1.54 | 43d | 1 | 0.61mi |
| 210 W 17th St Sioux Falls, SD | 2.0 | 1.0 | 720 | $1,000 | $1.39 | 43d | 1 | 0.61mi |
| 616 S Western Ave Sioux Falls, SD | 2.0 | 1.0 | 768 | $875 | $1.14 | 21d | 1 | 0.63mi |
| 230 S Phillips Ave Unit 405 Sioux Falls, SD | 2.0 | 1.0 | 925 | $1,625 | $1.76 | 21d | 1 | 0.65mi |
| 112 W 17th St Unit 7 Sioux Falls, SD | 2.0 | 1.0 | 1000 | $1,150 | $1.15 | 43d | 1 | 0.66mi |
| 100 W 17th St Apt 15 Sioux Falls, SD | 2.0 | 1.5 | 1000 | $1,195 | $1.20 | 21d | 1 | 0.69mi |
| 205 E 12th St Sioux Falls, SD | 1.0–2.0 | 1.0–2.0 | 772 | $2,430 | $3.15 | 13d | 28 | 0.71mi |
| 205 W 18th St Sioux Falls, SD | 1.0–2.0 | 1.0 | 1000 | $995 | $0.99 | 21d | 2 | 0.71mi |
| 320 N Western Ave Sioux Falls, SD | 3.0 | 2.0 | 1100 | $1,056 | $0.96 | 43d | 1 | 0.79mi |
| 105 S Lyndale Ave Sioux Falls, SD | 2.0 | 1.0 | 1100 | $1,195 | $1.09 | 43d | 1 | 0.79mi |
| 633 N Menlo Ave Sioux Falls, SD | 4.0 | 1.5 | 1450 | $1,750 | $1.21 | 21d | 1 | 0.82mi |
| 325 E 12th St Sioux Falls, SD | 1.0–2.0 | 1.0–2.0 | 954 | $1,680 | $1.76 | 13d | 11 | 0.82mi |
| 704 N Duluth Ave Sioux Falls, SD | 2.0 | 1.0 | 900 | $2,000 | $2.22 | 43d | 1 | 0.89mi |
| 758 S 3rd Ave Sioux Falls, SD | 2.0 | 1.0 | 900 | $900 | $1.00 | 21d | 1 | 0.92mi |
| 350 N Reid Pl Sioux Falls, SD | 2.0 | 1.0–2.0 | 898 | $3,000 | $3.34 | 13d | 9 | 0.96mi |
| 310 N Reid Pl Sioux Falls, SD | 3.0 | 1.0–3.0 | 1251 | $5,000 | $4.00 | 13d | 7 | 0.96mi |
| 1900 W 6th St Sioux Falls, SD | 2.0 | 1.0 | 813 | $853 | $1.05 | 13d | 1 | 0.97mi |
| 155 E 4th Pl Sioux Falls, SD | 2.0 | 1.0–2.0 | 950 | $3,240 | $3.41 | 13d | 12 | 1.03mi |
| 1906 S Menlo Ave Sioux Falls, SD | 4.0 | 2.0 | 1300 | $1,640 | $1.26 | 43d | 1 | 1.03mi |
| 701 N Phillips Ave Sioux Falls, SD | 2.0 | 1.0–2.5 | 894 | $2,589 | $2.90 | 13d | 17 | 1.08mi |
| 500 S Kiwanis Ave Sioux Falls, SD | 1.0–2.0 | 1.0–2.0 | 859 | $1,045 | $1.22 | 13d | 11 | 1.09mi |
| 1000 N Covell Ave Sioux Falls, SD | 2.0 | 1.0 | 750 | $874 | $1.17 | 21d | 1 | 1.11mi |
| 2000 S Duluth Ave Sioux Falls, SD | 2.0 | 1.0 | 1192 | $1,400 | $1.17 | 21d | 1 | 1.13mi |
| 928 N Spring Ave Sioux Falls, SD | 3.0 | 1.0 | 902 | $1,395 | $1.55 | 21d | 1 | 1.14mi |
Listing history 5 events
-
2026-06-18days on market $159,900 Active 6 DOM
-
2026-06-17days on market $159,900 Active 5 DOM
-
2026-06-16days on market $159,900 Active 4 DOM
-
2026-06-15days on market $159,900 Active 3 DOM
-
2026-06-13$159,900 Active 1 DOM
ⓘ Source: listings_history table (triggers on properties + properties_extension) + one-shot
backfill from property_details.listing_events for pre-trigger history.
Tax reassessment forecast SD · Resets to sale price
- Current annual tax
- $2,436 · $203/mo
- Projected year-2 tax
- $2,436 · $203/mo
- Expected delta
- $0/yr ($0/mo · 0.0%)
ⓘ Screening estimate from a state-policy table — verify with the county assessor before closing.
Climate risk First Street
- Flood 1/10 Low FEMA zone X (unshaded) · 0% chance over 30 yrs
- Wildfire 1/10 Low
- Heat 2/10 Low 7 d/yr ≥99°F today · 13 d/yr by 30 yrs out
- Wind 2/10 Low
- Air quality 2/10 Low 1 unhealthy d/yr today · 1 by 30 yrs out
Nearby sold comps map
Loading sold comps map…
Walkable amenities ~0.75 mi
Loading nearby amenities…
Taxation est. · year 1
- Rental income
- $15,189
- − Mortgage interest
- −$8,957
- − Property taxes
- −$2,436
- − Insurance
- −$800
- − Repairs & maintenance
- −$1,215
- − Management
- −$1,215
- − Depreciation
- −$4,652
- Taxable loss
- −$4,085
- Est. tax savings @ 24.0%
- +$980
- After-tax cash flow
- $-318/yr
For passive investors: Depreciation is non-cash, so a rental often shows a tax loss while cash-flowing — sheltering income. Rental losses are passive: they offset passive income freely, and up to $25,000/yr can offset ordinary (W-2) income if you actively participate and your MAGI is under $100k (phasing out to $0 by $150k); unused losses carry forward. On sale, claimed depreciation is recaptured at up to 25%, and gains may owe capital-gains tax (a 1031 exchange can defer both). Figures are a year-1 estimate at your 24.0% rate — not tax advice; consult a CPA.
Schools (NCES district)
- District
- Sioux Falls School District 49-5
- NCES district ID
- 4666270
- Math proficiency
- 39% ▼ -4.00%
- Reading proficiency
- 48% ▼ -2.00%
- Median HH income
- $51,093
- Composite
- 37.47/100
- National rank
- #4407
- State rank
- #45 of 59 in SD
Livability — Sioux Falls
- Score
- 85/100
- State rank
- #3
- US rank
- #610
Category grades
Schools grade is shown separately in the Schools card above.
Census & demographics
- Census place
- Sioux Falls, SD
- County
- Minnehaha County · 191,523 people
- City population
- 207,623
- Metro
- Sioux Falls, SD
- Population (ZIP)
- 26,963
- Household income
- $57,688
- Rent vs Own
- Severe rent burden
- 1111.0
Population outlook (Minnehaha County) Hauer SSP2
- Today (2025)
- 222,323 people
- By 2030
- 241,430 · +8.6%
- By 2040
- 281,643 · +26.7%
- By 2050
- 325,574 · +46.4%
- By 2075
- 469,313 · +111.1%
- By 2100
- 664,763 · +199.0%
Race, ethnicity, and origin ACS 2023
- Neighborhood character
- Predominantly White (67%)
- Race & ethnicity
- White 67% Black 11% Two or more races 10% Hispanic / Latino 9% Native American 6% Asian 1%
- Hispanic origin (detail)
- Mexican 5%
- Common ancestry
- Portuguese 9% Iranian 3% Italian 1%
- Foreign-born
- 13% · Canada
- Languages at home
- 83% English-only · Spanish 6% Russian/Polish/Slavic 1% Arabic 1%
Political lean MEDSL · Minnehaha
- 2024 margin
- R (+12.7) · D 42.5% · R 55.2% · Other 2.4%
- 2008→2024 swing
- -13.4pp toward R · 2008: 0.7pp · 2024: -12.7pp
- All cycles
- 2024: R+12.7 2020: R+9.5 2016: R+14.6 2012: R+7.4 2008: D+0.7
Not yet ingested
- Civics
- —
Market trends
- HPI YoY
- ▼ -97.10%
- Current HPI
- 261.8359
- Rent YoY
- ▲ 6.99%
- Metro
- Sioux Falls, SD
- State GDP YoY
- ▲ 0.70%
- F500 in state
- 2
Industry mix (Fortune 500 HQ in SD)
| Industry | F500 HQs | Revenue |
|---|---|---|
| Utilities | 1 | $1B |
|
||
Price history
+284.4% since first listed5 events — show timeline
- 2026-06-11 Listed $159,900 REALTOR® Association of the Sioux Empire
- 2019-08-13 Listing Removed — REALTOR® Association of the Sioux Empire
- 2019-07-05 Listed $159,900 REALTOR® Association of the Sioux Empire
- 2018-08-10 Sold (Public Records) $39,000 Public Records
- 2018-05-03 Listed $41,600 REALTOR® Association of the Sioux Empire
Property tax history
+9.2%/yrLatest (2024): $2,436 · +16.3% YoY. Source: county tax records.
Cash-flow waterfall
monthlySold comps — $/sqft
last 12 mo · ≤1 miLoading sold comps…