 🏷️ Likely Rental
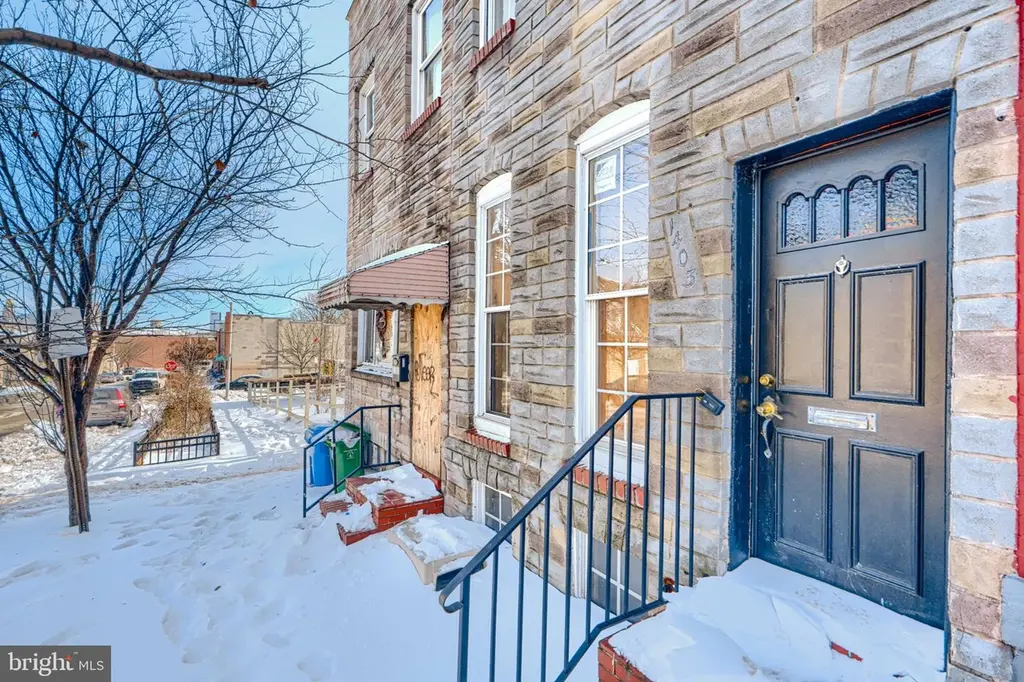
1403 Ramsay St · Baltimore, MD
Flood risk 1/10 · Minimal
- FEMA flood zone
- X (unshaded)
- Chance of flooding over 30 yrs
- 0.0%
- Est. flood insurance / yr
- $473 – $860
Fire risk 1/10 · Minimal
- Est. fire insurance / yr
- $755 – $1,403
Heat risk 7/10 · Major
- Hot days now (above 103°F)
- 7 days/yr
- Hot days in 30 yrs
- 15 days/yr
Wind risk 6/10 · Moderate
- Chance of severe wind over 30 yrs
- 27.0%
Air-quality risk 4/10 · Minor
- Unhealthy air days now
- 6 days/yr
- Unhealthy air days in 30 yrs
- 7 days/yr
Risk factors via First Street. Map © Google.
Why this score? — see what drove the B+ grade
The composite is a weighted blend of 9 inputs, each scored 0–100. Each bar is that input's sub-score; the figure is the points it added to the 100-point composite (weight × sub-score).
- Cash flow +30.0/30.0
- ARV discount +15.0/15.0
- 1% rule +10.0/10.0
- DSCR +10.0/10.0
- Rent growth +4.4/5.0
- Livability +3.8/5.0
- Condition / age +2.5/5.0
- Schools +1.0/10.0
- Appreciation +0.0/10.0
$92,500
🖨 Deal sheet (PDF) 📄 Offer letter ✓ Due diligence
Listing remarks
AGENTS - PLEASE VIEW AGENT REMARKS IN BRIGHT MLS. Great cash flow with guaranteed rent, in Mt. Clair Junction area. Section 8 tenant rented previously, Lead testing done, monitored security system, house shows well. Don't miss it. Offers may be entered ONLINE through Thursday, May 21, 2026 at 1:00 pm. AT SELLER'S DISCRETION, AN OFFER MAY BE ACCEPTED AT ANY TIME.
Key facts
- Built 1900
- Listed 46 days
Property features AI
Finance
- Other: Not in a federal flood zone; In city limits
- Financial info: Ownership interest: ground rent; Ground rent amount: $40 (semi-annually); Land assessed value noted; Improvement assessed value noted
Exterior
- Parking: On-street parking
- Utilities: Public water; Public sewer; Hot water: natural gas; Electric cooling; Natural gas heating
- Home design: Interior townhouse/rowhouse; Year built: estimated
- Construction: Brick/mortar foundation; Above-grade other structures noted
- Exterior features: Brick front; Ground rent exists (semi-annual payment)
Interior
- Bedrooms: 2 bedrooms on the main level
- Bathrooms: 1 full bathroom on the main level
- Heating & cooling: Forced air heating (natural gas); Central air conditioning (electric)
- Interior features: Partially finished basement
Neighborhood map
What this means for you Summary
Snapshot
- This is a 2-bed/1.0-bath townhouse listed at $92k.
Deal economics
- At list price, monthly cash flow is $615 ($7k/yr) — positive.
- The deal already cash-flows at list — no discount required.
- Meets the 1% rule at list price ($2k rent vs $92k).
- Recommended offer: $90k (3.0% below list) — sets the bar for market timing.
Location & tenants
- Location reads 76/100 on livability (#90 in MD, #3,396 nationally) — a middle-class / working-renter tenant base. Strengths: amenities A+, commute A+, housing A+; Watch: crime F.
- Baltimore City Public Schools (urban): math 7% / reading 16% proficiency, ranked #24 of 24 in MD (top 100%) — low school quality limits family demand, transient renter base, plan for 1-2y turnover; 79% free/reduced lunch — lower-income household profile, screen leases tightly.
- Zoned schools: Elmer A. Henderson: A Johns Hopkins Partnership (math 2% / reading 16%, grade F, #650 of 860 statewide, top 77%, 642 students, 80% FRL); Baltimore Polytechnic Institute (math 71% / reading 84%, grade A-, #22 of 222 statewide, top 10%, 1,555 students, 43% FRL) — zoned schools average 62% FRL vs 79% district-wide (17 pts lower); this property's tenant base skews higher-income than the district average.
- Zoned-school proficiency averages 43% at this address vs 12% district-wide (+32 pts) — the actual schools serving this property are materially stronger than the Baltimore City Public Schools average implies; a family-tenant draw the district grade alone would hide.
- Market conditions: Rents rising fast (+7.5%/yr); 425 active listings in the ZIP; 40 comparable units currently listed for rent nearby; rentals at typical pace (median 26d on market — plan ~3-4 weeks tenant-placement turnaround); 1,273 units permitted in Baltimore city in 2024 (1,104 in 5+ unit buildings).
Forward outlook
- Local home prices are declining (-3.0%/yr); year-one equity from $640 of loan paydown is wiped out by about $3k of value loss. Plan a longer hold.
- Baltimore County population projected to shrink 4% by 2050 — rents likely to lag national; underwrite the cash flow, not the appreciation.
- At projected returns (-3.0% appreciation + 7.5% rent growth), your $26k cash investment doubles in ~4 years — after that, you're playing with house money.
Negotiation context
- It's been on market 46 days — a 3% lower offer ($90k) is reasonable based on typical stale-listing flexibility.
- 5 sale attempts since 22y ago with the ask held roughly flat each time — persistent listings suggest the price (not the market) is what's stuck; bring a comps-based counter.
- Current owner paid $4k; list at $92k implies a 2543% gain — meaningful room to come down on a strong offer.
Risks & watch-outs
- Watch-outs: built in 1900 — expect roof / HVAC / electrical / plumbing capex.
- Climate carrying-cost: major wind risk, 27% chance of damaging wind over 30y; extreme-heat days projected 7→15/yr by 2055 (HVAC capex compounding) — expect insurance premiums to compound above CPI over the hold.
Questions for the listing agent
- It's been on market 46 days. Have you received any prior offers? Is the seller open to a 3% concession, seller financing, or rate buy-down credit?
- Built in 1900 — when were the roof, HVAC, electrical panel, plumbing, and water heater last replaced?
- Is there a deadline driving the sale (1031 exchange, divorce, estate, relocation)? That informs how much negotiation room exists.
- Schools are D-rated, which usually means shorter tenancies and higher turnover. Who's the typical renter profile here, and what's been the actual vacancy rate?
- Crime grade is F in this area — have there been break-ins, vandalism, or insurance claims at this property in the last 3 years? What carrier currently insures it and at what premium?
- What's the average days-on-market for RENTAL listings here right now (not sales)? A rising rental-DOM trend means longer vacancies and softer asking-rent achievability than the comps imply.
- What's the recent tenant-quality profile in this submarket — average credit score on applications, eviction rate, late-payment / NSF rate, and stable-employment percentage? A property-management company in the area should have these aggregated.
- How much new for-sale + rental construction is in the pipeline within 1–3 miles? Heavy new supply typically softens prices + rents 12–24 months out; constrained supply supports both.
Investment metrics
- 1% rule
- 1.68% ✓
- Cap rate
- 14.28%
- Cash-on-cash
- 28.51%
- DSCR
- 2.27
- GRM
- 5.0
CMA / ARV
- ARV (median comp)
- $130,888
- List price
- $92,500
- Delta
- -29.33%
- Verdict
- UNDERPRICED
- Comps
- 20 within 1.0 mi
Show comp detail 12 sales within ~0.75 mi
| Address | Dist | Beds/Ba | Sqft | Sold | Price | $/sf | Match |
|---|---|---|---|---|---|---|---|
| 1133 Sargeant St | 0.33mi | 2/1.5 | 912 (+5%) | 2mo | $67,500 | $74 | 73 |
| 1241 W Lombard St | 0.25mi | 2/1.0 | 963 (+11%) | 3mo | $150,000 | $156 | 69 |
| 1121 Cleveland St | 0.48mi | 2/1.0 | 912 (+5%) | 2mo | $109,900 | $121 | 68 |
| 1606 Lemmon St | 0.24mi | 2/1.0 | 744 (-15%) | 1mo | $20,000 | $27 | 64 |
| 1607 Lemmon St | 0.24mi | 1/1.0 (-1) | 974 (+12%) | 1mo | $20,000 | $21 | 64 |
| 1608 Lemmon St | 0.25mi | 2/1.0 | 744 (-15%) | 1mo | $20,000 | $27 | 64 |
| 1610 Lemmon St | 0.25mi | 2/1.0 | 744 (-15%) | 1mo | $20,000 | $27 | 63 |
| 1612 Lemmon St | 0.25mi | 2/1.0 | 744 (-15%) | 1mo | $20,000 | $27 | 63 |
| 1226 W Pratt St | 0.22mi | 2/1.5 | 1,000 (+15%) | 2mo | $80,000 | $80 | 62 |
| 1239 W Lombard St | 0.25mi | 2/1.0 | 1,000 (+15%) | 3mo | $150,000 | $150 | 62 |
| 1604 Lemmon St | 0.24mi | 1/1.0 (-1) | 744 (-15%) | 1mo | $20,000 | $27 | 59 |
| 802 W Barre St | 0.73mi | 3/3.0 (+1) | 990 (+14%) | 3mo | $285,000 | $288 | 27 |
Match score weights: distance 35% · size 25% · config 20% · recency 20%. Top-matched comps best support the ARV.
Projected returns pro-forma
-3.0% appreciation · 7.51% rent growth · sell at horizon
- IRR
- 27.7%
- Equity multiple
- 2.22×
- Total profit
- $31,562
- Equity at exit
- $13,792
- IRR
- 37.7%
- Equity multiple
- 5.29×
- Total profit
- $111,104
- Equity at exit
- $7,998
Cash invested: $25,900 (down + closing). Projections, not guarantees.
Landlord ↔ Tenant lean methodology
- Overall (CITY)
- 12 Strongly Tenant-Friendly
- State Maryland
- 27 Tenant-Leaning · D+14
- County
- — inherits STATE
- City Baltimore
- 12 Strongly Tenant-Friendly · D+58
ZIP-level market 21223
- Rents YoY
- 7.5%
- Active inventory
- 425
- Price-to-rent
- 5.0×
Monthly cashflow live
- Estimated rent
- $1,551 high interval (Pro) →
- Mortgage (P&I)
- −$485
- Tax from tax record
- −$86 /mo · $1,033/yr
- Insurance
- −$39
- HOA
- −$0
- Vacancy / Maint / Mgmt
- −$326
- Net cashflow
- $615
Break-even live
Sensitivity live
| Price | -10% $668 | -5% $641 | +0% $615 | +5% $589 | +10% $563 |
|---|---|---|---|---|---|
| Rent | -10% $493 | -5% $554 | +0% $615 | +5% $677 | +10% $738 |
| Rate | -1.0pp $662 | -0.5pp $639 | base $615 | +0.5pp $591 | +1.0pp $567 |
UW: 25.0% down · 7.5% · 30yr · 1.5% tax · 5.0% vac · 8.0% maint · 8.0% mgmt
Financing live
Cash to close
- Down payment
- $23,125
- Closing costs
- $2,775
- Reserves months
- —
- Total cash needed
- —
Loan-product check · same deal, 3 products live
Conventional
25% down · 7.5% · 30yr
- Down + closing
- —
- Monthly P&I
- —
- Monthly cashflow
- —
- DSCR
- —
- Eligible?
- —
Personal DTI + credit; lowest rate.
DSCR
20% down · 8.5% · 30yr
- Down + closing
- —
- Monthly P&I
- —
- Monthly cashflow
- —
- DSCR
- —
- Eligible?
- —
No personal income docs; deal must DSCR.
Hard money
10% down · 12.0% · 12mo
- Down + closing
- —
- Monthly P&I
- —
- Monthly cashflow
- —
- DSCR
- —
- Eligible?
- —
Short-term bridge; refi at stabilization.
Rent comps 40 comps
| Address | Beds | Baths | Sqft | Rent | $/sqft | DOM | Units | Dist |
|---|---|---|---|---|---|---|---|---|
| 305 S Calhoun St Baltimore, MD | 2.0 | 1.0 | 1000 | $1,300 | $1.30 | 23d | 1 | 0.10mi |
| 1324 W Lombard St Unit 1 Baltimore, MD | 2.0 | 2.0 | 1100 | $1,500 | $1.36 | 25d | 1 | 0.26mi |
| 1324 W Lombard St Unit 2 Baltimore, MD | 2.0 | 1.5 | 1100 | $1,450 | $1.32 | 45d | 1 | 0.27mi |
| 1215 James St Baltimore, MD | 2.0 | 1.0 | 960 | $1,500 | $1.56 | 45d | 1 | 0.27mi |
| 1315 Hollins St Unit 2 Baltimore, MD | 3.0 | 2.0 | 1096 | $1,860 | $1.70 | 6d | 1 | 0.31mi |
| 1315 Hollins St Unit 2 Baltimore, MD | 3.0 | 2.0 | 1096 | $1,950 | $1.78 | 14d | 1 | 0.31mi |
| 1142 Sargeant St Baltimore, MD | 3.0 | 2.0 | 1080 | $1,601 | $1.48 | 4d | 1 | 0.33mi |
| 1142 Sargeant St Baltimore, MD | 3.0 | 2.0 | 1080 | $1,601 | $1.48 | 0d | 1 | 0.33mi |
| 1712 W Lombard St #4 Baltimore, MD | 1.0 | 1.0 | 550 | $900 | $1.64 | 45d | 1 | 0.33mi |
| 1160 Washington Blvd Baltimore, MD | 2.0 | 1.0 | 960 | $1,575 | $1.64 | 25d | 1 | 0.34mi |
| 1127 Sargeant St Baltimore, MD | 2.0 | 1.5 | 1080 | $1,275 | $1.18 | 25d | 1 | 0.34mi |
| 48 S Carrollton Ave Unit 4 Baltimore, MD | 2.0 | 1.0 | 670 | $1,600 | $2.39 | 45d | 1 | 0.35mi |
| 1163 Washington Blvd Baltimore, MD | 2.0 | 2.5 | 1012 | $1,700 | $1.68 | 14d | 1 | 0.36mi |
| 1432 Carroll St Baltimore, MD | 2.0 | 1.5 | 912 | $1,900 | $2.08 | 45d | 1 | 0.37mi |
| 1601 Frederick Ave Unit 3 Baltimore, MD | 2.0 | 1.0 | 1050 | $1,050 | $1.00 | 6d | 1 | 0.38mi |
| 923 McHenry St Baltimore, MD | 3.0 | 1.0 | 1008 | $1,625 | $1.61 | 45d | 1 | 0.41mi |
| 28 N Norris St Baltimore, MD | 1.0 | 2.0 | 700 | $1,450 | $2.07 | 45d | 1 | 0.43mi |
| 1323 W Fayette St Baltimore, MD | 2.0 | 1.0 | 1000 | $1,350 | $1.35 | 0d | 1 | 0.45mi |
| 847 McHenry St Baltimore, MD | 2.0 | 2.0 | 952 | $1,795 | $1.89 | 6d | 1 | 0.47mi |
| 853 Reinhart St Baltimore, MD | 2.0 | 2.5 | 780 | $1,800 | $2.31 | 45d | 1 | 0.51mi |
| 1918 W Baltimore St Baltimore, MD | 2.0–3.0 | 1.0–2.0 | 857 | $1,375 | $1.60 | 45d | 1 | 0.55mi |
| 805 Washington Blvd Unit B Baltimore, MD | 2.0 | 2.0 | 1106 | $1,650 | $1.49 | 22d | 1 | 0.59mi |
| 805 Washington Blvd Unit A Baltimore, MD | 2.0 | 2.0 | 1050 | $1,650 | $1.57 | 45d | 1 | 0.59mi |
| 101 N Schroeder St Baltimore, MD | 3.0 | 1.0–2.0 | 1037 | $2,588 | $2.50 | 0d | 11 | 0.61mi |
| 519 Scott St Unit 1 Baltimore, MD | 2.0 | 2.0 | 800 | $2,000 | $2.50 | 45d | 1 | 0.62mi |
| 776 Washington Blvd Unit 3F Baltimore, MD | 1.0 | 1.0 | 800 | $1,000 | $1.25 | 45d | 1 | 0.62mi |
| 1125 Wicomico St Baltimore, MD | 3.0 | 3.0 | 1068 | $1,955 | $1.83 | 25d | 1 | 0.64mi |
| 802 Mangold St Baltimore, MD | 2.0 | 2.5 | 960 | $2,300 | $2.40 | 0d | 1 | 0.70mi |
| 121 S Fremont Ave Baltimore, MD | 1.0 | 1.0 | 582 | $2,100 | $3.61 | 22d | 5 | 0.73mi |
| 812 S Paca St Baltimore, MD | 3.0 | 2.0 | 990 | $1,500 | $1.52 | 14d | 1 | 0.74mi |
| 725 W Pratt St Baltimore, MD | 1.0 | 1.0 | 584 | $1,925 | $3.29 | 0d | 8 | 0.74mi |
| 666 Melvin Dr Baltimore, MD | 1.0 | 1.5 | 852 | $1,450 | $1.70 | 0d | 1 | 0.79mi |
| 657 Dover St Baltimore, MD | 1.0 | 2.0 | 1080 | $1,400 | $1.30 | 14d | 1 | 0.79mi |
| 653 Dover St Baltimore, MD | 1.0 | 1.5 | 936 | $1,500 | $1.60 | 22d | 1 | 0.80mi |
| 638 S Paca St Unit 2404866494 Baltimore, MD | 3.0 | 1.5 | 1100 | $2,200 | $2.00 | 45d | 1 | 0.80mi |
| 62 N Gorman Ave Baltimore, MD | 3.0 | 2.0 | 1100 | $2,500 | $2.27 | 19d | 1 | 0.85mi |
| 2540 Frederick Ave Baltimore, MD | 3.0 | 1.0 | 1075 | $1,400 | $1.30 | 25d | 1 | 0.90mi |
| 519 W Pratt St Baltimore, MD | 1.0 | 1.0 | 576 | $1,400 | $2.43 | 4d | 2 | 0.93mi |
| 1315 Harlem Ave Unit B Baltimore, MD | 2.0 | 1.0 | 900 | $1,425 | $1.58 | 25d | 1 | 0.94mi |
| 1315 Harlem Ave Unit C Baltimore, MD | 2.0 | 1.0 | 900 | $1,425 | $1.58 | 45d | 1 | 0.94mi |
Listing history 44 events
-
2026-06-21days on market $92,500 Active 46 DOM
-
2026-06-18days on market $92,500 Active 43 DOM
-
2026-06-17days on market $92,500 Active 42 DOM
-
2026-06-16days on market $92,500 Active 41 DOM
-
2026-06-15days on market $92,500 Active 40 DOM
-
2026-06-13days on market $92,500 Active 38 DOM
-
2026-06-09days on market $92,500 Active 34 DOM
-
2026-06-08days on market $92,500 Active 33 DOM
-
2026-06-07days on market $92,500 Active 32 DOM
-
2026-06-04days on market $92,500 Active 29 DOM
-
2026-06-03days on market $92,500 Active 28 DOM
-
2026-06-02days on market $92,500 Active 27 DOM
-
2026-06-01days on market $92,500 Active 26 DOM
-
2026-05-31days on market $92,500 Active 25 DOM
-
2026-05-06historical
-
2026-05-06$95,000 Active 364-char remark
-
2026-04-03price $135,000
-
2026-03-28price $143,000
-
2025-12-16price $143,200
-
2025-10-27$143,500 Active
-
2025-09-12historical
-
2025-09-09price $143,000
-
2025-07-28price $145,500
-
2025-07-01price $155,000
-
2025-06-16price $159,250
-
2025-04-03price $159,500
-
2025-04-03price $167,500
-
2025-03-28price $169,500
-
2025-03-25price $169,999
-
2025-03-20price $172,275
-
2025-03-14price $172,500
-
2025-02-14price $175,000
-
2025-02-06price $179,999
-
2025-01-08price $182,500
-
2024-09-30$189,000 Active
-
2008-09-16soldstatus $3,500
-
2005-11-29soldstatus $77,000
-
2005-10-31soldstatus $77,000
-
2005-09-23historical
-
2005-06-11$82,001
-
2005-02-17soldstatus $40,000
-
2004-12-15soldstatus $40,000
-
2004-10-20historical
-
2004-08-23$40,000
ⓘ Source: listings_history table (triggers on properties + properties_extension) + one-shot
backfill from property_details.listing_events for pre-trigger history.
Tax reassessment forecast MD · Partial reset (capped growth)
- Current annual tax
- $1,033 · $86/mo
- Projected year-2 tax
- $1,033 · $86/mo
- Expected delta
- $0/yr ($0/mo · 0.0%)
ⓘ Screening estimate from a state-policy table — verify with the county assessor before closing.
Climate risk First Street
- Flood 1/10 Low FEMA zone X (unshaded) · 0% chance over 30 yrs
- Wildfire 1/10 Low
- Heat 7/10 Severe 7 d/yr ≥103°F today · 15 d/yr by 30 yrs out
- Wind 6/10 Major 27% chance of damaging wind over 30 yrs
- Air quality 4/10 Moderate 6 unhealthy d/yr today · 7 by 30 yrs out
Nearby sold comps map
Loading sold comps map…
Walkable amenities ~0.75 mi
Loading nearby amenities…
Taxation est. · year 1
- Rental income
- $18,608
- − Mortgage interest
- −$5,181
- − Property taxes
- −$1,033
- − Insurance
- −$462
- − Repairs & maintenance
- −$1,489
- − Management
- −$1,489
- − Depreciation
- −$2,691
- Taxable income
- $6,263
- Est. tax owed @ 24.0%
- −$1,503
- After-tax cash flow
- $5,881/yr
For passive investors: Depreciation is non-cash, so a rental often shows a tax loss while cash-flowing — sheltering income. Rental losses are passive: they offset passive income freely, and up to $25,000/yr can offset ordinary (W-2) income if you actively participate and your MAGI is under $100k (phasing out to $0 by $150k); unused losses carry forward. On sale, claimed depreciation is recaptured at up to 25%, and gains may owe capital-gains tax (a 1031 exchange can defer both). Figures are a year-1 estimate at your 24.0% rate — not tax advice; consult a CPA.
Schools (NCES district)
- District
- Baltimore City Public Schools
- NCES district ID
- 2400090
- Math proficiency
- 7% ▼ -9.00%
- Reading proficiency
- 16% ▼ -5.00%
- Median HH income
- $42,108
- Composite
- 10.08/100
- National rank
- #9805
- State rank
- #24 of 24 in MD
Livability — Baltimore
- Score
- 76/100
- State rank
- #90
- US rank
- #3396
Category grades
Schools grade is shown separately in the Schools card above.
Census & demographics
- Census place
- Baltimore, MD
- County
- Baltimore City · 558,601 people
- City population
- 588,727
- Metro
- Baltimore-Columbia-Towson, MD
- Population (ZIP)
- 19,572
- Household income
- $45,840
- Rent vs Own
- Severe rent burden
- 1755.0
Population outlook (Baltimore County) Hauer SSP2
- Today (2025)
- 624,249 people
- By 2030
- 621,541 · -0.4%
- By 2040
- 609,756 · -2.3%
- By 2050
- 597,249 · -4.3%
- By 2075
- 552,236 · -11.5%
- By 2100
- 513,934 · -17.7%
Race, ethnicity, and origin ACS 2023
- Neighborhood character
- Predominantly Black (72%)
- Race & ethnicity
- Black 72% White 16% Hispanic / Latino 7% Two or more races 6% Asian 1%
- Hispanic origin (detail)
- Mexican 3% Puerto Rican 1%
- Common ancestry
- Romanian 1%
- Foreign-born
- 8% · Canada
- Languages at home
- 90% English-only · Spanish 6% French/Haitian/Cajun 2% Other Indo-European 1%
Political lean MEDSL · Baltimore
- 2024 margin
- Solid D (+73.0) · D 85.2% · R 12.2% · Other 2.6%
- 2008→2024 swing
- -2.5pp toward R · 2008: 75.5pp · 2024: 73.0pp
- All cycles
- 2024: D+73.0 2020: D+76.6 2016: D+74.6 2012: D+76.4 2008: D+75.5
Not yet ingested
- Civics
- —
Market trends
- HPI YoY
- ▼ -97.99%
- Current HPI
- 140.5836
- Rent YoY
- ▲ 7.51%
- Metro
- Baltimore-Columbia-Towson, MD
- State GDP YoY
- ▲ 2.97%
- F500 in state
- 12
Industry mix (Fortune 500 HQ in MD)
| Industry | F500 HQs | Revenue |
|---|---|---|
| Aerospace / Defense | 1 | $71B |
|
||
| Utilities | 1 | $25B |
|
||
| Hotels | 1 | $24B |
|
||
| Consumer Goods | 1 | $7B |
|
||
| Real Estate | 1 | $6B |
|
||
| Chemicals | 1 | $2B |
|
||
Price history
+131.2% since first listed31 events — show timeline
- 2026-05-27 Price Changed $92,500 BRIGHT MLS
- 2026-05-06 Listing Removed — BRIGHT MLS
- 2026-05-06 Listed $95,000 BRIGHT MLS
- 2026-04-03 Price Changed $135,000 BRIGHT MLS
- 2026-03-28 Price Changed $143,000 BRIGHT MLS
- 2025-12-16 Price Changed $143,200 BRIGHT MLS
- 2025-10-27 Listed $143,500 BRIGHT MLS
- 2025-09-12 Listing Removed — BRIGHT MLS
- 2025-09-09 Price Changed $143,000 BRIGHT MLS
- 2025-07-28 Price Changed $145,500 BRIGHT MLS
- 2025-07-01 Price Changed $155,000 BRIGHT MLS
- 2025-06-16 Price Changed $159,250 BRIGHT MLS
- 2025-04-03 Price Changed $159,500 BRIGHT MLS
- 2025-04-03 Price Changed $167,500 BRIGHT MLS
- 2025-03-28 Price Changed $169,500 BRIGHT MLS
- 2025-03-25 Price Changed $169,999 BRIGHT MLS
- 2025-03-20 Price Changed $172,275 BRIGHT MLS
- 2025-03-14 Price Changed $172,500 BRIGHT MLS
- 2025-02-14 Price Changed $175,000 BRIGHT MLS
- 2025-02-06 Price Changed $179,999 BRIGHT MLS
- 2025-01-08 Price Changed $182,500 BRIGHT MLS
- 2024-09-30 Listed $189,000 BRIGHT MLS
- 2008-09-16 Sold (Public Records) $3,500 Public Records
- 2005-11-29 Sold (Public Records) $77,000 Public Records
- 2005-10-31 Sold (MLS) $77,000 MRIS
- 2005-09-23 Delisted — MRIS
- 2005-06-11 Listed $82,001 MRIS
- 2005-02-17 Sold (Public Records) $40,000 Public Records
- 2004-12-15 Sold (MLS) $40,000 MRIS
- 2004-10-20 Delisted — MRIS
- 2004-08-23 Listed $40,000 MRIS
Property tax history
-0.9%/yrLatest (2025): $1,033 · +2.3% YoY. Source: county tax records.
Cash-flow waterfall
monthlySold comps — $/sqft
last 12 mo · ≤1 miLoading sold comps…