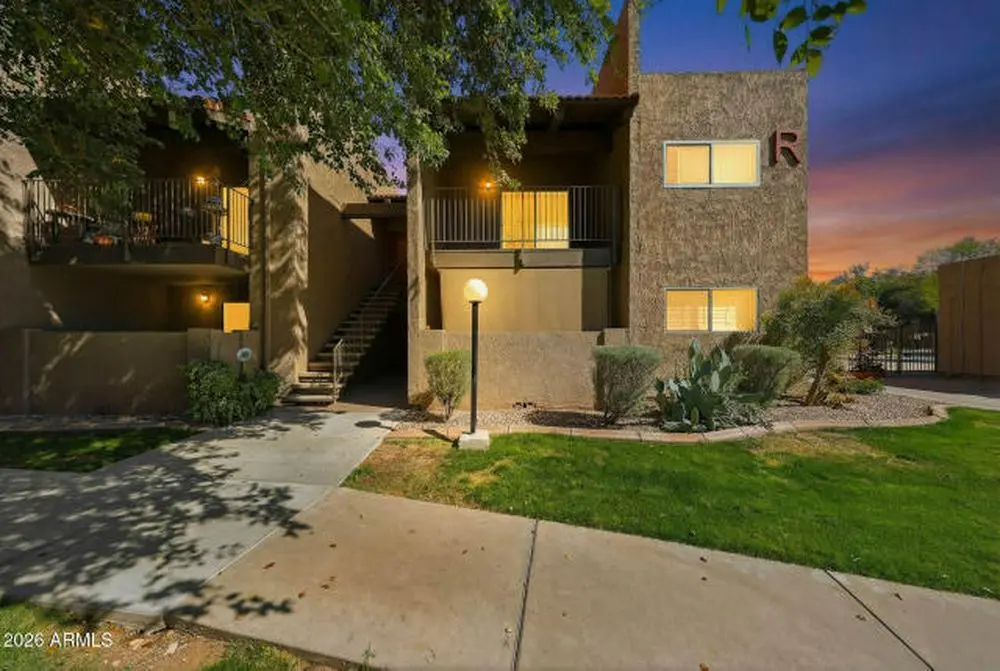
5525 E Thomas Rd · Phoenix, AZ
Flood risk 1/10 · Minimal
- FEMA flood zone
- X (shaded)
- Chance of flooding over 30 yrs
- 0.0%
- Est. flood insurance / yr
- $507 – $1,088
Fire risk 4/10 · Minor
- Est. fire insurance / yr
- $610 – $1,132
Heat risk 9/10 · Severe
- Hot days now (above 111°F)
- 6 days/yr
- Hot days in 30 yrs
- 16 days/yr
Wind risk 1/10 · Minimal
- Chance of severe wind over 30 yrs
- —
Air-quality risk 2/10 · Minimal
- Unhealthy air days now
- 1 days/yr
- Unhealthy air days in 30 yrs
- 1 days/yr
Risk factors via First Street. Map © Google.
Why this score? — see what drove the F grade
The composite is a weighted blend of 9 inputs, each scored 0–100. Each bar is that input's sub-score; the figure is the points it added to the 100-point composite (weight × sub-score).
- Cash flow +8.7/30.0
- ARV discount +7.5/15.0
- Livability +3.8/5.0
- 1% rule +3.3/10.0
- Rent growth +2.5/5.0
- Condition / age +2.5/5.0
- DSCR +2.4/10.0
- Schools +1.1/10.0
- Appreciation +0.0/10.0
$219,990
🖨 Deal sheet (PDF) 📄 Offer letter ✓ Due diligence
Listing remarks MLS
This darling unit is like brand new! All new flooring, all new kitchen w/granite & built-in cabinets for storage. Custom tile backsplash, new appliances, sit up bar. All new doors throughout, new sliding door to patio, all new windows, new plantation shutters, new fans, brand new bathroom with large tiled & glass shower, newer heat pump and AC unit only 5 years old, new 200 amp electrical box with all new breakers. Nice large patio, front entrance closet/storage, nice sized closets w/shelving, new custom paint. Perfect location!! Pool side, (great pool w/spa)next to bbq's, right across from nice laundry facility. You have to see this unit to appreciate it! Perfect lock and leave or full time place to call home!!
Key facts
- Private corner condo
- Laundry facilities
- Modern upgrades
Tags
Property features AI
Exterior
- Home design: Condo
- Construction: Living area approximately 848 (units not specified)
- Exterior features: Lot size approximately 849 (units not specified)
Interior
- Bedrooms: Condo with layout for one or more bedrooms (total living area 848)
Neighborhood map
What this means for you Summary
Snapshot
- This is a 2-bed/1.0-bath condo listed at $220k.
Deal economics
- At list price, monthly cash flow is $-184 ($-2k/yr) — negative.
- The deal already cash-flows at list — no discount required.
- To meet the 1% rule (rent ≥ 1% of price), the offer needs to be $184k (16.5% below list).
- Recommended offer: $184k (16.5% below list) — sets the bar for 1% rule.
- Cap rate 5.3% vs local median 3.3% in Phoenix — top-decile yield for the area; either an underpriced asset or a hidden risk that comps aren't pricing in. Stress-test before assuming the spread holds.
Location & tenants
- Location reads 75/100 on livability (#16 in AZ, #3,924 nationally) — a middle-class / working-renter tenant base. Strengths: amenities A+, commute A+, housing A+; Watch: health & safety C-, crime F.
- Phoenix Union High School District (4286) (urban): math 10% / reading 15% proficiency, ranked #224 of 249 in AZ (top 90%) — low school quality limits family demand, transient renter base, plan for 1-2y turnover.
- Zoned schools: Griffith Elementary School (math 6% / reading 16%, grade F, #980 of 1,109 statewide, top 89%, 489 students, 85% FRL); Pat Tillman Middle School (math 5% / reading 15%, grade F, #188 of 218 statewide, top 88%, 652 students, 100% FRL); Camelback High School (math 6% / reading 7%, grade F, #363 of 381 statewide, top 95%, 2,238 students, 86% FRL).
- Market conditions: Rents flat; 383 active listings in the ZIP; 40 comparable units currently listed for rent nearby; rentals leasing fast (median 1d on market — plan ~1-2 weeks tenant-placement turnaround); solid renter incomes; 36,011 units permitted in Maricopa County in 2024 (12,801 in 5+ unit buildings).
Forward outlook
- Local home prices are declining (-3.0%/yr); year-one equity from $2k of loan paydown is wiped out by about $7k of value loss. Plan a longer hold.
- Maricopa County population projected at +38% by 2050 — long-run rental-demand tailwind backs the buy-and-hold thesis.
Negotiation context
- It's been on market 17 days — a 2% lower offer ($217k) is reasonable based on typical stale-listing flexibility.
- 7 sale attempts since 26y ago with the ask held roughly flat each time — persistent listings suggest the price (not the market) is what's stuck; bring a comps-based counter.
- Current owner paid $163k; 35% above their basis — modest negotiation headroom, anchor on the comps not their cost.
Risks & watch-outs
- Climate carrying-cost: extreme-heat days projected 6→16/yr by 2055 (HVAC capex compounding) — expect insurance premiums to compound above CPI over the hold.
Questions for the listing agent
- What do current leases actually rent for vs. the listed asking? Can we see a recent rent roll and the last 12 months of T-12 income?
- Built in 1974 — when were the roof, HVAC, electrical panel, plumbing, and water heater last replaced?
- What does the HOA fee cover, when was the last increase, and are there any pending special assessments or reserve-fund shortfalls?
- Any open or pending special assessments — roof, HVAC, plumbing, elevator, façade? What's the per-unit balance and payoff schedule, and is the seller paying it off at close or rolling it to the buyer?
- Is there a deadline driving the sale (1031 exchange, divorce, estate, relocation)? That informs how much negotiation room exists.
- Crime grade is F in this area — have there been break-ins, vandalism, or insurance claims at this property in the last 3 years? What carrier currently insures it and at what premium?
- The area grade is low — what's the realistic commute time and amenity access for the typical tenant pool here? Any planned neighborhood developments (good or bad) we should know about?
- What's the average days-on-market for RENTAL listings here right now (not sales)? A rising rental-DOM trend means longer vacancies and softer asking-rent achievability than the comps imply.
- What's the recent tenant-quality profile in this submarket — average credit score on applications, eviction rate, late-payment / NSF rate, and stable-employment percentage? A property-management company in the area should have these aggregated.
- How much new apartment / multifamily construction is in the pipeline within 1–3 miles? Heavy new supply (>2% of stock underway) typically softens rents 12–24 months out; light construction supports rent growth.
Investment metrics
- 1% rule
- 0.83% ✗
- Cap rate
- 5.29%
- Cash-on-cash
- -3.58%
- DSCR
- 0.84
- GRM
- 10.0
CMA / ARV
No comps found within radius.
Projected returns pro-forma
-3.0% appreciation · 0.02% rent growth · sell at horizon
- IRR
- -25.9%
- Equity multiple
- 0.15×
- Total profit
- $-52,596
- Equity at exit
- $32,801
- IRR
- -37.9%
- Equity multiple
- -0.32×
- Total profit
- $-81,139
- Equity at exit
- $19,021
Cash invested: $61,597 (down + closing). Projections, not guarantees.
Landlord ↔ Tenant lean methodology
- Overall (STATE)
- 87 Strongly Landlord-Friendly
- State Arizona
- 87 Strongly Landlord-Friendly · R+3
- County
- — inherits STATE
- City
- — inherits STATE
ZIP-level market 85018
- Rents YoY
- 0.0%
- Active inventory
- 383
- Price-to-rent
- 10.0×
Monthly cashflow live
- Estimated rent
- $1,837 high interval (Pro) →
- Mortgage (P&I)
- −$1,154
- Tax from tax record
- −$48 /mo · $579/yr
- Insurance
- −$92
- HOA est. from 1 same-building comp
- −$341
- Vacancy / Maint / Mgmt
- −$386
- Net cashflow
- $-184
Break-even live
Sensitivity live
| Price | -10% $-59 | -5% $-121 | +0% $-184 | +5% $-246 | +10% $-308 |
|---|---|---|---|---|---|
| Rent | -10% $-329 | -5% $-256 | +0% $-184 | +5% $-111 | +10% $-39 |
| Rate | -1.0pp $-73 | -0.5pp $-128 | base $-184 | +0.5pp $-241 | +1.0pp $-299 |
UW: 25.0% down · 7.5% · 30yr · 1.5% tax · 5.0% vac · 8.0% maint · 8.0% mgmt
Financing live
Cash to close
- Down payment
- $54,998
- Closing costs
- $6,600
- Reserves months
- —
- Total cash needed
- —
Loan-product check · same deal, 3 products live
Conventional
25% down · 7.5% · 30yr
- Down + closing
- —
- Monthly P&I
- —
- Monthly cashflow
- —
- DSCR
- —
- Eligible?
- —
Personal DTI + credit; lowest rate.
DSCR
20% down · 8.5% · 30yr
- Down + closing
- —
- Monthly P&I
- —
- Monthly cashflow
- —
- DSCR
- —
- Eligible?
- —
No personal income docs; deal must DSCR.
Hard money
10% down · 12.0% · 12mo
- Down + closing
- —
- Monthly P&I
- —
- Monthly cashflow
- —
- DSCR
- —
- Eligible?
- —
Short-term bridge; refi at stabilization.
Rent comps 40 comps
| Address | Beds | Baths | Sqft | Rent | $/sqft | DOM | Units | Dist |
|---|---|---|---|---|---|---|---|---|
| 5525 E Thomas Rd Phoenix, AZ | 1.0–2.0 | 1.0–2.0 | 889 | $3,200 | $3.60 | 3d | 5 | 0.02mi |
| 5525 E Thomas Rd Phoenix, AZ | 1.0–2.0 | 1.0–2.0 | 889 | $2,000 | $2.25 | 0d | 4 | 0.02mi |
| 5401 E Thomas Rd Phoenix, AZ | 1.0–2.0 | 1.0–1.5 | 856 | $1,596 | $1.86 | 0d | 9 | 0.13mi |
| 5333 E Thomas Rd Phoenix, AZ | 2.0 | 1.0–2.0 | 612 | $1,450 | $2.37 | 0d | 11 | 0.23mi |
| 5225 E Thomas Rd Phoenix, AZ | 2.0 | 1.0–2.0 | 622 | $1,390 | $2.23 | 0d | 41 | 0.34mi |
| 2535 N 52nd St Phoenix, AZ | 2.0 | 1.0–2.0 | 980 | $1,650 | $1.68 | 0d | 1 | 0.45mi |
| 2525 N 52nd St Unit 5 Phoenix, AZ | 1.0 | 1.0 | 650 | $995 | $1.53 | 0d | 1 | 0.48mi |
| 2930 N 52nd St Phoenix, AZ | 2.0 | 1.0–1.5 | 730 | $1,799 | $2.46 | 1d | 6 | 0.49mi |
| 5900 E Thomas Rd Scottsdale, AZ | 2.0 | 1.0–2.0 | 827 | $1,799 | $2.17 | 1d | 21 | 0.50mi |
| 2338 N 52nd St Unit A Phoenix, AZ | 2.0 | 1.5 | 1100 | $1,650 | $1.50 | 25d | 1 | 0.58mi |
| 5146 E Oak St #208 Phoenix, AZ | 2.0 | 2.0 | 810 | $2,500 | $3.09 | 0d | 1 | 0.62mi |
| 5146 E Oak St Phoenix, AZ | 2.0 | 2.0 | 810 | $2,100 | $2.59 | 16d | 2 | 0.62mi |
| 5024 E Thomas Rd Phoenix, AZ | 2.0 | 1.0 | 600 | $1,295 | $2.16 | 5d | 5 | 0.62mi |
| 2938 N 61st Pl Scottsdale, AZ | 1.0–2.0 | 1.0–2.0 | 851 | $1,499 | $1.76 | 45d | 2 | 0.66mi |
| 2938 N 61st Pl Scottsdale, AZ | 2.0–3.0 | 1.0–1.5 | 1029 | $1,850 | $1.80 | 9d | 1 | 0.66mi |
| 2938 N 61st Pl Scottsdale, AZ | 1.0–2.0 | 1.0–2.0 | 851 | $1,499 | $1.76 | 46d | 2 | 0.66mi |
| 2938 N 61st Pl Scottsdale, AZ | 1.0–2.0 | 1.0 | 861 | $1,850 | $2.15 | 20d | 2 | 0.66mi |
| 6080 E Thomas Rd Scottsdale, AZ | 1.0–2.0 | 1.0–2.0 | 905 | $3,373 | $3.73 | 1d | 20 | 0.68mi |
| 5008 E Thomas Rd Phoenix, AZ | 2.0 | 1.0 | 613 | $1,498 | $2.44 | 1d | 6 | 0.69mi |
| 2938 N 61st Pl #219 Scottsdale, AZ | 3.0 | 1.5 | 1107 | $2,400 | $2.17 | 6d | 1 | 0.72mi |
| 5126 E Monte Vista Rd Phoenix, AZ | 2.0 | 2.0 | 1104 | $1,650 | $1.49 | 0d | 1 | 0.75mi |
| 4902 E Thomas Rd Phoenix, AZ | 2.0 | 1.0 | 690 | $1,365 | $1.98 | 0d | 39 | 0.79mi |
| 2514 N 49th St Apt 2 Phoenix, AZ | 2.0 | 1.0 | 815 | $1,200 | $1.47 | 3d | 1 | 0.86mi |
| 2514 N 49th St Apt 2 Phoenix, AZ | 2.0 | 1.0 | 815 | $1,200 | $1.47 | 0d | 1 | 0.86mi |
| 4819 E Cambridge Ave #1 Phoenix, AZ | 2.0 | 1.0 | 850 | $1,399 | $1.65 | 0d | 1 | 0.88mi |
| 2617 N 48th St Apt 4 Phoenix, AZ | 2.0 | 1.5 | 940 | $1,375 | $1.46 | 3d | 1 | 0.88mi |
| 2523 N 48th Pl Phoenix, AZ | 2.0 | 1.0 | 900 | $1,450 | $1.61 | 9d | 1 | 0.88mi |
| 1835 N 51st St Phoenix, AZ | 2.0 | 2.0 | 940 | $1,295 | $1.38 | 5d | 1 | 0.89mi |
| 2015 N 50th St #34 Phoenix, AZ | 2.0 | 2.5 | 1050 | $2,195 | $2.09 | 0d | 1 | 0.92mi |
| 2547 N 48th St Apt 5 Phoenix, AZ | 1.0 | 1.0 | 700 | $1,245 | $1.78 | 0d | 1 | 0.93mi |
| 2539 N 48th St Phoenix, AZ | 1.0 | 1.0 | 440 | $1,245 | $2.83 | 0d | 2 | 0.94mi |
| 1826 N 51st St Unit 3 Phoenix, AZ | 1.0 | 1.0 | 768 | $1,295 | $1.69 | 23d | 1 | 0.94mi |
| 2015 N 50th St #5 Phoenix, AZ | 2.0 | 2.5 | 1050 | $2,295 | $2.19 | 0d | 1 | 0.95mi |
| 1826 N 51st St Unit 18 Phoenix, AZ | 1.0 | 1.0 | 768 | $1,495 | $1.95 | 3d | 1 | 0.96mi |
| 1826 N 51st St Unit 29 Phoenix, AZ | 1.0 | 1.0 | 768 | $1,295 | $1.69 | 9d | 1 | 0.96mi |
| 1826 N 51st St Unit 23 Phoenix, AZ | 2.0 | 1.0 | 850 | $1,495 | $1.76 | 3d | 1 | 0.96mi |
| 1826 N 51st St Unit 26 Phoenix, AZ | 1.0 | 1.0 | 768 | $1,295 | $1.69 | 0d | 1 | 0.96mi |
| 4917 E Holly St Phoenix, AZ | 2.0 | 2.0 | 925 | $1,445 | $1.56 | 0d | 2 | 0.97mi |
| 1637 N 51st St Phoenix, AZ | 1.0–2.0 | 1.0–2.0 | 707 | $1,445 | $2.04 | 0d | 3 | 0.98mi |
| 1826 N 51st St #1 Phoenix, AZ | 2.0 | 1.0 | 850 | $1,495 | $1.76 | 0d | 1 | 0.98mi |
HOA detail condo
- Monthly dues
- $0 · $0/yr
- Likely covers
- electricpool
- Assessments
- None detected in remarks — confirm with the listing agent.
Listing history 11 events
-
2026-06-21days on market $219,990 Active 17 DOM
-
2026-06-18days on market $219,990 Active 14 DOM
-
2026-06-17days on market $219,990 Active 13 DOM
-
2026-06-16days on market $219,990 Active 12 DOM
-
2026-06-15days on market $219,990 Active 11 DOM
-
2026-06-13days on market $219,990 Active 9 DOM
-
2026-06-09days on market $219,990 Active 5 DOM
-
2026-06-08days on market $219,990 Active 4 DOM
-
2026-06-07days on market $219,990 Active 3 DOM
-
2026-06-04remarks 453-char remark
-
2026-06-04$219,990 Active 1 DOM
ⓘ Source: listings_history table (triggers on properties + properties_extension) + one-shot
backfill from property_details.listing_events for pre-trigger history.
Tax reassessment forecast AZ · Resets to sale price
- Current annual tax
- $579 · $48/mo
- Projected year-2 tax
- $1,452 · $121/mo
- Expected delta
- +$872/yr (+$73/mo · 150.6%)
ⓘ Screening estimate from a state-policy table — verify with the county assessor before closing.
Climate risk First Street
- Flood 1/10 Low FEMA zone X (shaded) · 0% chance over 30 yrs
- Wildfire 4/10 Moderate
- Heat 9/10 Extreme 6 d/yr ≥111°F today · 16 d/yr by 30 yrs out
- Wind 1/10 Low
- Air quality 2/10 Low 1 unhealthy d/yr today · 1 by 30 yrs out
Nearby sold comps map
Loading sold comps map…
Walkable amenities ~0.75 mi
Loading nearby amenities…
Taxation est. · year 1
- Rental income
- $22,039
- − Mortgage interest
- −$12,323
- − Property taxes
- −$579
- − Insurance
- −$1,100
- − Repairs & maintenance
- −$1,763
- − Management
- −$1,763
- − HOA
- −$4,092
- − Depreciation
- −$6,400
- Taxable loss
- −$5,981
- Est. tax savings @ 24.0%
- +$1,435
- After-tax cash flow
- $-769/yr
For passive investors: Depreciation is non-cash, so a rental often shows a tax loss while cash-flowing — sheltering income. Rental losses are passive: they offset passive income freely, and up to $25,000/yr can offset ordinary (W-2) income if you actively participate and your MAGI is under $100k (phasing out to $0 by $150k); unused losses carry forward. On sale, claimed depreciation is recaptured at up to 25%, and gains may owe capital-gains tax (a 1031 exchange can defer both). Figures are a year-1 estimate at your 24.0% rate — not tax advice; consult a CPA.
Schools (NCES district)
- District
- Phoenix Union High School District (4286)
- NCES district ID
- 0406330
- Math proficiency
- 10% ▼ -27.00%
- Reading proficiency
- 15% ▼ -18.00%
- Median HH income
- $39,055
- Composite
- 10.63/100
- National rank
- #9773
- State rank
- #224 of 249 in AZ
Livability — Phoenix
- Score
- 75/100
- State rank
- #16
- US rank
- #3924
Category grades
Schools grade is shown separately in the Schools card above.
Census & demographics
- Census place
- Phoenix, AZ
- County
- Maricopa County · 4,537,380 people
- City population
- 1,500,198
- Metro
- Phoenix-Mesa-Chandler, AZ
- Population (ZIP)
- 37,297
- Household income
- $93,885
- Rent vs Own
- Severe rent burden
- 1649.0
Population outlook (Maricopa County) Hauer SSP2
- Today (2025)
- 4,979,203 people
- By 2030
- 5,378,229 · +8.0%
- By 2040
- 6,156,598 · +23.6%
- By 2050
- 6,872,376 · +38.0%
- By 2075
- 8,401,270 · +68.7%
- By 2100
- 9,247,439 · +85.7%
Race, ethnicity, and origin ACS 2023
- Neighborhood character
- Predominantly White (65%)
- Race & ethnicity
- White 65% Hispanic / Latino 20% Two or more races 15% Black 4% Asian 3%
- Hispanic origin (detail)
- Mexican 17%
- Common ancestry
- Italian 3% Slovak 3% Romanian 3%
- Foreign-born
- 11% · Canada, China, Vietnam
- Languages at home
- 83% English-only · Spanish 12% Other Indo-European 1% German/W. Germanic 1%
Political lean MEDSL · Maricopa
- 2024 margin
- Toss-up / Even · D 47.7% · R 51.2% · Other 1.1%
- 2008→2024 swing
- +7.1pp toward D · 2008: -10.6pp · 2024: -3.5pp
- All cycles
- 2024: R+3.5 2020: D+2.2 2016: R+3.5 2012: R+12.0 2008: R+10.6
Not yet ingested
- Civics
- —
Market trends
- HPI YoY
- ▼ -893.49%
- Current HPI
- 445.5868
- Rent YoY
- ▬ 0.02%
- Metro
- Phoenix-Mesa-Chandler, AZ
- State GDP YoY
- ▲ 4.54%
- F500 in state
- 20
Industry mix (Fortune 500 HQ in AZ)
| Industry | F500 HQs | Revenue |
|---|---|---|
| Technology | 2 | $13B |
|
||
| Mining / Metals | 1 | $23B |
|
||
| Environmental Services | 1 | $16B |
|
||
| Metals / Steel | 1 | $14B |
|
||
| Technology Distribution | 1 | $9B |
|
||
| Homebuilding | 1 | $8B |
|
||
Price history
-97.2% since first listed27 events — show timeline
- 2026-06-04 Listed $219,990 ForSaleByOwner.com
- 2026-05-06 Listing Removed — ARMLS
- 2026-04-23 Price Changed $224,999 ARMLS
- 2026-03-17 Price Changed $229,500 ARMLS
- 2026-02-28 Listed $235,450 ARMLS
- 2020-05-13 Sold (Public Records) $163,000 Public Records
- 2020-05-13 Sold (MLS) $163,000 ARMLS
- 2020-05-07 Pending — ARMLS
- 2020-05-07 Listed $175,000 ARMLS
- 2020-05-06 Sold (MLS) $163,000 ARMLS
- 2020-05-01 Pending — ARMLS
- 2020-04-14 Contingent — ARMLS
- 2020-04-08 Listed $175,000 ARMLS
- 2015-01-28 Sold (Public Records) $73,000 Public Records
- 2015-01-28 Sold (MLS) $73,000 ARMLS
- 2015-01-15 Contingent — ARMLS
- 2014-12-19 Price Changed $75,900 ARMLS
- 2014-10-03 Price Changed $77,500 ARMLS
- 2014-08-30 Listed $78,900 ARMLS
- 2014-06-09 Listing Removed — ARMLS
- 2014-04-10 Price Changed $77,500 ARMLS
- 2014-02-21 Listed $79,000 ARMLS
- 2003-08-05 Listing Removed — ARMLS
- 2001-01-26 Sold (Public Records) $57,000 Public Records
- 2000-10-17 Listed $57,900 ARMLS
- 1991-11-18 Sold (Public Records) $24,000 Public Records
- 1983-07-22 Sold (Public Records) $7,795,000 Public Records
Property tax history
-2.0%/yrLatest (2025): $579 · +6.7% YoY. Source: county tax records.
Cash-flow waterfall
monthlySold comps — $/sqft
last 12 mo · ≤1 miLoading sold comps…