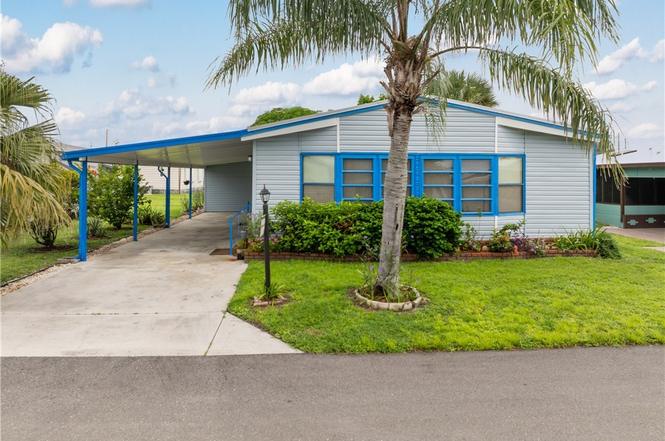
9266 Desoto Dr · North Fort Myers, FL
Flood risk 1/10 · Minimal
- FEMA flood zone
- X (unshaded)
- Chance of flooding over 30 yrs
- 0.0%
- Est. flood insurance / yr
- $507 – $1,088
Fire risk 5/10 · Moderate
- Est. fire insurance / yr
- $947 – $1,759
Heat risk 10/10 · Severe
- Hot days now (above 107°F)
- 7 days/yr
- Hot days in 30 yrs
- 30 days/yr
Wind risk 10/10 · Severe
- Chance of severe wind over 30 yrs
- 99.0%
Air-quality risk 2/10 · Minimal
- Unhealthy air days now
- 1 days/yr
- Unhealthy air days in 30 yrs
- 1 days/yr
Risk factors via First Street. Map © Google.
Why this score? — see what drove the B grade
The composite is a weighted blend of 9 inputs, each scored 0–100. Each bar is that input's sub-score; the figure is the points it added to the 100-point composite (weight × sub-score).
- Cash flow +27.3/30.0
- ARV discount +15.0/15.0
- DSCR +9.5/10.0
- 1% rule +9.1/10.0
- Schools +4.1/10.0
- Livability +3.7/5.0
- Condition / age +2.5/5.0
- Rent growth +2.0/5.0
- Appreciation +0.0/10.0
$124,900
🖨 Deal sheet 📄 Offer letter ✓ Due diligence
Listing remarks
HIGHLY MOTIVATED SELLER will entertain any reasonable offer!!!! Welcome to Tamiami Village, a highly sought-after 55+ community in North Fort Myers! This inviting, spacious 2-bedroom, 2-bath home has been well cared for with a host of recent upgrades, giving you peace of mind for years to come. Notable improvements include a new electric hot water heater and upgraded breaker (May 2024), new siding, carport roof, and gutters (August 2023), new skylight (2022), durable metal roof (2018), and updated bathroom fixtures (2023). The kitchen features a newer refrigerator (~2018), and the home is kept cool and comfortable with a reliable A/C installed in 2015. Plus, you’ll appreciate the indo
Key facts
- Carport roof
- New siding
- New gutters
Tags
Property features AI
Finance
- Financial info: Pets allowed with conditions (up to 2 pets, max 25 lbs)
- HOA & community: HOA with monthly fee; Association fee covers management, legal/accounting, reserve fund, road maintenance, and trash; Community amenities including clubhouse, pool, spa/hot tub, fitness center, library, billiards/billiard room, shuffleboard court, and dog park; Street lights in the community; 701 units in the community
Exterior
- Parking: Attached carport; 2 covered spaces; 2-car carport
- Utilities: Public water; Public sewer; Cable not available
- Home design: Manufactured home; Single-story; Entry level 1; Faces south; Located in a senior community; Zoned MH-1; On-site management
- Construction: Metal roof; Vinyl siding; Resale condition
- Exterior features: Storage; Community pool
Interior
- Kitchen: Electric cooktop; Dishwasher; Refrigerator; Freezer
- Flooring: Carpet; Laminate
- Bathrooms: 2 full bathrooms
- Heating & cooling: Central heating (electric); Central air; Ceiling fan(s)
- Interior features: Vaulted ceilings; Separate shower; Shower only; Single-hung windows; Unfurnished
- Laundry & utility: Inside laundry; Washer; Dryer; Tankless water heater
Neighborhood map
What this means for you Summary
Snapshot
- This is a 2-bed/2.0-bath manufactured listed at $125k.
Deal economics
- At list price, monthly cash flow is $360 ($4k/yr) — positive.
- The deal already cash-flows at list — no discount required.
- Meets the 1% rule at list price ($2k rent vs $125k).
- Recommended offer: $110k (12.0% below list) — sets the bar for market timing.
- Cap rate 9.8% vs local median 3.6% in North Fort Myers — top-decile yield for the area; either an underpriced asset or a hidden risk that comps aren't pricing in. Stress-test before assuming the spread holds.
Location & tenants
- Location reads 74/100 on livability (#269 in FL, #4,409 nationally) — a middle-class / working-renter tenant base. Strengths: cost of living A+, housing A+, health & safety A+; Watch: employment C-, amenities F, commute F.
- Lee (suburban): math 47% / reading 50% proficiency, ranked #42 of 73 in FL (top 58%) — families likely to look elsewhere, expect single-tenant / working-renter base with shorter leases.
- Market conditions: Rents soft (-1.9%/yr); 472 active listings in the ZIP; 40 comparable units currently listed for rent nearby; rentals at typical pace (median 16d on market — plan ~3-4 weeks tenant-placement turnaround); 15,411 units permitted in Lee County in 2024 (4,686 in 5+ unit buildings).
- This rent runs 37% of the median local income ($57k/yr) — at the standard rent-burdened threshold; future hikes will face affordability resistance.
Forward outlook
- Local home prices are declining (-3.0%/yr); year-one equity from $864 of loan paydown is wiped out by about $4k of value loss. Plan a longer hold.
- Lee County population projected at +44% by 2050 — long-run rental-demand tailwind backs the buy-and-hold thesis.
Negotiation context
- It's been on market 268 days — a 12% lower offer ($110k) is reasonable based on typical stale-listing flexibility.
Risks & watch-outs
- Climate carrying-cost: severe wind risk, 99% chance of damaging wind over 30y; moderate wildfire risk; extreme-heat days projected 7→30/yr by 2055 (HVAC capex compounding) — expect insurance premiums to compound above CPI over the hold.
Questions for the listing agent
- It's been on market 268 days. Have you received any prior offers? Is the seller open to a 12% concession, seller financing, or rate buy-down credit?
- What does the HOA fee cover, when was the last increase, and are there any pending special assessments or reserve-fund shortfalls?
- Why hasn't it sold? Are there any deal-killer items the seller is aware of (foundation, flood, title, zoning, code violations)?
- Is there a deadline driving the sale (1031 exchange, divorce, estate, relocation)? That informs how much negotiation room exists.
- What's the average days-on-market for RENTAL listings here right now (not sales)? A rising rental-DOM trend means longer vacancies and softer asking-rent achievability than the comps imply.
- What's the recent tenant-quality profile in this submarket — average credit score on applications, eviction rate, late-payment / NSF rate, and stable-employment percentage? A property-management company in the area should have these aggregated.
- How much new for-sale + rental construction is in the pipeline within 1–3 miles? Heavy new supply typically softens prices + rents 12–24 months out; constrained supply supports both.
Investment metrics
- 1% rule
- 1.41% ✓
- Cap rate
- 9.75%
- Cash-on-cash
- 12.36%
- DSCR
- 1.55
- GRM
- 5.9
CMA / ARV
- ARV (on-the-fly)
- $151,580
- Comps found
- 8
Show comp detail 8 sales within ~0.75 mi
| Address | Dist | Beds/Ba | Sqft | Sold | Price | $/sf | Match |
|---|---|---|---|---|---|---|---|
| 192 Sun Dr | 0.17mi | 2/2.0 | 1,371 (-4%) | 3mo | $133,000 | $97 | 82 |
| 9060 Flamingo Cir | 0.15mi | 2/2.0 | 1,341 (-6%) | 16mo | $136,000 | $101 | 70 |
| 387 Horizon Dr | 0.43mi | 2/2.0 | 1,458 (+2%) | 9mo | $160,000 | $110 | 69 |
| 321 Sunshine Ave | 0.35mi | 2/2.0 | 1,456 (+2%) | 15mo | $177,000 | $122 | 68 |
| 9209 Bonita Dr | 0.06mi | 2/2.0 | 1,274 (-11%) | 14mo | $135,000 | $106 | 67 |
| 16042 Citron Way | 0.28mi | 2/2.0 | 1,288 (-10%) | 4mo | $132,000 | $102 | 67 |
| 323 Sunshine Ave | 0.34mi | 2/2.0 | 1,472 (+3%) | 16mo | $165,500 | $112 | 66 |
| 568 Hogan Dr | 0.61mi | 2/2.0 | 1,272 (-11%) | 3mo | $63,000 | $50 | 50 |
Match score weights: distance 35% · size 25% · config 20% · recency 20%. Top-matched comps best support the ARV.
Projected returns pro-forma
-3.0% appreciation · 0.0% rent growth · sell at horizon
- IRR
- -1.8%
- Equity multiple
- 0.93×
- Total profit
- $-2,317
- Equity at exit
- $18,623
- IRR
- 3.8%
- Equity multiple
- 1.23×
- Total profit
- $8,150
- Equity at exit
- $10,799
Cash invested: $34,972 (down + closing). Projections, not guarantees.
Landlord ↔ Tenant lean methodology
- Overall (STATE)
- 87 Strongly Landlord-Friendly
- State Florida
- 87 Strongly Landlord-Friendly · R+3
- County
- — inherits STATE
- City
- — inherits STATE
ZIP-level market 33903
- Rents YoY
- -1.9%
- Active inventory
- 472
- Price-to-rent
- 5.9×
Monthly cashflow live
- Estimated rent
- $1,756 high interval (Pro) →
- Mortgage (P&I)
- −$655
- Tax from tax record
- −$26 /mo · $315/yr
- Insurance
- −$52
- HOA
- −$294
- Vacancy / Maint / Mgmt
- −$369
- Net cashflow
- $360
Break-even live
UW: 25.0% down · 7.5% · 30yr · 1.5% tax · 5.0% vac · 8.0% maint · 8.0% mgmt
Financing live
Cash to close
- Down payment
- $31,225
- Closing costs
- $3,747
- Reserves months
- —
- Total cash needed
- —
Loan-product check · same deal, 3 products live
Conventional
25% down · 7.5% · 30yr
- Down + closing
- —
- Monthly P&I
- —
- Monthly cashflow
- —
- DSCR
- —
- Eligible?
- —
Personal DTI + credit; lowest rate.
DSCR
20% down · 8.5% · 30yr
- Down + closing
- —
- Monthly P&I
- —
- Monthly cashflow
- —
- DSCR
- —
- Eligible?
- —
No personal income docs; deal must DSCR.
Hard money
10% down · 12.0% · 12mo
- Down + closing
- —
- Monthly P&I
- —
- Monthly cashflow
- —
- DSCR
- —
- Eligible?
- —
Short-term bridge; refi at stabilization.
Rent comps 40 comps
| Address | Beds | Baths | Sqft | Rent | $/sqft | DOM | Units | Dist |
|---|---|---|---|---|---|---|---|---|
| 3404 Rainbow Ln North Fort Myers, FL | 2.0 | 2.0 | 1056 | $1,800 | $1.70 | 3d | 1 | 0.24mi |
| 2864 Star Coral Dr Unit Na North Fort Myers, FL | 3.0 | 2.0 | 1614 | $1,999 | $1.24 | 24d | 1 | 0.40mi |
| 28 Nyborg Ave North Fort Myers, FL | 3.0 | 2.0 | 1042 | $1,299 | $1.25 | 14d | 1 | 0.45mi |
| 571 Sunrise Ln North Fort Myers, FL | 2.0 | 2.0 | 1004 | $1,400 | $1.39 | 24d | 1 | 0.49mi |
| 8791 Littleton Rd North Fort Myers, FL | 2.0 | 2.0 | 1074 | $1,549 | $1.44 | 24d | 1 | 0.59mi |
| 3153 Cozumel Ct Cape Coral, FL | 3.0 | 2.0 | 1747 | $2,000 | $1.14 | 14d | 1 | 0.67mi |
| 2497 Ciales Ct Cape Coral, FL | 3.0 | 2.0 | 1747 | $1,850 | $1.06 | 16d | 1 | 0.80mi |
| 3187 Cozumel Ct Cape Coral, FL | 3.0 | 2.0 | 1747 | $2,000 | $1.14 | 3d | 1 | 0.87mi |
| 3420 Cancun Ct Cape Coral, FL | 3.0 | 2.0 | 1747 | $1,895 | $1.08 | 14d | 1 | 1.01mi |
| 2774 Wedgewood Dr North Fort Myers, FL | 2.0 | 2.0 | 880 | $1,300 | $1.48 | 24d | 1 | 1.04mi |
| 2700 Diplomat Pkwy E Cape Coral, FL | 1.0–3.0 | 1.0–2.0 | 1116 | $2,382 | $2.13 | 3d | 41 | 1.09mi |
| 3440 Cancun Ct Cape Coral, FL | 3.0 | 2.0 | 1747 | $1,950 | $1.12 | 24d | 1 | 1.09mi |
| 3260 Stockton St North Fort Myers, FL | 3.0 | 1.0–2.0 | 976 | $2,371 | $2.43 | 2d | 27 | 1.10mi |
| 266 Mongoose Ln #266 North Fort Myers, FL | 3.0 | 2.0 | 1372 | $1,499 | $1.09 | 3d | 1 | 1.10mi |
| 3141 Amadora Cir Cape Coral, FL | 3.0 | 2.0 | 1816 | $2,295 | $1.26 | 3d | 1 | 1.18mi |
| 3141 Amadora Cir Cape Coral, FL | 3.0 | 2.0 | 1816 | $2,295 | $1.26 | 14d | 1 | 1.18mi |
| 4120 Pine Drop Ln North Fort Myers, FL | 3.0 | 2.0 | 957 | $1,895 | $1.98 | 24d | 1 | 1.27mi |
| 3957 Pomodoro Cir #301 Cape Coral, FL | 2.0 | 2.0 | 1270 | $1,450 | $1.14 | 16d | 1 | 1.29mi |
| 3953 Pomodoro Cir Cape Coral, FL | 1.0–3.0 | 1.0–2.0 | 1044 | $1,462 | $1.40 | 14d | 9 | 1.29mi |
| 538 State St North Fort Myers, FL | 3.0 | 1.5 | 1000 | $1,199 | $1.20 | 24d | 1 | 1.30mi |
| 2116 NE 25th St Cape Coral, FL | 3.0 | 2.0 | 1352 | $1,891 | $1.40 | 3d | 1 | 1.32mi |
| 3961 Pomodoro Cir #204 Cape Coral, FL | 2.0 | 2.0 | 1270 | $1,450 | $1.14 | 24d | 1 | 1.32mi |
| 3961 Pomodoro Cir #204 Cape Coral, FL | 2.0 | 2.0 | 1270 | $1,450 | $1.14 | 16d | 1 | 1.32mi |
| 3940 Villa Del Mar CIR Cape Coral, FL | 1.0–3.0 | 1.0–2.0 | 1051 | $2,116 | $2.01 | 2d | 21 | 1.33mi |
| 3358 Sabal Springs Blvd North Fort Myers, FL | 3.0 | 2.0 | 1621 | $2,200 | $1.36 | 24d | 1 | 1.35mi |
| 3944 Pomodoro Cir #202 Cape Coral, FL | 3.0 | 2.0 | 1411 | $2,200 | $1.56 | 24d | 1 | 1.36mi |
| 2116 NE 22nd Ave Cape Coral, FL | 3.0 | 2.0 | 1759 | $2,195 | $1.25 | 3d | 1 | 1.38mi |
| 2116 NE 22nd Ave Cape Coral, FL | 3.0 | 2.0 | 1759 | $2,200 | $1.25 | 16d | 1 | 1.38mi |
| 3940 Pomodoro Cir Cape Coral, FL | 2.0 | 2.0 | 1270 | $1,475 | $1.16 | 3d | 2 | 1.39mi |
| 2904 Tuscan Dr #303 Cape Coral, FL | 2.0 | 2.0 | 1460 | $1,450 | $0.99 | 24d | 1 | 1.39mi |
| 3968 Pomodoro Cir #202 Cape Coral, FL | 2.0 | 2.0 | 1469 | $1,475 | $1.00 | 14d | 1 | 1.41mi |
| 260 Stockton St North Fort Myers, FL | 2.0 | 2.0 | 924 | $1,200 | $1.30 | 3d | 1 | 1.43mi |
| 2909 Tuscan Dr Cape Coral, FL | 2.0 | 2.0 | 1469 | $1,475 | $1.00 | 24d | 2 | 1.44mi |
| 3973 Pomodoro Cir Cape Coral, FL | 2.0 | 2.0 | 1469 | $1,498 | $1.02 | 24d | 2 | 1.44mi |
| 3973 Pomodoro Cir Cape Coral, FL | 2.0 | 2.0 | 1534 | $1,575 | $1.03 | 3d | 3 | 1.44mi |
| 248 Stockton St North Fort Myers, FL | 3.0 | 2.0 | 924 | $1,300 | $1.41 | 24d | 1 | 1.44mi |
| 2913 Tuscan Dr #102 Cape Coral, FL | 2.0 | 2.0 | 1469 | $1,450 | $0.99 | 24d | 1 | 1.45mi |
| 3050 Steeple Cir Cape Coral, FL | 1.0–3.0 | 1.0–2.0 | 1003 | $1,668 | $1.66 | 3d | 27 | 1.45mi |
| 247 Stockton St North Fort Myers, FL | 3.0 | 2.0 | 924 | $1,325 | $1.43 | 24d | 1 | 1.46mi |
| 446 San Bernardino St North Fort Myers, FL | 2.0 | 1.0 | 1104 | $1,590 | $1.44 | 10d | 1 | 1.47mi |
HOA detail
- Monthly dues
- $294 · $3,528/yr
- Likely covers
- waterelectric
Listing history 11 events
-
2026-06-17days on market $124,900 Active 268 DOM
-
2026-06-16days on market $124,900 Active 267 DOM
-
2026-06-16days on market $124,900 Active 266 DOM
-
2026-06-13days on market $124,900 Active 264 DOM
-
2026-06-09days on market $124,900 Active 260 DOM
-
2026-06-07days on market $124,900 Active 258 DOM
-
2026-06-02days on market $124,900 Active 253 DOM
-
2026-06-01days on market $124,900 Active 252 DOM
-
2026-06-01days on market $124,900 Active 251 DOM
-
2025-12-11price $124,900
-
2025-09-17$129,900 Active
ⓘ Source: listings_history table (triggers on properties + properties_extension) + one-shot
backfill from property_details.listing_events for pre-trigger history.
Tax reassessment forecast FL · Resets to sale price
- Current annual tax
- $315 · $26/mo
- Projected year-2 tax
- $1,037 · $86/mo
- Expected delta
- +$722/yr (+$60/mo · 229.3%)
ⓘ Screening estimate from a state-policy table — verify with the county assessor before closing.
Climate risk First Street
- Flood 1/10 Low FEMA zone X (unshaded) · 0% chance over 30 yrs
- Wildfire 5/10 Major
- Heat 10/10 Extreme 7 d/yr ≥107°F today · 30 d/yr by 30 yrs out
- Wind 10/10 Extreme 99% chance of damaging wind over 30 yrs
- Air quality 2/10 Low 1 unhealthy d/yr today · 1 by 30 yrs out
Nearby sold comps map
Loading sold comps map…
Walkable amenities ~0.75 mi
Loading nearby amenities…
Taxation est. · year 1
- Rental income
- $21,075
- − Mortgage interest
- −$6,996
- − Property taxes
- −$315
- − Insurance
- −$624
- − Repairs & maintenance
- −$1,686
- − Management
- −$1,686
- − HOA
- −$3,528
- − Depreciation
- −$3,633
- Taxable income
- $2,606
- Est. tax owed @ 24.0%
- −$626
- After-tax cash flow
- $3,697/yr
For passive investors: Depreciation is non-cash, so a rental often shows a tax loss while cash-flowing — sheltering income. Rental losses are passive: they offset passive income freely, and up to $25,000/yr can offset ordinary (W-2) income if you actively participate and your MAGI is under $100k (phasing out to $0 by $150k); unused losses carry forward. On sale, claimed depreciation is recaptured at up to 25%, and gains may owe capital-gains tax (a 1031 exchange can defer both). Figures are a year-1 estimate at your 24.0% rate — not tax advice; consult a CPA.
Schools (NCES district)
- District
- Lee
- NCES district ID
- 1201080
- Math proficiency
- 47% ▼ -11.00%
- Reading proficiency
- 50% ▼ -4.00%
- Median HH income
- $49,518
- Composite
- 41.49/100
- National rank
- #3458
- State rank
- #42 of 73 in FL
Livability — North Fort Myers
- Score
- 74/100
- State rank
- #269
- US rank
- #4409
Category grades
Schools grade is shown separately in the Schools card above.
Census & demographics
- Census place
- North Fort Myers, FL
- County
- Lee County · 788,662 people
- City population
- 57,035
- Metro
- Cape Coral-Fort Myers, FL
- Population (ZIP)
- 23,655
- Household income
- $56,993
- Rent vs Own
- Severe rent burden
- 468.0
Population outlook (Lee County) Hauer SSP2
- Today (2025)
- 871,946 people
- By 2030
- 955,468 · +9.6%
- By 2040
- 1,113,587 · +27.7%
- By 2050
- 1,256,891 · +44.1%
- By 2075
- 1,560,270 · +78.9%
- By 2100
- 1,726,848 · +98.0%
Race, ethnicity, and origin ACS 2023
- Neighborhood character
- Predominantly White (81%)
- Race & ethnicity
- White 81% Hispanic / Latino 14% Two or more races 8% Black 2%
- Hispanic origin (detail)
- Mexican 3% Puerto Rican 3% Cuban 3%
- Common ancestry
- Lithuanian 4% Romanian 4% Italian 3%
- Foreign-born
- 11% · Canada
- Languages at home
- 88% English-only · Spanish 9% Other Indo-European 1%
Political lean MEDSL · Lee
- 2024 margin
- Strong R (+28.4) · D 35.5% · R 63.9%
- 2008→2024 swing
- -18.0pp toward R · 2008: -10.4pp · 2024: -28.4pp
- All cycles
- 2024: R+28.4 2020: R+19.2 2016: R+20.4 2012: R+16.6 2008: R+10.4
Not yet ingested
- Civics
- —
Market trends
- HPI YoY
- ▼ -172.26%
- Current HPI
- 256.773
- Rent YoY
- ▼ -1.94%
- Metro
- Cape Coral-Fort Myers, FL
- State GDP YoY
- ▲ 3.28%
- F500 in state
- 36
Industry mix (Fortune 500 HQ in FL)
| Industry | F500 HQs | Revenue |
|---|---|---|
| Industrial Technology | 2 | $29B |
|
||
| Insurance | 2 | $17B |
|
||
| Retail | 1 | $60B |
|
||
| Technology Distribution | 1 | $58B |
|
||
| Homebuilding | 1 | $35B |
|
||
| Technology Manufacturing | 1 | $35B |
|
||
Price history
-3.8% since first listed2 events — show timeline
- 2025-12-11 Price Changed $124,900 FORTMLS
- 2025-09-17 Listed $129,900 FORTMLS
Property tax history
-4.0%/yrLatest (2025): $315 · +2.8% YoY. Source: county tax records.
Cash-flow waterfall
monthlySold comps — $/sqft
last 12 mo · ≤1 miLoading sold comps…