268 Halifax Ln · Chelsea, AL
Flood risk 1/10 · Minimal
- FEMA flood zone
- X (unshaded)
- Chance of flooding over 30 yrs
- 0.0%
- Est. flood insurance / yr
- $507 – $1,088
Fire risk 5/10 · Moderate
- Est. fire insurance / yr
- $916 – $1,700
Heat risk 6/10 · Moderate
- Hot days now (above 107°F)
- 7 days/yr
- Hot days in 30 yrs
- 19 days/yr
Wind risk 6/10 · Moderate
- Chance of severe wind over 30 yrs
- 27.0%
Air-quality risk 3/10 · Minor
- Unhealthy air days now
- 3 days/yr
- Unhealthy air days in 30 yrs
- 4 days/yr
Risk factors via First Street. Map © Google.
Why this score? — see what drove the D grade
The composite is a weighted blend of 9 inputs, each scored 0–100. Each bar is that input's sub-score; the figure is the points it added to the 100-point composite (weight × sub-score).
- Cash flow +11.2/30.0
- ARV discount +8.4/15.0
- Condition / age +4.0/5.0
- Schools +3.9/10.0
- Livability +3.5/5.0
- 1% rule +3.4/10.0
- DSCR +3.3/10.0
- Rent growth +2.5/5.0
- Appreciation +0.0/10.0
$339,900
🖨 Deal sheet 📄 Offer letter ✓ Due diligence
Listing remarks MLS
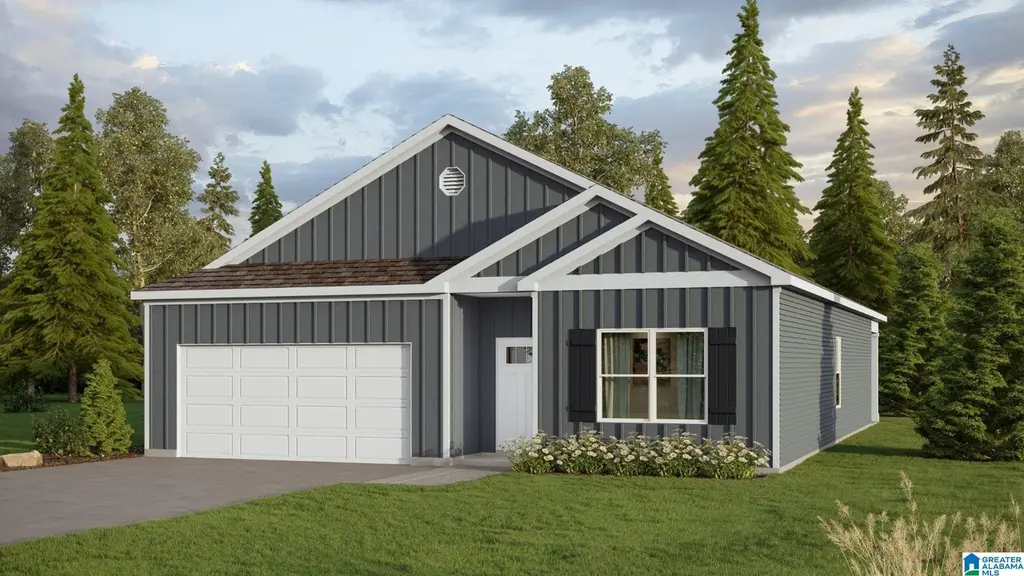
Ask about our interest rates, paid closing cost and easily added options. The one-level Cali plan provides an efficient, four-bedroom, two-bath design in 1,774 square feet. One of the unique features is the integration of the kitchen, breakfast area and great room in an open concept design perfect for entertaining. Enjoy early morning coffee or quiet evenings under the shaded covered patio. The bedroom on-suite is your private getaway with a shower, double vanity and large walk-in closet. A two-car garage, laundry room and pantry provide utility and storage. Quality materials and workmanship throughout, with superior attention to detail, plus a one-year builders' warranty. Your new home also includes our smart home technology package!
Key facts
- Shaded covered patio
- Open concept design
- 6,969 sq ft lot
Tags
Neighborhood map
What this means for you Summary
Snapshot
- This is a 4-bed/2.0-bath single-family listed at $340k. Condition is rated good.
Deal economics
- At list price, monthly cash flow is $-129 ($-2k/yr) — negative.
- To cash-flow at today's rent, offer at most $321k (5.5% below list).
- To meet the 1% rule (rent ≥ 1% of price), the offer needs to be $286k (15.9% below list).
- Recommended offer: $286k (15.9% below list) — sets the bar for 1% rule.
- Cap rate 5.8% vs local median 4.1% in Chelsea — top-decile yield for the area; either an underpriced asset or a hidden risk that comps aren't pricing in. Stress-test before assuming the spread holds.
Location & tenants
- Location reads 69/100 on livability (#52 in AL) — a middle-class / working-renter tenant base. Strengths: crime A+, employment A+, housing A+; Watch: amenities F, commute F, health & safety F.
- Shelby County (suburban): math 30% / reading 58% proficiency, ranked #16 of 129 in AL (top 12%) — families likely to look elsewhere, expect single-tenant / working-renter base with shorter leases.
- Market conditions: 287 active listings in the ZIP; 2 comparable units currently listed for rent nearby; 987 units permitted in Shelby County in 2024 (0 in 5+ unit buildings).
Forward outlook
- Local home prices are declining (-3.0%/yr); year-one equity from $2k of loan paydown is wiped out by about $10k of value loss. Plan a longer hold.
- Shelby County population projected at +23% by 2050 — long-run rental-demand tailwind backs the buy-and-hold thesis.
Negotiation context
- It's been on market 85 days — a 6% lower offer ($320k) is reasonable based on typical stale-listing flexibility.
Risks & watch-outs
- Climate carrying-cost: major wind risk, 27% chance of damaging wind over 30y; moderate wildfire risk; extreme-heat days projected 7→19/yr by 2055 (HVAC capex compounding) — expect insurance premiums to compound above CPI over the hold.
Questions for the listing agent
- What do current leases actually rent for vs. the listed asking? Can we see a recent rent roll and the last 12 months of T-12 income?
- It's been on market 85 days. Have you received any prior offers? Is the seller open to a 16% concession, seller financing, or rate buy-down credit?
- What does the HOA fee cover, when was the last increase, and are there any pending special assessments or reserve-fund shortfalls?
- Why hasn't it sold? Are there any deal-killer items the seller is aware of (foundation, flood, title, zoning, code violations)?
- Is there a deadline driving the sale (1031 exchange, divorce, estate, relocation)? That informs how much negotiation room exists.
- Schools are B-rated — typically a magnet for longer-tenancy family renters. What's the average tenant stay here, and is there a school-zone premium baked into asking?
- The area grade is low — what's the realistic commute time and amenity access for the typical tenant pool here? Any planned neighborhood developments (good or bad) we should know about?
- What's the average days-on-market for RENTAL listings here right now (not sales)? A rising rental-DOM trend means longer vacancies and softer asking-rent achievability than the comps imply.
- What's the recent tenant-quality profile in this submarket — average credit score on applications, eviction rate, late-payment / NSF rate, and stable-employment percentage? A property-management company in the area should have these aggregated.
- How much new for-sale + rental construction is in the pipeline within 1–3 miles? Heavy new supply typically softens prices + rents 12–24 months out; constrained supply supports both.
Investment metrics
- 1% rule
- 0.84% ✗
- Cap rate
- 5.84%
- Cash-on-cash
- -1.62%
- DSCR
- 0.93
- GRM
- 9.9
CMA / ARV
- ARV (median comp)
- $347,164
- List price
- $339,900
- Delta
- -2.09%
- Verdict
- FAIR
- Comps
- 20 within 1.0 mi
Show comp detail 12 sales within ~0.75 mi
| Address | Dist | Beds/Ba | Sqft | Sold | Price | $/sf | Match |
|---|---|---|---|---|---|---|---|
| 296 Halifax Ln | 0.10mi | 4/2.0 | 1,774 (0%) | 1mo | $344,900 | $194 | 95 |
| 271 Halifax Ln | 0.14mi | 4/2.0 | 1,774 (0%) | 3mo | $332,400 | $187 | 91 |
| 284 Halifax Ln | 0.16mi | 4/2.0 | 1,774 (0%) | 4mo | $338,965 | $191 | 89 |
| 509 Foggy Brook Loop | 0.12mi | 3/2.0 (-1) | 1,734 (-2%) | 2mo | $334,900 | $193 | 84 |
| 500 Foggy Brook Loop | 0.09mi | 3/2.0 (-1) | 1,734 (-2%) | 4mo | $325,900 | $188 | 84 |
| 311 Halifax Ln | 0.14mi | 4/2.5 | 1,885 (+6%) | 2mo | $339,900 | $180 | 79 |
| 288 Halifax Ln | 0.06mi | 3/2.0 (-1) | 1,618 (-9%) | 1mo | $329,900 | $204 | 77 |
| 295 Halifax Ln | 0.10mi | 3/2.0 (-1) | 1,618 (-9%) | 1mo | $328,900 | $203 | 75 |
| 505 Foggy Brook Loop | 0.11mi | 4/3.0 | 1,941 (+9%) | 2mo | $359,900 | $185 | 74 |
| 501 Foggy Brook Loop | 0.09mi | 4/2.0 | 2,025 (+14%) | 3mo | $358,900 | $177 | 70 |
| 280 Halifax Ln | 0.16mi | 4/2.0 | 2,028 (+14%) | 3mo | $345,000 | $170 | 66 |
| 292 Halifax Ln | 0.08mi | 5/3.0 (+1) | 2,012 (+13%) | 2mo | $366,400 | $182 | 63 |
Match score weights: distance 35% · size 25% · config 20% · recency 20%. Top-matched comps best support the ARV.
Projected returns pro-forma
-3.0% appreciation · 3.0% rent growth · sell at horizon
- IRR
- -19.0%
- Equity multiple
- 0.34×
- Total profit
- $-63,204
- Equity at exit
- $50,680
- IRR
- -11.4%
- Equity multiple
- 0.31×
- Total profit
- $-65,316
- Equity at exit
- $29,388
Cash invested: $95,172 (down + closing). Projections, not guarantees.
Landlord ↔ Tenant lean methodology
- Overall (STATE)
- 90 Strongly Landlord-Friendly
- State Alabama
- 90 Strongly Landlord-Friendly · R+15
- County
- — inherits STATE
- City
- — inherits STATE
ZIP-level market 35043
- Home prices YoY
- -15.6%
- Active inventory
- 287
- Price-to-rent
- 9.9×
Monthly cashflow live
- Estimated rent
- $2,859 medium interval (Pro) →
- Mortgage (P&I)
- −$1,782
- Tax est. 1.5%
- −$425 /mo · $5,098/yr
- Insurance
- −$142
- HOA
- −$38
- Vacancy / Maint / Mgmt
- −$600
- Net cashflow
- $-129
Break-even live
UW: 25.0% down · 7.5% · 30yr · 1.5% tax · 5.0% vac · 8.0% maint · 8.0% mgmt
Financing live
Cash to close
- Down payment
- $84,975
- Closing costs
- $10,197
- Reserves months
- —
- Total cash needed
- —
Loan-product check · same deal, 3 products live
Conventional
25% down · 7.5% · 30yr
- Down + closing
- —
- Monthly P&I
- —
- Monthly cashflow
- —
- DSCR
- —
- Eligible?
- —
Personal DTI + credit; lowest rate.
DSCR
20% down · 8.5% · 30yr
- Down + closing
- —
- Monthly P&I
- —
- Monthly cashflow
- —
- DSCR
- —
- Eligible?
- —
No personal income docs; deal must DSCR.
Hard money
10% down · 12.0% · 12mo
- Down + closing
- —
- Monthly P&I
- —
- Monthly cashflow
- —
- DSCR
- —
- Eligible?
- —
Short-term bridge; refi at stabilization.
Rent comps 2 comps
| Address | Beds | Baths | Sqft | Rent | $/sqft | DOM | Units | Dist |
|---|---|---|---|---|---|---|---|---|
| 283 Halifax Ln Chelsea, AL | 4.0 | 2.0 | 2250 | $2,950 | $1.31 | 43d | 1 | 0.08mi |
| 24 Autry Dr Chelsea, AL | 4.0 | 2.0 | 1856 | $1,770 | $0.95 | 1d | 1 | 1.44mi |
HOA detail
- Monthly dues
- $38 · $456/yr
Listing history 17 events
-
2026-06-18days on market $339,900 Active 85 DOM
-
2026-06-17price $339,900 Active 84 DOM
-
2026-06-17days on market $347,400 Active 84 DOM
-
2026-06-16days on market $347,400 Active 83 DOM
-
2026-06-15days on market $347,400 Active 82 DOM
-
2026-06-13days on market $347,400 Active 80 DOM
-
2026-06-13days on market $347,400 Active 79 DOM
-
2026-06-10days on market $347,400 Active 77 DOM
-
2026-06-09days on market $347,400 Active 76 DOM
-
2026-06-08days on market $347,400 Active 75 DOM
-
2026-06-07days on market $347,400 Active 74 DOM
-
2026-06-05days on market $347,400 Active 71 DOM
-
2026-06-03days on market $347,400 Active 70 DOM
-
2026-06-02days on market $347,400 Active 69 DOM
-
2026-06-01days on market $347,400 Active 68 DOM
-
2026-05-31days on market $347,400 Active 67 DOM
-
2026-03-25$347,400 Active 744-char remark
Show marketing remark (744 chars)
Ask about our interest rates, paid closing cost and easily added options. The one-level Cali plan provides an efficient, four-bedroom, two-bath design in 1,774 square feet. One of the unique features is the integration of the kitchen, breakfast area and great room in an open concept design perfect for entertaining. Enjoy early morning coffee or quiet evenings under the shaded covered patio. The bedroom on-suite is your private getaway with a shower, double vanity and large walk-in closet. A two-car garage, laundry room and pantry provide utility and storage. Quality materials and workmanship throughout, with superior attention to detail, plus a one-year builders' warranty. Your new home also includes our smart home technology package!
ⓘ Source: listings_history table (triggers on properties + properties_extension) + one-shot
backfill from property_details.listing_events for pre-trigger history.
Climate risk First Street
- Flood 1/10 Low FEMA zone X (unshaded) · 0% chance over 30 yrs
- Wildfire 5/10 Major
- Heat 6/10 Major 7 d/yr ≥107°F today · 19 d/yr by 30 yrs out
- Wind 6/10 Major 27% chance of damaging wind over 30 yrs
- Air quality 3/10 Moderate 3 unhealthy d/yr today · 4 by 30 yrs out
Nearby sold comps map
Loading sold comps map…
Walkable amenities ~0.75 mi
Loading nearby amenities…
Taxation est. · year 1
- Rental income
- $34,304
- − Mortgage interest
- −$19,040
- − Property taxes
- −$5,098
- − Insurance
- −$1,700
- − Repairs & maintenance
- −$2,744
- − Management
- −$2,744
- − HOA
- −$456
- − Depreciation
- −$9,888
- Taxable loss
- −$7,366
- Est. tax savings @ 24.0%
- +$1,768
- After-tax cash flow
- $224/yr
For passive investors: Depreciation is non-cash, so a rental often shows a tax loss while cash-flowing — sheltering income. Rental losses are passive: they offset passive income freely, and up to $25,000/yr can offset ordinary (W-2) income if you actively participate and your MAGI is under $100k (phasing out to $0 by $150k); unused losses carry forward. On sale, claimed depreciation is recaptured at up to 25%, and gains may owe capital-gains tax (a 1031 exchange can defer both). Figures are a year-1 estimate at your 24.0% rate — not tax advice; consult a CPA.
Condition & rehab AI · 6 photos
This single-family home is in excellent condition with a good condition score of 80. It is move-in ready with minimal repairs and maintenance needed. The highest-ROI updates to increase its value include painting, landscaping, smart home features, and energy-efficient windows.
Value-add opportunities
- Both Painting exterior and interior walls — Fresh paint enhances curb appeal and interior aesthetics
- Both Landscaping improvements — Enhances curb appeal and adds value
- Both Add smart home features — Improves convenience and adds value
- Both Install energy-efficient windows — Reduces energy costs and enhances curb appeal
Renovation cost estimate screening
Value-add ROI direction
- Both Painting exterior and interior walls — Fresh paint enhances curb appeal and interior aesthetics ↑
- Both Landscaping improvements — Enhances curb appeal and adds value ↑
- Both Add smart home features — Improves convenience and adds value ↑
- Both Install energy-efficient windows — Reduces energy costs and enhances curb appeal ↑
ⓘ Cost ranges are severity-bucket heuristics (US national rule-of-thumb). Get contractor quotes + a written scope before underwriting a rehab budget.
Schools (NCES district)
- District
- Shelby County
- NCES district ID
- 0103030
- Math proficiency
- 30% ▼ -28.00%
- Reading proficiency
- 58% ▲ 2.00%
- Median HH income
- $66,672
- Composite
- 39.29/100
- National rank
- #3995
- State rank
- #16 of 129 in AL
Livability — Chelsea
- Score
- 69/100
- State rank
- #52
- US rank
- #8363
Category grades
Schools grade is shown separately in the Schools card above.
Census & demographics
- Census place
- Chelsea, AL
- City population
- 15,068
- Population (ZIP)
- 15,068
Population outlook (Shelby County) Hauer SSP2
- Today (2025)
- 237,024 people
- By 2030
- 249,868 · +5.4%
- By 2040
- 272,778 · +15.1%
- By 2050
- 291,062 · +22.8%
- By 2075
- 326,049 · +37.6%
- By 2100
- 335,870 · +41.7%
Race, ethnicity, and origin ACS 2023
- Neighborhood character
- Predominantly White (85%)
- Race & ethnicity
- White 85% Black 6% Hispanic / Latino 5% Two or more races 4%
- Hispanic origin (detail)
- Mexican 3%
- Common ancestry
- Serbian 3% Slovak 2% Romanian 2%
- Foreign-born
- 3% · Canada
- Languages at home
- 92% English-only · Arabic 4% Spanish 4%
Political lean MEDSL · Shelby
- 2024 margin
- Solid R (+40.9) · D 29.0% · R 69.9% · Other 1.1%
- 2008→2024 swing
- +12.6pp toward D · 2008: -53.4pp · 2024: -40.9pp
- All cycles
- 2024: R+40.9 2020: R+40.4 2016: R+50.3 2012: R+55.6 2008: R+53.4
Not yet ingested
- Civics
- —
Market trends
- HPI YoY
- ▼ -38.08%
- Current HPI
- 205.463
- Rent YoY
- —
- Metro
- —
- State GDP YoY
- ▲ 2.94%
- F500 in state
- 4
Industry mix (Fortune 500 HQ in AL)
| Industry | F500 HQs | Revenue |
|---|---|---|
| Financial Services | 1 | $8B |
|
||
| Healthcare | 1 | $5B |
|
||
Price history
1 event — show timeline
- 2026-03-25 Listed $347,400 Greater Alabama MLS
Cash-flow waterfall
monthlySold comps — $/sqft
last 12 mo · ≤1 miLoading sold comps…