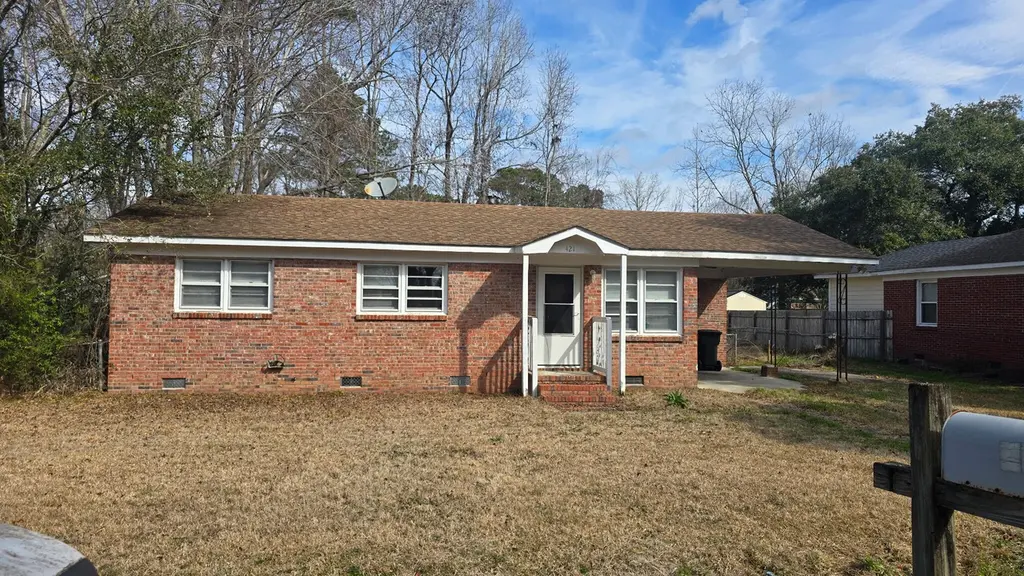
421 Sarah Dr · Goose Creek, SC
Flood risk 1/10 · Minimal
- FEMA flood zone
- X (unshaded)
- Chance of flooding over 30 yrs
- 0.0%
- Est. flood insurance / yr
- $507 – $1,088
Fire risk 3/10 · Minor
- Est. fire insurance / yr
- $783 – $1,453
Heat risk 9/10 · Severe
- Hot days now (above 107°F)
- 7 days/yr
- Hot days in 30 yrs
- 18 days/yr
Wind risk 8/10 · Major
- Chance of severe wind over 30 yrs
- 99.0%
Air-quality risk 2/10 · Minimal
- Unhealthy air days now
- 2 days/yr
- Unhealthy air days in 30 yrs
- 2 days/yr
Risk factors via First Street. Map © Google.
Why this score? — see what drove the B grade
The composite is a weighted blend of 9 inputs, each scored 0–100. Each bar is that input's sub-score; the figure is the points it added to the 100-point composite (weight × sub-score).
- Cash flow +28.1/30.0
- ARV discount +15.0/15.0
- DSCR +10.0/10.0
- 1% rule +7.1/10.0
- Rent growth +3.6/5.0
- Schools +3.6/10.0
- Livability +3.4/5.0
- Condition / age +2.5/5.0
- Appreciation +0.0/10.0
$169,000
🖨 Deal sheet 📄 Offer letter ✓ Due diligence
Listing remarks
Investor special in the heart of Boulder Bluff! This 3 bedroom, 1 bath brick ranch offers solid bones and tons of potential for the right buyer looking to renovate, rent, or flip. Situated on a spacious lot in Goose Creek, this property features original hardwood floors, a covered carport, and a large backyard with mature trees and plenty of room for outdoor living or future improvements. Inside, you'll find a functional floor plan ready for your vision and updates. The home needs cosmetic and renovation work but offers an excellent opportunity to build equity in an established neighborhood with no HOA. Conveniently located near shopping, dining, schools, and major highways, with easy acces
Key facts
- Covered carport
- Large backyard
- Outdoor living
Tags
Property features AI
Exterior
- Parking: 1-car carport
- Utilities: Public sewer
- Home design: Single-family detached home; One story; Ground-level entry; Fee simple ownership; Residential property
- Construction: No other structures reported
- Exterior features: Wood fencing
Interior
- Kitchen: Eat-in kitchen
- Bedrooms: 3 bedrooms (master on lower level)
- Bathrooms: 1 bathroom
- Interior features: Eat-in kitchen; Family room
Neighborhood map
What this means for you Summary
Snapshot
- This is a 3-bed/1.0-bath single-family listed at $169k.
Deal economics
- At list price, monthly cash flow is $530 ($6k/yr) — positive.
- The deal already cash-flows at list — no discount required.
- Meets the 1% rule at list price ($2k rent vs $169k).
- Recommended offer: $166k (1.5% below list) — sets the bar for market timing.
- Cap rate 10.1% vs local median 4.0% in Goose Creek — top-decile yield for the area; either an underpriced asset or a hidden risk that comps aren't pricing in. Stress-test before assuming the spread holds.
Location & tenants
- Location reads 67/100 on livability (#103 in SC) — a middle-class / working-renter tenant base. Strengths: housing A+, employment A, cost of living B+; Watch: amenities F, commute F, health & safety F.
- Berkeley 01 (suburban): math 35% / reading 48% proficiency, ranked #30 of 80 in SC (top 38%) — families likely to look elsewhere, expect single-tenant / working-renter base with shorter leases.
- Zoned schools: Boulder Bluff Elementary (math 25% / reading 34%, grade F, #399 of 597 statewide, top 69%, 633 students, 100% FRL); Sedgefield Middle (math 13% / reading 26%, grade F, #182 of 229 statewide, top 80%, 986 students, 100% FRL); Goose Creek High (math 33% / reading 68%, grade D+, #150 of 196 statewide, top 76%, 1,981 students, 52% FRL) — zoned schools average 84% FRL vs 48% district-wide (36 pts higher); higher-poverty schools than district average — tighter screening recommended.
- Market conditions: Rents rising fast (+4.5%/yr); 267 active listings in the ZIP; 2 comparable units currently listed for rent nearby; solid renter incomes; 3,183 units permitted in Berkeley County in 2024 (580 in 5+ unit buildings).
Forward outlook
- Local home prices are declining (-3.0%/yr); year-one equity from $1k of loan paydown is wiped out by about $5k of value loss. Plan a longer hold.
- Berkeley County population projected at +48% by 2050 — long-run rental-demand tailwind backs the buy-and-hold thesis.
- At projected returns (-3.0% appreciation + 4.5% rent growth), your $47k cash investment doubles in ~8 years — after that, you're playing with house money.
Negotiation context
- It's been on market 19 days — a 2% lower offer ($166k) is reasonable based on typical stale-listing flexibility.
Risks & watch-outs
- Climate carrying-cost: severe wind risk, 99% chance of damaging wind over 30y; extreme-heat days projected 7→18/yr by 2055 (HVAC capex compounding) — expect insurance premiums to compound above CPI over the hold.
Questions for the listing agent
- Built in 1968 — when were the roof, HVAC, electrical panel, plumbing, and water heater last replaced?
- Is there a deadline driving the sale (1031 exchange, divorce, estate, relocation)? That informs how much negotiation room exists.
- What's the average days-on-market for RENTAL listings here right now (not sales)? A rising rental-DOM trend means longer vacancies and softer asking-rent achievability than the comps imply.
- What's the recent tenant-quality profile in this submarket — average credit score on applications, eviction rate, late-payment / NSF rate, and stable-employment percentage? A property-management company in the area should have these aggregated.
- How much new for-sale + rental construction is in the pipeline within 1–3 miles? Heavy new supply typically softens prices + rents 12–24 months out; constrained supply supports both.
Investment metrics
- 1% rule
- 1.21% ✓
- Cap rate
- 10.06%
- Cash-on-cash
- 13.45%
- DSCR
- 1.60
- GRM
- 6.9
CMA / ARV
- ARV (on-the-fly)
- $222,000
- Comps found
- 12
Show comp detail 12 sales within ~0.75 mi
| Address | Dist | Beds/Ba | Sqft | Sold | Price | $/sf | Match |
|---|---|---|---|---|---|---|---|
| 401 Mary Scott Dr | 0.21mi | 3/1.0 | 874 (-2%) | 10mo | $212,000 | $243 | 79 |
| 423 Jean Wells Dr | 0.29mi | 3/1.0 | 956 (+8%) | 7mo | $225,000 | $235 | 68 |
| 445 Robin Dr | 0.37mi | 3/1.0 | 1,008 (+14%) | 2mo | $175,000 | $174 | 59 |
| 316 Anne St | 0.39mi | 3/1.0 | 1,000 (+13%) | 2mo | $292,000 | $292 | 59 |
| 413 Madeline Dr | 0.13mi | 3/2.0 | 1,008 (+14%) | 12mo | $286,000 | $284 | 57 |
| 419 Anita Dr | 0.44mi | 3/1.0 | 1,000 (+13%) | 4mo | $258,000 | $258 | 55 |
| 435 Anita Dr | 0.48mi | 3/1.0 | 1,000 (+13%) | 3mo | $250,000 | $250 | 54 |
| 318 Jean Wells Dr | 0.46mi | 3/1.0 | 1,008 (+14%) | 5mo | $257,500 | $255 | 52 |
| 349 Water Oak Dr | 0.55mi | 3/2.0 | 975 (+10%) | 3mo | $264,000 | $271 | 52 |
| 420 Tammie Avenue Ave | 0.51mi | 3/1.5 | 975 (+10%) | 8mo | $125,000 | $128 | 51 |
| 318 Amy Dr | 0.41mi | 3/1.0 | 1,000 (+13%) | 13mo | $180,000 | $180 | 49 |
| 419 Tammie Ave Ave | 0.52mi | 3/1.5 | 971 (+9%) | 11mo | $180,000 | $185 | 49 |
Match score weights: distance 35% · size 25% · config 20% · recency 20%. Top-matched comps best support the ARV.
Projected returns pro-forma
-3.0% appreciation · 4.52% rent growth · sell at horizon
- IRR
- 5.1%
- Equity multiple
- 1.20×
- Total profit
- $9,533
- Equity at exit
- $25,198
- IRR
- 15.8%
- Equity multiple
- 2.38×
- Total profit
- $65,090
- Equity at exit
- $14,612
Cash invested: $47,320 (down + closing). Projections, not guarantees.
Landlord ↔ Tenant lean methodology
- Overall (STATE)
- 90 Strongly Landlord-Friendly
- State South Carolina
- 90 Strongly Landlord-Friendly · R+6
- County
- — inherits STATE
- City
- — inherits STATE
ZIP-level market 29445
- Home prices YoY
- -18.0%
- Rents YoY
- 4.5%
- Active inventory
- 267
- Price-to-rent
- 6.9×
Monthly cashflow live
- Estimated rent
- $2,038 medium interval (Pro) →
- Mortgage (P&I)
- −$886
- Tax from tax record
- −$123 /mo · $1,472/yr
- Insurance
- −$70
- HOA
- −$0
- Vacancy / Maint / Mgmt
- −$428
- Net cashflow
- $530
Break-even live
UW: 25.0% down · 7.5% · 30yr · 1.5% tax · 5.0% vac · 8.0% maint · 8.0% mgmt
Financing live
Cash to close
- Down payment
- $42,250
- Closing costs
- $5,070
- Reserves months
- —
- Total cash needed
- —
Loan-product check · same deal, 3 products live
Conventional
25% down · 7.5% · 30yr
- Down + closing
- —
- Monthly P&I
- —
- Monthly cashflow
- —
- DSCR
- —
- Eligible?
- —
Personal DTI + credit; lowest rate.
DSCR
20% down · 8.5% · 30yr
- Down + closing
- —
- Monthly P&I
- —
- Monthly cashflow
- —
- DSCR
- —
- Eligible?
- —
No personal income docs; deal must DSCR.
Hard money
10% down · 12.0% · 12mo
- Down + closing
- —
- Monthly P&I
- —
- Monthly cashflow
- —
- DSCR
- —
- Eligible?
- —
Short-term bridge; refi at stabilization.
Rent comps 2 comps
| Address | Beds | Baths | Sqft | Rent | $/sqft | DOM | Units | Dist |
|---|---|---|---|---|---|---|---|---|
| 35 Elmwood Pl Goose Creek, SC | 3.0 | 1.5 | 900 | $1,699 | $1.89 | 23d | 1 | 0.94mi |
| 200 Branchwood Dr Goose Creek, SC | 2.0–3.0 | 2.0 | 943 | $1,575 | $1.67 | 3d | 3 | 1.46mi |
Listing history 9 events
-
2026-06-05days on market $169,000 Active 19 DOM
-
2026-06-03days on market $169,000 Active 18 DOM
-
2026-06-03days on market $169,000 Active 17 DOM
-
2026-06-01days on market $169,000 Active 16 DOM
-
2026-05-31days on market $169,000 Active 15 DOM
-
2026-05-16$169,000 Active
-
2026-04-07soldstatus $940,625
-
2003-05-27soldstatus $40,000
-
1990-12-11soldstatus $26,500
ⓘ Source: listings_history table (triggers on properties + properties_extension) + one-shot
backfill from property_details.listing_events for pre-trigger history.
Tax reassessment forecast SC · Resets to sale price
- Current annual tax
- $1,472 · $123/mo
- Projected year-2 tax
- $1,472 · $123/mo
- Expected delta
- $0/yr ($0/mo · 0.0%)
ⓘ Screening estimate from a state-policy table — verify with the county assessor before closing.
Climate risk First Street
- Flood 1/10 Low FEMA zone X (unshaded) · 0% chance over 30 yrs
- Wildfire 3/10 Moderate
- Heat 9/10 Extreme 7 d/yr ≥107°F today · 18 d/yr by 30 yrs out
- Wind 8/10 Severe 99% chance of damaging wind over 30 yrs
- Air quality 2/10 Low 2 unhealthy d/yr today · 2 by 30 yrs out
Nearby sold comps map
Loading sold comps map…
Walkable amenities ~0.75 mi
Loading nearby amenities…
Taxation est. · year 1
- Rental income
- $24,451
- − Mortgage interest
- −$9,467
- − Property taxes
- −$1,472
- − Insurance
- −$845
- − Repairs & maintenance
- −$1,956
- − Management
- −$1,956
- − Depreciation
- −$4,916
- Taxable income
- $3,839
- Est. tax owed @ 24.0%
- −$921
- After-tax cash flow
- $5,443/yr
For passive investors: Depreciation is non-cash, so a rental often shows a tax loss while cash-flowing — sheltering income. Rental losses are passive: they offset passive income freely, and up to $25,000/yr can offset ordinary (W-2) income if you actively participate and your MAGI is under $100k (phasing out to $0 by $150k); unused losses carry forward. On sale, claimed depreciation is recaptured at up to 25%, and gains may owe capital-gains tax (a 1031 exchange can defer both). Figures are a year-1 estimate at your 24.0% rate — not tax advice; consult a CPA.
Schools (NCES district)
- District
- Berkeley 01
- NCES district ID
- 4501170
- Math proficiency
- 35% ▼ -8.00%
- Reading proficiency
- 48% ▼ -2.00%
- Median HH income
- $52,724
- Composite
- 35.95/100
- National rank
- #4799
- State rank
- #30 of 80 in SC
Livability — Goose Creek
- Score
- 67/100
- State rank
- #103
- US rank
- #10912
Category grades
Schools grade is shown separately in the Schools card above.
Census & demographics
- Census place
- Goose Creek, SC
- County
- Berkeley County · 198,768 people
- City population
- 59,227
- Metro
- Charleston-North Charleston, SC
- Population (ZIP)
- 59,227
- Household income
- $81,594
- Rent vs Own
- Severe rent burden
- 1308.0
Population outlook (Berkeley County) Hauer SSP2
- Today (2025)
- 254,184 people
- By 2030
- 279,677 · +10.0%
- By 2040
- 329,379 · +29.6%
- By 2050
- 375,557 · +47.8%
- By 2075
- 476,740 · +87.6%
- By 2100
- 535,945 · +110.8%
Race, ethnicity, and origin ACS 2023
- Neighborhood character
- Diverse neighborhood (Simpson 0.63)
- Race & ethnicity
- White 55% Black 23% Hispanic / Latino 11% Two or more races 9% Asian 3%
- Hispanic origin (detail)
- Mexican 4% Puerto Rican 3%
- Common ancestry
- Slovak 2% Lithuanian 2% Italian 1%
- Foreign-born
- 9% · Canada, Jamaica, Vietnam
- Languages at home
- 86% English-only · Spanish 8% Other Indo-European 2% Tagalog/Filipino 2%
Political lean MEDSL · Berkeley
- 2024 margin
- R (+16.3) · D 41.1% · R 57.4% · Other 1.4%
- 2008→2024 swing
- -3.2pp toward R · 2008: -13.1pp · 2024: -16.3pp
- All cycles
- 2024: R+16.3 2020: R+11.7 2016: R+17.4 2012: R+18.9 2008: R+13.1
Not yet ingested
- Civics
- —
Market trends
- HPI YoY
- ▼ -66.40%
- Current HPI
- 301.8653
- Rent YoY
- ▲ 4.52%
- Metro
- Charleston-North Charleston, SC
- State GDP YoY
- ▲ 4.51%
- F500 in state
- 2
Industry mix (Fortune 500 HQ in SC)
| Industry | F500 HQs | Revenue |
|---|---|---|
| Packaging | 1 | $7B |
|
||
Price history
+537.7% since first listed4 events — show timeline
- 2026-05-16 Listed $169,000 Charleston Trident MLS
- 2026-04-07 Sold (Public Records) $940,625 Public Records
- 2003-05-27 Sold (Public Records) $40,000 Public Records
- 1990-12-11 Sold (Public Records) $26,500 Public Records
Property tax history
+2.7%/yrLatest (2025): $1,472 · +1.7% YoY. Source: county tax records.
Cash-flow waterfall
monthlySold comps — $/sqft
last 12 mo · ≤1 miLoading sold comps…