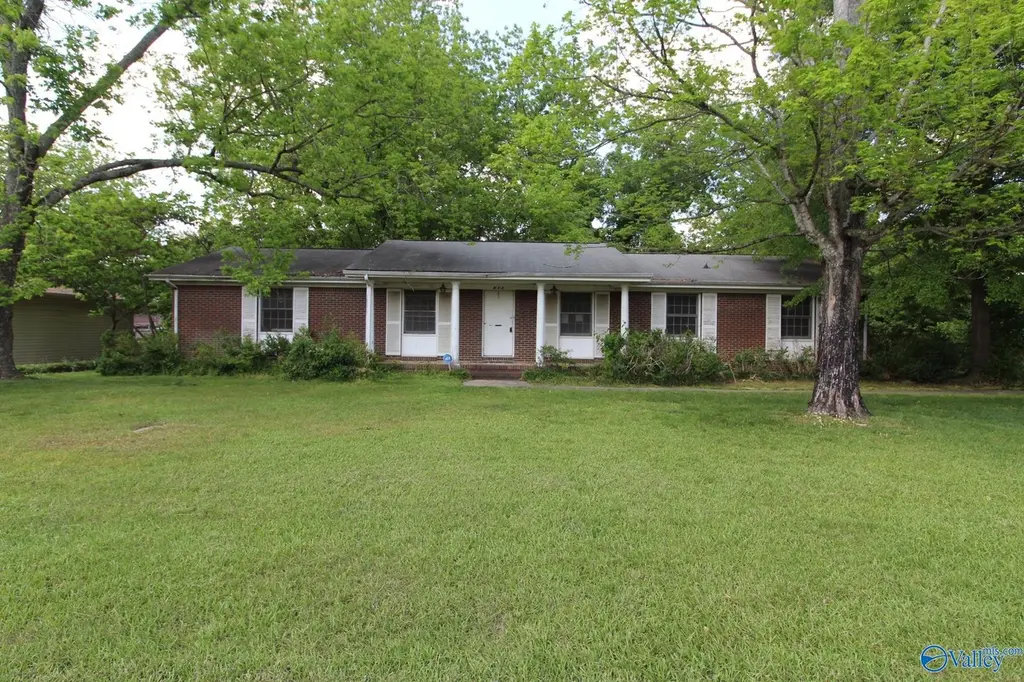
412 Apple Ave · Albertville, AL
Flood risk 1/10 · Minimal
- FEMA flood zone
- X (unshaded)
- Chance of flooding over 30 yrs
- 0.0%
- Est. flood insurance / yr
- $507 – $1,088
Fire risk 2/10 · Minimal
- Est. fire insurance / yr
- $916 – $1,700
Heat risk 5/10 · Moderate
- Hot days now (above 104°F)
- 7 days/yr
- Hot days in 30 yrs
- 20 days/yr
Wind risk 5/10 · Moderate
- Chance of severe wind over 30 yrs
- 23.0%
Air-quality risk 2/10 · Minimal
- Unhealthy air days now
- 1 days/yr
- Unhealthy air days in 30 yrs
- 3 days/yr
Risk factors via First Street. Map © Google.
Why this score? — see what drove the B- grade
The composite is a weighted blend of 9 inputs, each scored 0–100. Each bar is that input's sub-score; the figure is the points it added to the 100-point composite (weight × sub-score).
- Cash flow +30.0/30.0
- DSCR +10.0/10.0
- 1% rule +8.4/10.0
- ARV discount +7.5/15.0
- Livability +3.2/5.0
- Rent growth +2.5/5.0
- Condition / age +2.5/5.0
- Schools +2.3/10.0
- Appreciation +0.0/10.0
$110,000
🖨 Deal sheet 📄 Offer letter ✓ Due diligence
Listing remarks
This is a HUD Owned property. Case#011-542728 (UI) Un-Insured. (Subject to Appraisal). Lead Paint Addendum required for any property built prior to 1978. Seller makes no representations or warranties as to property condition. Sold AS-IS. EQUAL HOUSING OPPORTUNITY. Seller may contribute up to 3% for buyer's closing costs, upon buyer request.
Key facts
- 0.38 acre lot
- Built 1966
- Listed 6 days
Property features AI
Finance
- Other: Property type: Residential; Living area listed as 2,052 square feet; Lot size approximately 0.38 acres (120 x 138)
- HOA & community: No homeowners association; Subdivision: Orchard View
Exterior
- Parking: No parking (None listed)
- Utilities: Public water
- Home design: Single-family residence; One level; Built in 1966
- Construction: Brick construction
- Exterior features: Detached building; Covered porch; Screened porch
Interior
- Kitchen: Cooktop; Oven; Dishwasher
- Bedrooms: 7 total rooms (bedroom count not specified)
- Bathrooms: 2 full bathrooms
- Heating & cooling: Central heating; Central cooling
- Interior features: Crawl space basement; One fireplace
Neighborhood map
What this means for you Summary
Snapshot
- This is a 3-bed/2.0-bath single-family listed at $110k.
Deal economics
- At list price, monthly cash flow is $410 ($5k/yr) — positive.
- The deal already cash-flows at list — no discount required.
- Meets the 1% rule at list price ($1k rent vs $110k).
- Cap rate 10.8% vs local median 2.6% in Albertville — top-decile yield for the area; either an underpriced asset or a hidden risk that comps aren't pricing in. Stress-test before assuming the spread holds.
Location & tenants
- Location reads 65/100 on livability (#141 in AL) — a middle-class / working-renter tenant base. Strengths: cost of living A+, housing A+; Watch: amenities F, commute F, health & safety F.
- Albertville City (town): math 17% / reading 39% proficiency, ranked #79 of 129 in AL (top 61%) — low school quality limits family demand, transient renter base, plan for 1-2y turnover.
- Zoned schools: Albertville Primary School (944 students, 82% FRL); Albertville Middle School (math 11% / reading 42%, grade F, #150 of 257 statewide, top 60%, 890 students, 78% FRL); Albertville High School (math 19% / reading 22%, grade F, #159 of 305 statewide, top 53%, 1,712 students, 73% FRL) — zoned schools average 78% FRL vs 59% district-wide (19 pts higher); higher-poverty schools than district average — tighter screening recommended.
- Market conditions: 110 active listings in the ZIP; 1 comparable units currently listed for rent nearby; 163 units permitted in Marshall County in 2024 (0 in 5+ unit buildings).
Forward outlook
- Local home prices are declining (-3.0%/yr); year-one equity from $761 of loan paydown is wiped out by about $3k of value loss. Plan a longer hold.
- At projected returns (-3.0% appreciation + 3.0% rent growth), your $31k cash investment doubles in ~8 years — after that, you're playing with house money.
Negotiation context
- Only 6 days on market — expect competitive offers; lowballing is unlikely to land.
Risks & watch-outs
- Climate carrying-cost: moderate wind risk, 23% chance of damaging wind over 30y; extreme-heat days projected 7→20/yr by 2055 (HVAC capex compounding) — expect insurance premiums to compound above CPI over the hold.
Questions for the listing agent
- Built in 1966 — when were the roof, HVAC, electrical panel, plumbing, and water heater last replaced?
- Is there a deadline driving the sale (1031 exchange, divorce, estate, relocation)? That informs how much negotiation room exists.
- Schools are D-rated, which usually means shorter tenancies and higher turnover. Who's the typical renter profile here, and what's been the actual vacancy rate?
- What's the average days-on-market for RENTAL listings here right now (not sales)? A rising rental-DOM trend means longer vacancies and softer asking-rent achievability than the comps imply.
- What's the recent tenant-quality profile in this submarket — average credit score on applications, eviction rate, late-payment / NSF rate, and stable-employment percentage? A property-management company in the area should have these aggregated.
- How much new for-sale + rental construction is in the pipeline within 1–3 miles? Heavy new supply typically softens prices + rents 12–24 months out; constrained supply supports both.
Investment metrics
- 1% rule
- 1.34% ✓
- Cap rate
- 10.77%
- Cash-on-cash
- 15.99%
- DSCR
- 1.71
- GRM
- 6.2
CMA / ARV
- ARV (median comp)
- $244,522
- List price
- $110,000
- Delta
- -55.01%
- Verdict
- UNDERPRICED
- Comps
- 20 within 1.0 mi
Show comp detail 12 sales within ~0.75 mi
| Address | Dist | Beds/Ba | Sqft | Sold | Price | $/sf | Match |
|---|---|---|---|---|---|---|---|
| 412 Apple Ave | 0.00mi | 3/2.0 | 2,052 (-2%) | 0mo | $118,000 | $58 | 96 |
| 409 Forestdale Ave | 0.17mi | 3/2.5 | 2,100 (0%) | 1mo | $265,000 | $126 | 90 |
| 409 Peach Ave | 0.07mi | 4/2.0 (+1) | 2,010 (-4%) | 4mo | $235,000 | $117 | 82 |
| 82 Drury Ln | 0.43mi | 3/2.0 | 2,087 (-1%) | 1mo | $328,900 | $158 | 78 |
| 413 Apple Ave | 0.03mi | 4/3.0 (+1) | 2,400 (+14%) | 4mo | $290,000 | $121 | 63 |
| 605 Coby Cir | 0.28mi | 4/2.0 (+1) | 1,899 (-10%) | 6mo | $261,000 | $137 | 61 |
| 617 Preston Ave | 0.52mi | 4/3.0 (+1) | 2,209 (+5%) | 6mo | $365,000 | $165 | 53 |
| 1511 Jason St | 0.57mi | 4/2.5 (+1) | 1,947 (-7%) | 5mo | $255,000 | $131 | 50 |
| 1504 Fulton St | 0.60mi | 3/2.0 | 2,349 (+12%) | 7mo | $385,000 | $164 | 47 |
| 1202 Crestbrook Dr | 0.43mi | 4/2.5 (+1) | 2,373 (+13%) | 10mo | $349,900 | $147 | 43 |
| 61 Berkshire Ln | 0.42mi | 4/3.0 (+1) | 1,837 (-12%) | 10mo | $330,000 | $180 | 42 |
| 908 E Alabama Ave | 0.51mi | 4/2.0 (+1) | 2,409 (+15%) | 7mo | $259,900 | $108 | 41 |
Match score weights: distance 35% · size 25% · config 20% · recency 20%. Top-matched comps best support the ARV.
Projected returns pro-forma
-3.0% appreciation · 3.0% rent growth · sell at horizon
- IRR
- 6.9%
- Equity multiple
- 1.27×
- Total profit
- $8,330
- Equity at exit
- $16,401
- IRR
- 16.3%
- Equity multiple
- 2.33×
- Total profit
- $40,984
- Equity at exit
- $9,511
Cash invested: $30,800 (down + closing). Projections, not guarantees.
Landlord ↔ Tenant lean methodology
- Overall (STATE)
- 90 Strongly Landlord-Friendly
- State Alabama
- 90 Strongly Landlord-Friendly · R+15
- County
- — inherits STATE
- City
- — inherits STATE
ZIP-level market 35950
- Home prices YoY
- -20.4%
- Active inventory
- 110
- Price-to-rent
- 6.2×
Monthly cashflow live
- Estimated rent
- $1,475 medium interval (Pro) →
- Mortgage (P&I)
- −$577
- Tax from tax record
- −$132 /mo · $1,587/yr
- Insurance
- −$46
- HOA
- −$0
- Vacancy / Maint / Mgmt
- −$310
- Net cashflow
- $410
Break-even live
UW: 25.0% down · 7.5% · 30yr · 1.5% tax · 5.0% vac · 8.0% maint · 8.0% mgmt
Financing live
Cash to close
- Down payment
- $27,500
- Closing costs
- $3,300
- Reserves months
- —
- Total cash needed
- —
Loan-product check · same deal, 3 products live
Conventional
25% down · 7.5% · 30yr
- Down + closing
- —
- Monthly P&I
- —
- Monthly cashflow
- —
- DSCR
- —
- Eligible?
- —
Personal DTI + credit; lowest rate.
DSCR
20% down · 8.5% · 30yr
- Down + closing
- —
- Monthly P&I
- —
- Monthly cashflow
- —
- DSCR
- —
- Eligible?
- —
No personal income docs; deal must DSCR.
Hard money
10% down · 12.0% · 12mo
- Down + closing
- —
- Monthly P&I
- —
- Monthly cashflow
- —
- DSCR
- —
- Eligible?
- —
Short-term bridge; refi at stabilization.
Rent comps 1 comps
| Address | Beds | Baths | Sqft | Rent | $/sqft | DOM | Units | Dist |
|---|---|---|---|---|---|---|---|---|
| 1100 Corbin St Albertville, AL | 4.0 | 2.0 | 1423 | $1,475 | $1.04 | 23d | 1 | 0.71mi |
Listing history 3 events
-
2026-05-11status Pending 342-char remark
-
2026-05-05$110,000 Active 342-char remark
-
2024-03-25soldstatus $299,000
ⓘ Source: listings_history table (triggers on properties + properties_extension) + one-shot
backfill from property_details.listing_events for pre-trigger history.
Tax reassessment forecast AL · Resets to sale price
- Current annual tax
- $1,587 · $132/mo
- Projected year-2 tax
- $1,587 · $132/mo
- Expected delta
- $0/yr ($0/mo · 0.0%)
ⓘ Screening estimate from a state-policy table — verify with the county assessor before closing.
Climate risk First Street
- Flood 1/10 Low FEMA zone X (unshaded) · 0% chance over 30 yrs
- Wildfire 2/10 Low
- Heat 5/10 Major 7 d/yr ≥104°F today · 20 d/yr by 30 yrs out
- Wind 5/10 Major 23% chance of damaging wind over 30 yrs
- Air quality 2/10 Low 1 unhealthy d/yr today · 3 by 30 yrs out
Nearby sold comps map
Loading sold comps map…
Walkable amenities ~0.75 mi
Loading nearby amenities…
Taxation est. · year 1
- Rental income
- $17,700
- − Mortgage interest
- −$6,162
- − Property taxes
- −$1,587
- − Insurance
- −$550
- − Repairs & maintenance
- −$1,416
- − Management
- −$1,416
- − Depreciation
- −$3,200
- Taxable income
- $3,370
- Est. tax owed @ 24.0%
- −$809
- After-tax cash flow
- $4,115/yr
For passive investors: Depreciation is non-cash, so a rental often shows a tax loss while cash-flowing — sheltering income. Rental losses are passive: they offset passive income freely, and up to $25,000/yr can offset ordinary (W-2) income if you actively participate and your MAGI is under $100k (phasing out to $0 by $150k); unused losses carry forward. On sale, claimed depreciation is recaptured at up to 25%, and gains may owe capital-gains tax (a 1031 exchange can defer both). Figures are a year-1 estimate at your 24.0% rate — not tax advice; consult a CPA.
Schools (NCES district)
- District
- Albertville City
- NCES district ID
- 0100005
- Math proficiency
- 17% ▼ -29.00%
- Reading proficiency
- 39% ▲ 1.00%
- Median HH income
- $36,890
- Composite
- 23.21/100
- National rank
- #7940
- State rank
- #79 of 129 in AL
Livability — Albertville
- Score
- 65/100
- State rank
- #141
- US rank
- #13438
Category grades
Schools grade is shown separately in the Schools card above.
Census & demographics
- Census place
- Albertville, AL
- Population (ZIP)
- 21,173
Population outlook (Marshall County) Hauer SSP2
- Today (2025)
- 97,402 people
- By 2030
- 98,138 · +0.8%
- By 2040
- 98,502 · +1.1%
- By 2050
- 97,024 · -0.4%
- By 2075
- 89,334 · -8.3%
- By 2100
- 74,749 · -23.3%
Race, ethnicity, and origin ACS 2023
- Neighborhood character
- Majority White (64%)
- Race & ethnicity
- White 64% Hispanic / Latino 31% Two or more races 10% Native American 5% Black 3%
- Hispanic origin (detail)
- Mexican 15%
- Common ancestry
- Slovak 1% Italian 1% Hispanic 1%
- Foreign-born
- 13% · Canada
- Languages at home
- 71% English-only · Spanish 28% French/Haitian/Cajun 1%
Political lean MEDSL · Marshall
- 2024 margin
- Solid R (+71.7) · D 13.8% · R 85.5%
- 2008→2024 swing
- -15.4pp toward R · 2008: -56.4pp · 2024: -71.7pp
- All cycles
- 2024: R+71.7 2020: R+68.7 2016: R+69.5 2012: R+60.1 2008: R+56.4
Not yet ingested
- Civics
- —
Market trends
- HPI YoY
- ▼ -56.37%
- Current HPI
- 220.4214
- Rent YoY
- —
- Metro
- —
- State GDP YoY
- ▲ 2.94%
- F500 in state
- 4
Industry mix (Fortune 500 HQ in AL)
| Industry | F500 HQs | Revenue |
|---|---|---|
| Financial Services | 1 | $8B |
|
||
| Healthcare | 1 | $5B |
|
||
Price history
-60.5% since first listed4 events — show timeline
- 2026-06-15 Sold (MLS) $118,000 VMLS
- 2026-05-11 Pending — VMLS
- 2026-05-05 Listed $110,000 VMLS
- 2024-03-25 Sold (Public Records) $299,000 Public Records
Property tax history
+7.0%/yrLatest (2025): $1,587 · +7.0% YoY. Source: county tax records.
Cash-flow waterfall
monthlySold comps — $/sqft
last 12 mo · ≤1 miLoading sold comps…