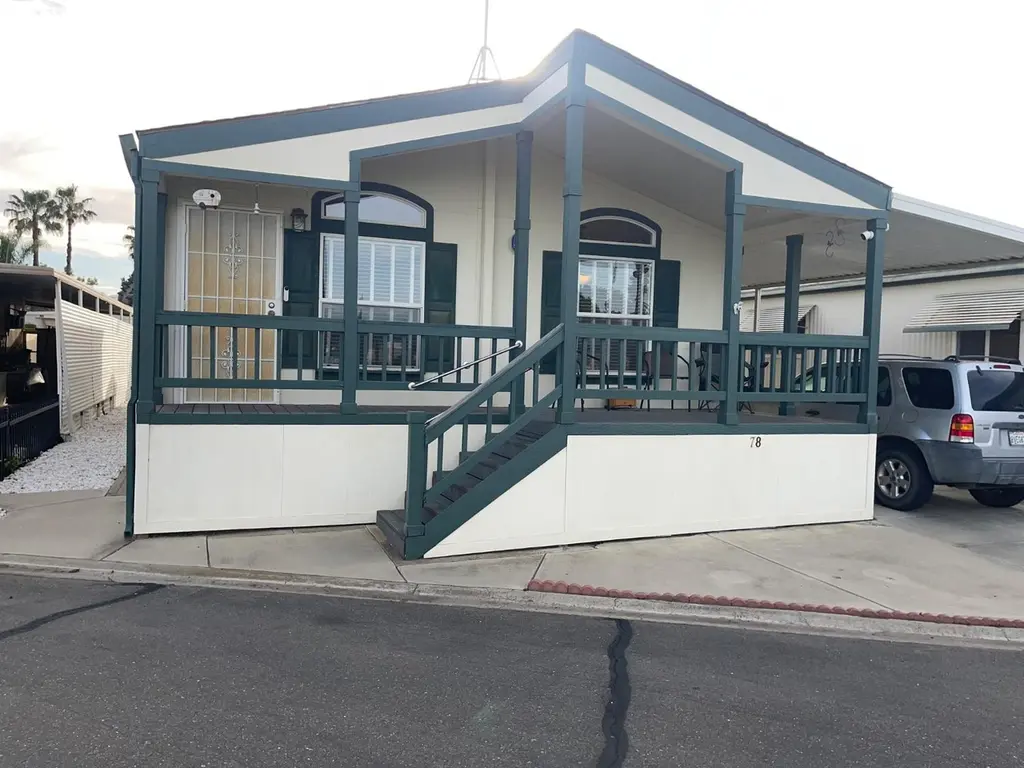
1400 Meredith Ave #78 · Gustine, CA
Flood risk 1/10 · Minimal
- FEMA flood zone
- X (unshaded)
- Chance of flooding over 30 yrs
- 0.0%
- Est. flood insurance / yr
- $507 – $1,088
Fire risk 6/10 · Moderate
- Est. fire insurance / yr
- $659 – $1,223
Heat risk 6/10 · Moderate
- Hot days now (above 105°F)
- 7 days/yr
- Hot days in 30 yrs
- 16 days/yr
Wind risk 1/10 · Minimal
- Chance of severe wind over 30 yrs
- —
Air-quality risk 9/10 · Severe
- Unhealthy air days now
- 20 days/yr
- Unhealthy air days in 30 yrs
- 21 days/yr
Risk factors via First Street. Map © Google.
Why this score? — see what drove the B- grade
The composite is a weighted blend of 9 inputs, each scored 0–100. Each bar is that input's sub-score; the figure is the points it added to the 100-point composite (weight × sub-score).
- Cash flow +30.0/30.0
- 1% rule +10.0/10.0
- DSCR +10.0/10.0
- ARV discount +7.5/15.0
- Livability +3.4/5.0
- Rent growth +2.5/5.0
- Condition / age +2.5/5.0
- Schools +2.4/10.0
- Appreciation +0.0/10.0
$94,900
🖨 Deal sheet 📄 Offer letter ✓ Due diligence
Listing remarks
Very nice clean 55+ park. The mobile is built in 2002 with sheet rock walls, inside laundry room with cabinets, 2 bedroom 2 bath, dual pane windows. Nice big front deck. Mobile feels like a home in the Green Acres Mobile Ranch. Nice pool, clubhouse, picnic, BBQ, and car wash area. Sellers moving out of area.
Key facts
- Bbq area
- Pool
- Big front deck
Tags
Neighborhood map
What this means for you Summary
Snapshot
- This is a 2-bed/2.0-bath manufactured listed at $95k.
Deal economics
- At list price, monthly cash flow is $734 ($9k/yr) — positive.
- The deal already cash-flows at list — no discount required.
- Meets the 1% rule at list price ($2k rent vs $95k).
- Recommended offer: $89k (6.0% below list) — sets the bar for market timing.
Location & tenants
- Location reads 67/100 on livability (#321 in CA) — a middle-class / working-renter tenant base. Strengths: health & safety A+, housing A, crime B+; Watch: employment D, schools D-, amenities F.
- Gustine Unified (rural): math 17% / reading 32% proficiency, ranked #1,180 of 1,400 in CA (top 84%) — low school quality limits family demand, transient renter base, plan for 1-2y turnover; 72% free/reduced lunch — lower-income household profile, screen leases tightly.
- Market conditions: 30 active listings in the ZIP; 10 comparable units currently listed for rent nearby; rentals leasing fast (median 13d on market — plan ~1-2 weeks tenant-placement turnaround); 459 units permitted in Merced County in 2024 (0 in 5+ unit buildings).
Forward outlook
- Local home prices are declining (-3.0%/yr); year-one equity from $656 of loan paydown is wiped out by about $3k of value loss. Plan a longer hold.
- Merced County population projected at +12% by 2050 — modest demand growth; plan on rents tracking national, not racing it.
- At projected returns (-3.0% appreciation + 3.0% rent growth), your $27k cash investment doubles in ~4 years — after that, you're playing with house money.
Negotiation context
- It's been on market 71 days — a 6% lower offer ($89k) is reasonable based on typical stale-listing flexibility.
Risks & watch-outs
- Climate carrying-cost: major wildfire risk; extreme-heat days projected 7→16/yr by 2055 (HVAC capex compounding) — expect insurance premiums to compound above CPI over the hold.
Questions for the listing agent
- It's been on market 71 days. Have you received any prior offers? Is the seller open to a 6% concession, seller financing, or rate buy-down credit?
- Why hasn't it sold? Are there any deal-killer items the seller is aware of (foundation, flood, title, zoning, code violations)?
- Is there a deadline driving the sale (1031 exchange, divorce, estate, relocation)? That informs how much negotiation room exists.
- Schools are D-rated, which usually means shorter tenancies and higher turnover. Who's the typical renter profile here, and what's been the actual vacancy rate?
- What's the average days-on-market for RENTAL listings here right now (not sales)? A rising rental-DOM trend means longer vacancies and softer asking-rent achievability than the comps imply.
- What's the recent tenant-quality profile in this submarket — average credit score on applications, eviction rate, late-payment / NSF rate, and stable-employment percentage? A property-management company in the area should have these aggregated.
- How much new for-sale + rental construction is in the pipeline within 1–3 miles? Heavy new supply typically softens prices + rents 12–24 months out; constrained supply supports both.
Investment metrics
- 1% rule
- 1.72% ✓
- Cap rate
- 15.58%
- Cash-on-cash
- 33.16%
- DSCR
- 2.48
- GRM
- 4.8
CMA / ARV
- ARV (median comp)
- $50,593
- List price
- $94,900
- Delta
- 87.57%
- Verdict
- OVERPRICED
- Comps
- 6 within 1.0 mi
Show comp detail 7 sales within ~0.75 mi
| Address | Dist | Beds/Ba | Sqft | Sold | Price | $/sf | Match |
|---|---|---|---|---|---|---|---|
| 1400 Meredith Ave #58 | 0.04mi | 2/2.0 | 1,000 (-5%) | 3mo | $38,000 | $38 | 87 |
| 1400 Meredith Ave #25 | 0.03mi | 2/2.0 | 1,140 (+8%) | 2mo | $89,999 | $79 | 84 |
| 1400 Meredith Ave #76 | 0.07mi | 2/2.0 | 1,040 (-2%) | 14mo | $95,000 | $91 | 82 |
| 1400 Meredith Ave #95 | 0.06mi | 2/2.0 | 960 (-9%) | 1mo | $47,000 | $49 | 81 |
| 1400 Meredith Ave #73 | 0.02mi | 2/2.0 | 1,040 (-2%) | 22mo | $90,000 | $87 | 78 |
| 1400 Meredith Ave #50 | 0.07mi | 2/2.0 | 960 (-9%) | 9mo | $60,000 | $63 | 74 |
| 1400 Meredith Ave #3 | 0.07mi | 2/1.0 | 945 (-10%) | 6mo | $55,000 | $58 | 70 |
Match score weights: distance 35% · size 25% · config 20% · recency 20%. Top-matched comps best support the ARV.
Projected returns pro-forma
-3.0% appreciation · 3.0% rent growth · sell at horizon
- IRR
- 28.3%
- Equity multiple
- 2.18×
- Total profit
- $31,345
- Equity at exit
- $14,150
- IRR
- 35.8%
- Equity multiple
- 4.29×
- Total profit
- $87,354
- Equity at exit
- $8,205
Cash invested: $26,572 (down + closing). Projections, not guarantees.
Landlord ↔ Tenant lean methodology
- Overall (STATE)
- 18 Strongly Tenant-Friendly
- State California
- 18 Strongly Tenant-Friendly · D+13
- County
- — inherits STATE
- City
- — inherits STATE
ZIP-level market 95322
- Home prices YoY
- -31.1%
- Active inventory
- 30
- Price-to-rent
- 4.8×
Monthly cashflow live
- Estimated rent
- $1,631 high interval (Pro) →
- Mortgage (P&I)
- −$498
- Tax from tax record
- −$17 /mo · $208/yr
- Insurance
- −$40
- HOA
- −$0
- Vacancy / Maint / Mgmt
- −$343
- Net cashflow
- $734
Break-even live
UW: 25.0% down · 7.5% · 30yr · 1.5% tax · 5.0% vac · 8.0% maint · 8.0% mgmt
Financing live
Cash to close
- Down payment
- $23,725
- Closing costs
- $2,847
- Reserves months
- —
- Total cash needed
- —
Loan-product check · same deal, 3 products live
Conventional
25% down · 7.5% · 30yr
- Down + closing
- —
- Monthly P&I
- —
- Monthly cashflow
- —
- DSCR
- —
- Eligible?
- —
Personal DTI + credit; lowest rate.
DSCR
20% down · 8.5% · 30yr
- Down + closing
- —
- Monthly P&I
- —
- Monthly cashflow
- —
- DSCR
- —
- Eligible?
- —
No personal income docs; deal must DSCR.
Hard money
10% down · 12.0% · 12mo
- Down + closing
- —
- Monthly P&I
- —
- Monthly cashflow
- —
- DSCR
- —
- Eligible?
- —
Short-term bridge; refi at stabilization.
Rent comps 10 comps
| Address | Beds | Baths | Sqft | Rent | $/sqft | DOM | Units | Dist |
|---|---|---|---|---|---|---|---|---|
| 1407 South Ave Unit 1407 Gustine, CA | 2.0 | 1.0 | 800 | $1,300 | $1.62 | 12d | 1 | 0.36mi |
| 1310 Olson Dr Apt E Gustine, CA | 2.0 | 1.0 | 800 | $1,300 | $1.62 | 12d | 1 | 0.36mi |
| 1535 South Ave Apt B Gustine, CA | 2.0 | 1.5 | 900 | $1,200 | $1.33 | 12d | 1 | 0.38mi |
| 790 Sycamore Ave Gustine, CA | 2.0 | 1.0 | 1089 | $1,750 | $1.61 | 7d | 1 | 0.39mi |
| 775 Odilia Ct Gustine, CA | 2.0 | 2.0 | 970 | $1,850 | $1.91 | 12d | 1 | 0.47mi |
| 750 Odilia Ct Gustine, CA | 2.0 | 2.5 | 1212 | $1,850 | $1.53 | 12d | 1 | 0.49mi |
| 772 5th Ave Gustine, CA | 2.0 | 1.0 | 1150 | $1,700 | $1.48 | 12d | 1 | 0.56mi |
| 407 6th St Gustine, CA | 2.0 | 2.0 | 950 | $1,900 | $2.00 | 14d | 1 | 0.71mi |
| 1573 Via del Pettoruto Gustine, CA | 3.0 | 2.0 | 1242 | $2,200 | $1.77 | 12d | 1 | 0.73mi |
| 212 2nd St Gustine, CA | 3.0 | 2.0 | 1109 | $1,800 | $1.62 | 2d | 1 | 1.08mi |
Listing history 15 events
-
2026-06-18days on market $94,900 Active 71 DOM
-
2026-06-17days on market $94,900 Active 70 DOM
-
2026-06-16days on market $94,900 Active 69 DOM
-
2026-06-16price $94,900 Active 68 DOM
-
2026-06-15days on market $99,900 Active 68 DOM
-
2026-06-13days on market $99,900 Active 66 DOM
-
2026-06-13days on market $99,900 Active 65 DOM
-
2026-06-09days on market $99,900 Active 62 DOM
-
2026-06-08days on market $99,900 Active 61 DOM
-
2026-06-07days on market $99,900 Active 60 DOM
-
2026-06-05days on market $99,900 Active 57 DOM
-
2026-06-03days on market $99,900 Active 56 DOM
-
2026-06-02days on market $99,900 Active 55 DOM
-
2026-06-01days on market $99,900 Active 54 DOM
-
2026-05-31days on market $99,900 Active 53 DOM
ⓘ Source: listings_history table (triggers on properties + properties_extension) + one-shot
backfill from property_details.listing_events for pre-trigger history.
Tax reassessment forecast CA · Resets to sale price
- Current annual tax
- $208 · $17/mo
- Projected year-2 tax
- $721 · $60/mo
- Expected delta
- +$514/yr (+$43/mo · 247.4%)
ⓘ Screening estimate from a state-policy table — verify with the county assessor before closing.
Climate risk First Street
- Flood 1/10 Low FEMA zone X (unshaded) · 0% chance over 30 yrs
- Wildfire 6/10 Major
- Heat 6/10 Major 7 d/yr ≥105°F today · 16 d/yr by 30 yrs out
- Wind 1/10 Low
- Air quality 9/10 Extreme 20 unhealthy d/yr today · 21 by 30 yrs out
Nearby sold comps map
Loading sold comps map…
Walkable amenities ~0.75 mi
Loading nearby amenities…
Taxation est. · year 1
- Rental income
- $19,575
- − Mortgage interest
- −$5,316
- − Property taxes
- −$208
- − Insurance
- −$474
- − Repairs & maintenance
- −$1,566
- − Management
- −$1,566
- − Depreciation
- −$2,761
- Taxable income
- $7,684
- Est. tax owed @ 24.0%
- −$1,844
- After-tax cash flow
- $6,966/yr
For passive investors: Depreciation is non-cash, so a rental often shows a tax loss while cash-flowing — sheltering income. Rental losses are passive: they offset passive income freely, and up to $25,000/yr can offset ordinary (W-2) income if you actively participate and your MAGI is under $100k (phasing out to $0 by $150k); unused losses carry forward. On sale, claimed depreciation is recaptured at up to 25%, and gains may owe capital-gains tax (a 1031 exchange can defer both). Figures are a year-1 estimate at your 24.0% rate — not tax advice; consult a CPA.
Schools (NCES district)
- District
- Gustine Unified
- NCES district ID
- 0616323
- Math proficiency
- 17% ▬ 0.00%
- Reading proficiency
- 32% ▲ 3.00%
- Median HH income
- $42,825
- Composite
- 23.99/100
- National rank
- #13180
- State rank
- #1180 of 1400 in CA
Livability — Gustine
- Score
- 67/100
- State rank
- #321
- US rank
- #10803
Category grades
Schools grade is shown separately in the Schools card above.
Census & demographics
- Census place
- Gustine, CA
- Population (ZIP)
- 9,013
Population outlook (Merced County) Hauer SSP2
- Today (2025)
- 285,501 people
- By 2030
- 293,437 · +2.8%
- By 2040
- 308,808 · +8.2%
- By 2050
- 321,011 · +12.4%
- By 2075
- 338,497 · +18.6%
- By 2100
- 330,493 · +15.8%
Race, ethnicity, and origin ACS 2023
- Neighborhood character
- Predominantly Hispanic (67%)
- Race & ethnicity
- Hispanic / Latino 67% White 30% Two or more races 10% Native American 3% Asian 2%
- Hispanic origin (detail)
- Mexican 65%
- Common ancestry
- Russian 14% Lithuanian 4% Italian 3%
- Foreign-born
- 34% · Canada
- Languages at home
- 41% English-only · Spanish 51% Other Indo-European 6% Tagalog/Filipino 1%
Political lean MEDSL · Merced
- 2024 margin
- Toss-up / Even · D 46.5% · R 50.9% · Other 2.6%
- 2008→2024 swing
- -12.7pp toward R · 2008: 8.3pp · 2024: -4.4pp
- All cycles
- 2024: R+4.4 2020: D+10.6 2016: D+7.9 2012: D+5.4 2008: D+8.3
Not yet ingested
- Civics
- —
Market trends
- HPI YoY
- ▼ -119.43%
- Current HPI
- 264.2504
- Rent YoY
- —
- Metro
- —
- State GDP YoY
- ▲ 3.21%
- F500 in state
- 116
Industry mix (Fortune 500 HQ in CA)
| Industry | F500 HQs | Revenue |
|---|---|---|
| Technology | 27 | $1,492B |
|
||
| Financial Services | 3 | $174B |
|
||
| Retail | 3 | $44B |
|
||
| Insurance | 3 | $26B |
|
||
| Media / Entertainment | 2 | $115B |
|
||
| Pharmaceuticals / Biotech | 2 | $62B |
|
||
Property tax history
-6.4%/yrLatest (2020): $208 · +2.5% YoY. Source: county tax records.
Cash-flow waterfall
monthlySold comps — $/sqft
last 12 mo · ≤1 miLoading sold comps…