3916 Richard Ave · Grove City, OH
Flood risk 1/10 · Minimal
- FEMA flood zone
- X (unshaded)
- Chance of flooding over 30 yrs
- 0.0%
- Est. flood insurance / yr
- $507 – $1,088
Fire risk 1/10 · Minimal
- Est. fire insurance / yr
- $713 – $1,323
Heat risk 4/10 · Minor
- Hot days now (above 101°F)
- 7 days/yr
- Hot days in 30 yrs
- 18 days/yr
Wind risk 2/10 · Minimal
- Chance of severe wind over 30 yrs
- 1.0%
Air-quality risk 2/10 · Minimal
- Unhealthy air days now
- 1 days/yr
- Unhealthy air days in 30 yrs
- 2 days/yr
Risk factors via First Street. Map © Google.
Why this score? — see what drove the C grade
The composite is a weighted blend of 9 inputs, each scored 0–100. Each bar is that input's sub-score; the figure is the points it added to the 100-point composite (weight × sub-score).
- Cash flow +18.2/30.0
- ARV discount +15.0/15.0
- DSCR +5.7/10.0
- 1% rule +4.8/10.0
- Livability +3.9/5.0
- Schools +3.8/10.0
- Rent growth +3.4/5.0
- Condition / age +2.5/5.0
- Appreciation +0.0/10.0
$224,999
🖨 Deal sheet 📄 Offer letter ✓ Due diligence
Listing remarks
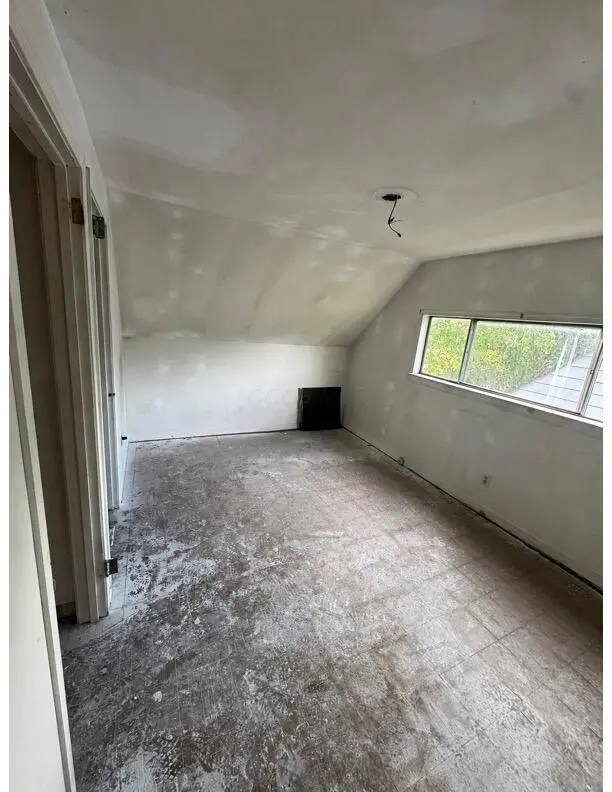
INVESTOR SPECIAL IN GROVE CITY! Rare opportunity to finish a project that's already well underway. Building permits have already been pulled. Excellent opportunity for a fix-and-flip, BRRRR strategy, or long-term rental investment. Strong after-repair value potential in an established Grove City location with convenient access to shopping, dining, schools, and major highways. Sold AS-IS. Cash, hard money, or private money only.
Key facts
- Convenient access
- Grove city location
- 6,969 sq ft lot
Tags
Property features AI
Exterior
- Parking: Attached garage (1 car)
- Utilities: Public water; Public sewer
- Home design: Single family residence; Two levels; Built in 1955; No shared/common walls
- Construction: Slab foundation
- Exterior features: Lot approximately 0.16 acre
Interior
- Bedrooms: Three main-level bedrooms
- Bathrooms: Two full bathrooms
- Interior features: Living area approximately 1,720
Neighborhood map
What this means for you Summary
Snapshot
- This is a 4-bed/2.0-bath single-family listed at $225k.
Deal economics
- At list price, monthly cash flow is $204 ($2k/yr) — positive.
- The deal already cash-flows at list — no discount required.
- To meet the 1% rule (rent ≥ 1% of price), the offer needs to be $220k (2.2% below list).
- Recommended offer: $220k (2.2% below list) — sets the bar for 1% rule.
- Cap rate 7.4% vs local median 2.7% in Grove City — top-decile yield for the area; either an underpriced asset or a hidden risk that comps aren't pricing in. Stress-test before assuming the spread holds.
Location & tenants
- Location reads 77/100 on livability (#190 in OH, #2,911 nationally) — a middle-class / working-renter tenant base. Strengths: schools A+, employment A+, cost of living A+; Watch: commute D, amenities F, health & safety F.
- South-Western City (suburban): math 40% / reading 48% proficiency, ranked #500 of 656 in OH (top 76%) — families likely to look elsewhere, expect single-tenant / working-renter base with shorter leases.
- Market conditions: Rents rising (+3.7%/yr); 329 active listings in the ZIP; 10 comparable units currently listed for rent nearby; rentals at typical pace (median 24d on market — plan ~3-4 weeks tenant-placement turnaround); solid renter incomes; 8,139 units permitted in Franklin County in 2024 (5,940 in 5+ unit buildings).
Forward outlook
- Local home prices are declining (-3.0%/yr); year-one equity from $2k of loan paydown is wiped out by about $7k of value loss. Plan a longer hold.
- Franklin County population projected at +34% by 2050 — long-run rental-demand tailwind backs the buy-and-hold thesis.
Negotiation context
- Only 13 days on market — expect competitive offers; lowballing is unlikely to land.
- 2 sale attempts with the ask held roughly flat each time — persistent listings suggest the price (not the market) is what's stuck; bring a comps-based counter.
- Current owner paid $190k; 18% above their basis — modest negotiation headroom, anchor on the comps not their cost.
Risks & watch-outs
- Watch-outs: built in 1955 — expect roof / HVAC / electrical / plumbing capex.
Questions for the listing agent
- Built in 1955 — when were the roof, HVAC, electrical panel, plumbing, and water heater last replaced?
- Is there a deadline driving the sale (1031 exchange, divorce, estate, relocation)? That informs how much negotiation room exists.
- Schools are A-rated — typically a magnet for longer-tenancy family renters. What's the average tenant stay here, and is there a school-zone premium baked into asking?
- What's the average days-on-market for RENTAL listings here right now (not sales)? A rising rental-DOM trend means longer vacancies and softer asking-rent achievability than the comps imply.
- What's the recent tenant-quality profile in this submarket — average credit score on applications, eviction rate, late-payment / NSF rate, and stable-employment percentage? A property-management company in the area should have these aggregated.
- How much new for-sale + rental construction is in the pipeline within 1–3 miles? Heavy new supply typically softens prices + rents 12–24 months out; constrained supply supports both.
Investment metrics
- 1% rule
- 0.98% ✗
- Cap rate
- 7.38%
- Cash-on-cash
- 3.88%
- DSCR
- 1.17
- GRM
- 8.5
CMA / ARV
- ARV (on-the-fly)
- $326,800
- Comps found
- 12
Show comp detail 12 sales within ~0.75 mi
| Address | Dist | Beds/Ba | Sqft | Sold | Price | $/sf | Match |
|---|---|---|---|---|---|---|---|
| 3126 Thomas Ave | 0.49mi | 4/2.0 | 1,701 (-1%) | 2mo | $323,000 | $190 | 74 |
| 3861 Tamara Dr | 0.31mi | 4/2.5 | 1,800 (+5%) | 3mo | $205,000 | $114 | 74 |
| 3741 Christopher Pl | 0.35mi | 4/1.5 | 1,856 (+8%) | 1mo | $345,000 | $186 | 68 |
| 2980 Barbee Ave | 0.36mi | 4/1.5 | 1,560 (-9%) | 1mo | $335,000 | $215 | 65 |
| 4241 Ashgrove Dr | 0.45mi | 3/2.0 (-1) | 1,800 (+5%) | 2mo | $298,000 | $166 | 65 |
| 3958 La Rosa Ct | 0.15mi | 3/2.0 (-1) | 1,944 (+13%) | 2mo | $300,000 | $154 | 64 |
| 3933 Glenna Ave | 0.45mi | 3/2.0 (-1) | 1,600 (-7%) | 0mo | $305,000 | $191 | 62 |
| 2723 Yates Ave | 0.74mi | 3/2.0 (-1) | 1,703 (-1%) | 3mo | $340,000 | $200 | 56 |
| 2711 Suann Ave | 0.64mi | 3/1.5 (-1) | 1,676 (-3%) | 4mo | $320,000 | $191 | 55 |
| 3060 Sawyer Dr | 0.37mi | 3/2.0 (-1) | 1,464 (-15%) | 6mo | $340,000 | $232 | 48 |
| 3474 Independence St | 0.71mi | 4/2.5 | 1,891 (+10%) | 3mo | $356,000 | $188 | 46 |
| 3139 Kingswood Dr | 0.72mi | 3/1.5 (-1) | 1,540 (-10%) | 2mo | $290,000 | $188 | 40 |
Match score weights: distance 35% · size 25% · config 20% · recency 20%. Top-matched comps best support the ARV.
Projected returns pro-forma
-3.0% appreciation · 3.68% rent growth · sell at horizon
- IRR
- -9.5%
- Equity multiple
- 0.65×
- Total profit
- $-21,959
- Equity at exit
- $33,548
- IRR
- 0.9%
- Equity multiple
- 1.06×
- Total profit
- $3,961
- Equity at exit
- $19,454
Cash invested: $63,000 (down + closing). Projections, not guarantees.
Landlord ↔ Tenant lean methodology
- Overall (STATE)
- 73 Landlord-Friendly
- State Ohio
- 73 Landlord-Friendly · R+6
- County
- — inherits STATE
- City
- — inherits STATE
ZIP-level market 43123
- Rents YoY
- 3.7%
- Active inventory
- 329
- Price-to-rent
- 8.5×
Monthly cashflow live
- Estimated rent
- $2,200 high interval (Pro) →
- Mortgage (P&I)
- −$1,180
- Tax from tax record
- −$261 /mo · $3,130/yr
- Insurance
- −$94
- HOA
- −$0
- Vacancy / Maint / Mgmt
- −$462
- Net cashflow
- $204
Break-even live
UW: 25.0% down · 7.5% · 30yr · 1.5% tax · 5.0% vac · 8.0% maint · 8.0% mgmt
Financing live
Cash to close
- Down payment
- $56,250
- Closing costs
- $6,750
- Reserves months
- —
- Total cash needed
- —
Loan-product check · same deal, 3 products live
Conventional
25% down · 7.5% · 30yr
- Down + closing
- —
- Monthly P&I
- —
- Monthly cashflow
- —
- DSCR
- —
- Eligible?
- —
Personal DTI + credit; lowest rate.
DSCR
20% down · 8.5% · 30yr
- Down + closing
- —
- Monthly P&I
- —
- Monthly cashflow
- —
- DSCR
- —
- Eligible?
- —
No personal income docs; deal must DSCR.
Hard money
10% down · 12.0% · 12mo
- Down + closing
- —
- Monthly P&I
- —
- Monthly cashflow
- —
- DSCR
- —
- Eligible?
- —
Short-term bridge; refi at stabilization.
Rent comps 10 comps
| Address | Beds | Baths | Sqft | Rent | $/sqft | DOM | Units | Dist |
|---|---|---|---|---|---|---|---|---|
| 3925 Irwin Ave Grove City, OH | 3.0 | 2.0 | 1777 | $2,047 | $1.15 | 23d | 1 | 0.09mi |
| 2906 Woodgrove Dr Grove City, OH | 4.0 | 2.0 | 1582 | $2,200 | $1.39 | 43d | 1 | 0.68mi |
| 2906 Woodgrove Dr Grove City, OH | 4.0 | 2.0 | 1582 | $2,200 | $1.39 | 14d | 1 | 0.68mi |
| 3451 Kells Way Grove City, OH | 1.0–3.0 | 1.0–2.5 | 1144 | $3,101 | $2.71 | 1d | 22 | 0.72mi |
| 3986 Parkmead Dr Grove City, OH | 1.0–3.0 | 1.0–2.0 | 954 | $2,150 | $2.25 | 11d | 9 | 0.93mi |
| 3501 Woodlawn Ave Grove City, OH | 4.0 | 1.5 | 1500 | $2,175 | $1.45 | 23d | 1 | 0.95mi |
| 4270 Broadway Grove City, OH | 3.0 | 3.0 | 1610 | $2,250 | $1.40 | 43d | 1 | 0.99mi |
| 4243 Farr Ct Grove City, OH | 2.0–3.0 | 1.0 | 935 | $1,599 | $1.71 | 12d | 13 | 1.08mi |
| 2422 Salem Ave Grove City, OH | 4.0 | 1.5 | 1910 | $2,555 | $1.34 | 1d | 1 | 1.11mi |
| 3103 Charles Dr Grove City, OH | 3.0 | 1.0 | 1135 | $1,700 | $1.50 | 23d | 1 | 1.16mi |
Listing history 9 events
-
2026-06-18days on market $224,999 Active 13 DOM
-
2026-06-17days on market $224,999 Active 12 DOM
-
2026-06-16days on market $224,999 Active 11 DOM
-
2026-06-15days on market $224,999 Active 10 DOM
-
2026-06-13days on market $224,999 Active 8 DOM
-
2026-06-09days on market $224,999 Active 4 DOM
-
2026-06-08days on market $224,999 Active 3 DOM
-
2026-06-07remarks 431-char remark
-
2026-06-07$224,999 Active 2 DOM
ⓘ Source: listings_history table (triggers on properties + properties_extension) + one-shot
backfill from property_details.listing_events for pre-trigger history.
Tax reassessment forecast OH · Partial reset (capped growth)
- Current annual tax
- $3,130 · $261/mo
- Projected year-2 tax
- $3,320 · $277/mo
- Expected delta
- +$190/yr (+$16/mo · 6.1%)
ⓘ Screening estimate from a state-policy table — verify with the county assessor before closing.
Climate risk First Street
- Flood 1/10 Low FEMA zone X (unshaded) · 0% chance over 30 yrs
- Wildfire 1/10 Low
- Heat 4/10 Moderate 7 d/yr ≥101°F today · 18 d/yr by 30 yrs out
- Wind 2/10 Low 100% chance of damaging wind over 30 yrs
- Air quality 2/10 Low 1 unhealthy d/yr today · 2 by 30 yrs out
Nearby sold comps map
Loading sold comps map…
Walkable amenities ~0.75 mi
Loading nearby amenities…
Taxation est. · year 1
- Rental income
- $26,401
- − Mortgage interest
- −$12,603
- − Property taxes
- −$3,130
- − Insurance
- −$1,125
- − Repairs & maintenance
- −$2,112
- − Management
- −$2,112
- − Depreciation
- −$6,545
- Taxable loss
- −$1,227
- Est. tax savings @ 24.0%
- +$295
- After-tax cash flow
- $2,737/yr
For passive investors: Depreciation is non-cash, so a rental often shows a tax loss while cash-flowing — sheltering income. Rental losses are passive: they offset passive income freely, and up to $25,000/yr can offset ordinary (W-2) income if you actively participate and your MAGI is under $100k (phasing out to $0 by $150k); unused losses carry forward. On sale, claimed depreciation is recaptured at up to 25%, and gains may owe capital-gains tax (a 1031 exchange can defer both). Figures are a year-1 estimate at your 24.0% rate — not tax advice; consult a CPA.
Schools (NCES district)
- District
- South-Western City
- NCES district ID
- 3904480
- Math proficiency
- 40% ▼ -18.00%
- Reading proficiency
- 48% ▼ -10.00%
- Median HH income
- $51,689
- Composite
- 37.95/100
- National rank
- #4305
- State rank
- #500 of 656 in OH
Livability — Grove City
- Score
- 77/100
- State rank
- #190
- US rank
- #2911
Category grades
Schools grade is shown separately in the Schools card above.
Census & demographics
- Census place
- Grove City, OH
- County
- Franklin County · 1,351,780 people
- City population
- 67,626
- Metro
- Columbus, OH
- Population (ZIP)
- 67,626
- Household income
- $91,008
- Rent vs Own
- Severe rent burden
- 1087.0
Population outlook (Franklin County) Hauer SSP2
- Today (2025)
- 1,456,139 people
- By 2030
- 1,556,890 · +6.9%
- By 2040
- 1,757,349 · +20.7%
- By 2050
- 1,950,539 · +34.0%
- By 2075
- 2,376,171 · +63.2%
- By 2100
- 2,636,796 · +81.1%
Race, ethnicity, and origin ACS 2023
- Neighborhood character
- Predominantly White (84%)
- Race & ethnicity
- White 84% Two or more races 6% Hispanic / Latino 5% Black 5% Asian 2%
- Common ancestry
- Romanian 2% Slovak 2% Italian 2%
- Foreign-born
- 4% · Canada, Vietnam, China
- Languages at home
- 93% English-only · Spanish 3% Russian/Polish/Slavic 1% Other Indo-European 1%
Political lean MEDSL · Franklin
- 2024 margin
- Strong D (+28.4) · D 63.7% · R 35.3% · Other 1.0%
- 2008→2024 swing
- +7.7pp toward D · 2008: 20.7pp · 2024: 28.4pp
- All cycles
- 2024: D+28.4 2020: D+31.4 2016: D+25.9 2012: D+21.7 2008: D+20.7
Not yet ingested
- Civics
- —
Market trends
- HPI YoY
- ▼ -241.42%
- Current HPI
- 238.709
- Rent YoY
- ▲ 3.68%
- Metro
- Columbus, OH
- State GDP YoY
- ▲ 1.98%
- F500 in state
- 48
Industry mix (Fortune 500 HQ in OH)
| Industry | F500 HQs | Revenue |
|---|---|---|
| Insurance | 3 | $145B |
|
||
| Industrial Machinery | 3 | $49B |
|
||
| Financial Services | 3 | $24B |
|
||
| Consumer Goods | 2 | $93B |
|
||
| Aerospace / Defense | 2 | $47B |
|
||
| Utilities | 2 | $33B |
|
||
Price history
+435.7% since first listed4 events — show timeline
- 2026-06-05 Listed $224,999 CBRMLS
- 2025-05-02 Sold (MLS) $190,000 CBRMLS
- 2025-04-30 Listed $200,000 CBRMLS
- 1995-04-03 Sold (Public Records) $42,000 Public Records
Property tax history
+2.3%/yrLatest (2024): $3,130 · +0.3% YoY. Source: county tax records.
Cash-flow waterfall
monthlySold comps — $/sqft
last 12 mo · ≤1 miLoading sold comps…