 🏗️ New Construction
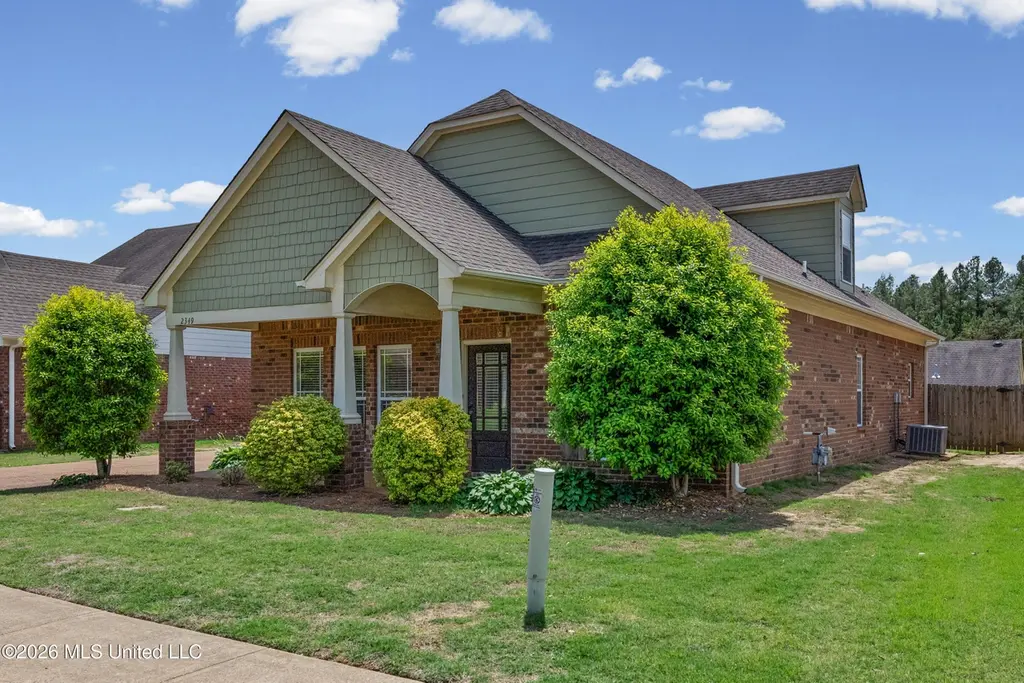
2349 Saint Ives Ln · Hernando, MS
Flood risk 1/10 · Minimal
- FEMA flood zone
- X (unshaded)
- Chance of flooding over 30 yrs
- 0.0%
- Est. flood insurance / yr
- $507 – $1,088
Fire risk 4/10 · Minor
- Est. fire insurance / yr
- $1,241 – $2,305
Heat risk 6/10 · Moderate
- Hot days now (above 109°F)
- 7 days/yr
- Hot days in 30 yrs
- 21 days/yr
Wind risk 4/10 · Minor
- Chance of severe wind over 30 yrs
- 20.0%
Air-quality risk 2/10 · Minimal
- Unhealthy air days now
- 1 days/yr
- Unhealthy air days in 30 yrs
- 2 days/yr
Risk factors via First Street. Map © Google.
Why this score? — see what drove the D- grade
The composite is a weighted blend of 9 inputs, each scored 0–100. Each bar is that input's sub-score; the figure is the points it added to the 100-point composite (weight × sub-score).
- Cash flow +12.3/30.0
- ARV discount +7.5/15.0
- Schools +4.0/10.0
- DSCR +3.6/10.0
- Livability +3.5/5.0
- 1% rule +2.7/10.0
- Condition / age +2.5/5.0
- Rent growth +2.4/5.0
- Appreciation +0.0/10.0
$349,900
🖨 Deal sheet (PDF) 📄 Offer letter ✓ Due diligence
Listing remarks MLS
The "St. Andrew", a beautiful floorplan that features 3 bedrooms, 2 baths, a finished bonus room upstairs and a 2 car garage. Other ammenities include smooth ceilings, a covered front porch, hardwood floors in the living room and dining area, tile in the kitchen and bath ares, granite counter tops in the kitchen and stainless steel appliances. This house is located in the craftsman style subdivision of Saint Ives, featuring the charm of yesterday with the conveinences of today.
Key facts
- Gas fireplace
- Open layout
- Bar area
Tags
Property features AI
Finance
- HOA & community: Homeowner association with an annual fee of $330; Community sidewalks
Exterior
- Parking: 2-car garage; Concrete parking
- Utilities: Public water; Public sewer; Electricity available; Natural gas available; Cable available; Sewer available
- Home design: Single-family house; Two levels; New construction
- Construction: Brick veneer and HardiPlank siding; Architectural shingle roof; Slab foundation; Built recently (new construction)
- Exterior features: Patio; Private yard; Rain gutters; Landscaped lot; Wood fencing
Interior
- Kitchen: Convection oven; Dishwasher; Disposal; Electric cooktop; Microwave; Range hood; Stainless steel appliances
- Flooring: Carpet; Combination flooring; Tile; Wood
- Bathrooms: 2 full bathrooms
- Heating & cooling: Central heating; Central air conditioning
- Interior features: Breakfast bar; Ceiling fans; Granite counters; Soaking tub; Double vanity; Dead-bolt locks; Insulated doors; Vinyl windows; Gas-log fireplace in the living room
- Laundry & utility: Dedicated laundry room
Neighborhood map
What this means for you Summary
Snapshot
- This is a 4-bed/2.0-bath single-family listed at $350k.
Deal economics
- At list price, monthly cash flow is $-67 ($-799/yr) — negative.
- To cash-flow at today's rent, offer at most $346k (1.2% below list).
- To meet the 1% rule (rent ≥ 1% of price), the offer needs to be $276k (21.0% below list).
- Recommended offer: $276k (21.0% below list) — sets the bar for 1% rule.
- Cap rate 6.1% vs local median 4.3% in Hernando — top-decile yield for the area; either an underpriced asset or a hidden risk that comps aren't pricing in. Stress-test before assuming the spread holds.
Location & tenants
- Location reads 70/100 on livability (#44 in MS) — a middle-class / working-renter tenant base. Strengths: crime A+, cost of living A+, housing A+; Watch: amenities F, commute F, health & safety F.
- Desoto County School District (suburban): math 48% / reading 42% proficiency, ranked #20 of 130 in MS (top 15%) — families likely to look elsewhere, expect single-tenant / working-renter base with shorter leases.
- Zoned schools: Hernando Elem (779 students, 100% FRL); Hernando Middle School (math 75% / reading 57%, grade A-, #2 of 179 statewide, top 1%, 1,150 students, 100% FRL); Hernando High School (math 69% / reading 62%, grade B, #2 of 197 statewide, top 1%, 1,419 students, 100% FRL) — zoned schools average 100% FRL vs 43% district-wide (56 pts higher); higher-poverty schools than district average — tighter screening recommended.
- Zoned-school proficiency averages 66% at this address vs 45% district-wide (+21 pts) — the actual schools serving this property are materially stronger than the Desoto County School District average implies; a family-tenant draw the district grade alone would hide.
- Market conditions: Rents soft (-0.4%/yr); 407 active listings in the ZIP; 2 comparable units currently listed for rent nearby; solid renter incomes; 1,155 units permitted in DeSoto County in 2024 (0 in 5+ unit buildings).
- This rent runs 35% of the median local income ($94k/yr) — at the standard rent-burdened threshold; future hikes will face affordability resistance.
Forward outlook
- Local home prices are declining (-3.0%/yr); year-one equity from $2k of loan paydown is wiped out by about $11k of value loss. Plan a longer hold.
- DeSoto County population projected at +33% by 2050 — long-run rental-demand tailwind backs the buy-and-hold thesis.
Negotiation context
- It's been on market 39 days — a 3% lower offer ($339k) is reasonable based on typical stale-listing flexibility.
- 2 sale attempts since 13y ago with the ask held roughly flat each time — persistent listings suggest the price (not the market) is what's stuck; bring a comps-based counter.
Risks & watch-outs
- Climate carrying-cost: extreme-heat days projected 7→21/yr by 2055 (HVAC capex compounding) — expect insurance premiums to compound above CPI over the hold.
Questions for the listing agent
- What do current leases actually rent for vs. the listed asking? Can we see a recent rent roll and the last 12 months of T-12 income?
- It's been on market 39 days. Have you received any prior offers? Is the seller open to a 21% concession, seller financing, or rate buy-down credit?
- What does the HOA fee cover, when was the last increase, and are there any pending special assessments or reserve-fund shortfalls?
- Is there a deadline driving the sale (1031 exchange, divorce, estate, relocation)? That informs how much negotiation room exists.
- Schools are B-rated — typically a magnet for longer-tenancy family renters. What's the average tenant stay here, and is there a school-zone premium baked into asking?
- The area grade is low — what's the realistic commute time and amenity access for the typical tenant pool here? Any planned neighborhood developments (good or bad) we should know about?
- What's the average days-on-market for RENTAL listings here right now (not sales)? A rising rental-DOM trend means longer vacancies and softer asking-rent achievability than the comps imply.
- What's the recent tenant-quality profile in this submarket — average credit score on applications, eviction rate, late-payment / NSF rate, and stable-employment percentage? A property-management company in the area should have these aggregated.
- How much new for-sale + rental construction is in the pipeline within 1–3 miles? Heavy new supply typically softens prices + rents 12–24 months out; constrained supply supports both.
Investment metrics
- 1% rule
- 0.77% ✗
- Cap rate
- 6.07%
- Cash-on-cash
- -0.80%
- DSCR
- 0.96
- GRM
- 10.8
CMA / ARV
- ARV (median comp)
- $357,549
- List price
- $349,900
- Delta
- -2.14%
- Verdict
- FAIR
- Comps
- 20 within 1.0 mi
Show comp detail 1 sale within ~0.75 mi
| Address | Dist | Beds/Ba | Sqft | Sold | Price | $/sf | Match |
|---|---|---|---|---|---|---|---|
| 3630 Tanna Cv | 0.52mi | 3/2.0 (-1) | 1,752 (+13%) | 19mo | $298,000 | $170 | 34 |
Match score weights: distance 35% · size 25% · config 20% · recency 20%. Top-matched comps best support the ARV.
Projected returns pro-forma
-3.0% appreciation · 0.0% rent growth · sell at horizon
- IRR
- -20.7%
- Equity multiple
- 0.30×
- Total profit
- $-70,374
- Equity at exit
- $53,312
- IRR
- -21.9%
- Equity multiple
- 0.02×
- Total profit
- $-98,431
- Equity at exit
- $30,914
Cash invested: $100,114 (down + closing). Projections, not guarantees.
Landlord ↔ Tenant lean methodology
- Overall (STATE)
- 90 Strongly Landlord-Friendly
- State Mississippi
- 90 Strongly Landlord-Friendly · R+11
- County
- — inherits STATE
- City
- — inherits STATE
ZIP-level market 38632
- Home prices YoY
- -31.8%
- Rents YoY
- -0.4%
- Active inventory
- 407
- Price-to-rent
- 10.5×
Monthly cashflow live
- Estimated rent
- $2,765 medium interval (Pro) →
- Mortgage (P&I)
- −$1,875
- Tax from tax record
- −$199 /mo · $2,383/yr
- Insurance
- −$149
- HOA
- −$28
- Vacancy / Maint / Mgmt
- −$581
- Net cashflow
- $-67
Break-even live
Sensitivity live
| Price | -10% $136 | -5% $35 | +0% $-67 | +5% $-168 | +10% $-269 |
|---|---|---|---|---|---|
| Rent | -10% $-285 | -5% $-176 | +0% $-67 | +5% $43 | +10% $152 |
| Rate | -1.0pp $113 | -0.5pp $24 | base $-67 | +0.5pp $-159 | +1.0pp $-253 |
UW: 25.0% down · 7.5% · 30yr · 1.5% tax · 5.0% vac · 8.0% maint · 8.0% mgmt
Financing live
Cash to close
- Down payment
- $89,387
- Closing costs
- $10,726
- Reserves months
- —
- Total cash needed
- —
Loan-product check · same deal, 3 products live
Conventional
25% down · 7.5% · 30yr
- Down + closing
- —
- Monthly P&I
- —
- Monthly cashflow
- —
- DSCR
- —
- Eligible?
- —
Personal DTI + credit; lowest rate.
DSCR
20% down · 8.5% · 30yr
- Down + closing
- —
- Monthly P&I
- —
- Monthly cashflow
- —
- DSCR
- —
- Eligible?
- —
No personal income docs; deal must DSCR.
Hard money
10% down · 12.0% · 12mo
- Down + closing
- —
- Monthly P&I
- —
- Monthly cashflow
- —
- DSCR
- —
- Eligible?
- —
Short-term bridge; refi at stabilization.
Rent comps 2 comps
| Address | Beds | Baths | Sqft | Rent | $/sqft | DOM | Units | Dist |
|---|---|---|---|---|---|---|---|---|
| 2070 Hyacinth Ln Hernando, MS | 5.0 | 3.0 | 2016 | $2,270 | $1.13 | 3d | 1 | 0.32mi |
| 3426 Clepsyda Dr Hernando, MS | 3.0 | 2.0 | 1943 | $1,995 | $1.03 | 45d | 1 | 1.11mi |
HOA detail
- Monthly dues
- $28 · $336/yr
Listing history 17 events
-
2026-06-21days on market $349,900 Active 39 DOM
-
2026-06-18days on market $349,900 Active 36 DOM
-
2026-06-17days on market $349,900 Active 35 DOM
-
2026-06-16days on market $349,900 Active 34 DOM
-
2026-06-15days on market $349,900 Active 33 DOM
-
2026-06-13days on market $349,900 Active 31 DOM
-
2026-06-10days on market $349,900 Active 28 DOM
-
2026-06-09days on market $349,900 Active 27 DOM
-
2026-06-08days on market $349,900 Active 26 DOM
-
2026-06-07days on market $349,900 Active 25 DOM
-
2026-06-03days on market $349,900 Active 21 DOM
-
2026-06-02days on market $349,900 Active 20 DOM
-
2026-06-01days on market $349,900 Active 19 DOM
-
2026-05-31days on market $349,900 Active 18 DOM
-
2026-05-13$349,900 Active 1093-char remark
-
2013-08-09soldstatus 492-char remark
Show marketing remark (492 chars)
The "St. Andrew", a beautiful floorplan that features 3 bedrooms, 2 baths, a finished bonus room upstairs and a 2 car garage. Other ammenities include smooth ceilings, a covered front porch, hardwood floors in the living room and dining area, tile in the kitchen and bath ares, granite counter tops in the kitchen and stainless steel appliances. This house is located in the craftsman style subdivision of Saint Ives, featuring the charm of yesterday with the conveinences of today.
-
2013-03-25$169,900 492-char remark
Show marketing remark (492 chars)
The "St. Andrew", a beautiful floorplan that features 3 bedrooms, 2 baths, a finished bonus room upstairs and a 2 car garage. Other ammenities include smooth ceilings, a covered front porch, hardwood floors in the living room and dining area, tile in the kitchen and bath ares, granite counter tops in the kitchen and stainless steel appliances. This house is located in the craftsman style subdivision of Saint Ives, featuring the charm of yesterday with the conveinences of today.
ⓘ Source: listings_history table (triggers on properties + properties_extension) + one-shot
backfill from property_details.listing_events for pre-trigger history.
Tax reassessment forecast MS · Resets to sale price
- Current annual tax
- $2,383 · $199/mo
- Projected year-2 tax
- $2,764 · $230/mo
- Expected delta
- +$381/yr (+$32/mo · 16.0%)
ⓘ Screening estimate from a state-policy table — verify with the county assessor before closing.
Climate risk First Street
- Flood 1/10 Low FEMA zone X (unshaded) · 0% chance over 30 yrs
- Wildfire 4/10 Moderate
- Heat 6/10 Major 7 d/yr ≥109°F today · 21 d/yr by 30 yrs out
- Wind 4/10 Moderate 20% chance of damaging wind over 30 yrs
- Air quality 2/10 Low 1 unhealthy d/yr today · 2 by 30 yrs out
Nearby sold comps map
Loading sold comps map…
Walkable amenities ~0.75 mi
Loading nearby amenities…
Taxation est. · year 1
- Rental income
- $33,175
- − Mortgage interest
- −$20,028
- − Property taxes
- −$2,383
- − Insurance
- −$1,788
- − Repairs & maintenance
- −$2,654
- − Management
- −$2,654
- − HOA
- −$336
- − Depreciation
- −$10,401
- Taxable loss
- −$7,070
- Est. tax savings @ 24.0%
- +$1,697
- After-tax cash flow
- $898/yr
For passive investors: Depreciation is non-cash, so a rental often shows a tax loss while cash-flowing — sheltering income. Rental losses are passive: they offset passive income freely, and up to $25,000/yr can offset ordinary (W-2) income if you actively participate and your MAGI is under $100k (phasing out to $0 by $150k); unused losses carry forward. On sale, claimed depreciation is recaptured at up to 25%, and gains may owe capital-gains tax (a 1031 exchange can defer both). Figures are a year-1 estimate at your 24.0% rate — not tax advice; consult a CPA.
Schools (NCES district)
- District
- Desoto County School District
- NCES district ID
- 2801320
- Math proficiency
- 48% ▼ -13.00%
- Reading proficiency
- 42% ▼ -6.00%
- Median HH income
- $59,272
- Composite
- 39.56/100
- National rank
- #3933
- State rank
- #20 of 130 in MS
Livability — Hernando
- Score
- 70/100
- State rank
- #44
- US rank
- #8034
Category grades
Schools grade is shown separately in the Schools card above.
Census & demographics
- Census place
- Hernando, MS
- County
- DeSoto County · 176,513 people
- City population
- 31,374
- Metro
- Memphis, TN-MS-AR
- Population (ZIP)
- 31,374
- Household income
- $93,583
- Rent vs Own
- Severe rent burden
- 24.0
Population outlook (DeSoto County) Hauer SSP2
- Today (2025)
- 203,338 people
- By 2030
- 217,692 · +7.1%
- By 2040
- 245,320 · +20.6%
- By 2050
- 270,133 · +32.8%
- By 2075
- 323,341 · +59.0%
- By 2100
- 348,742 · +71.5%
Race, ethnicity, and origin ACS 2023
- Neighborhood character
- Predominantly White (81%)
- Race & ethnicity
- White 81% Black 13% Two or more races 4% Hispanic / Latino 2%
- Common ancestry
- Italian 2% Serbian 2% Slovak 1%
- Foreign-born
- 2% · Canada
- Languages at home
- 98% English-only · Spanish 1% Arabic 1%
Political lean MEDSL · DeSoto
- 2024 margin
- Strong R (+24.1) · D 36.7% · R 60.8% · Other 2.5%
- 2008→2024 swing
- +14.2pp toward D · 2008: -38.2pp · 2024: -24.1pp
- All cycles
- 2024: R+24.1 2020: R+23.9 2016: R+34.8 2012: R+33.5 2008: R+38.2
Not yet ingested
- Civics
- —
Market trends
- HPI YoY
- ▼ -82.49%
- Current HPI
- 176.8843
- Rent YoY
- ▼ -0.43%
- Metro
- Memphis, TN-MS-AR
- State GDP YoY
- —
- F500 in state
- 0
Price history
+105.9% since first listed3 events — show timeline
- 2026-05-13 Listed $349,900 MLSU
- 2013-08-09 Sold (MLS) — MLSU
- 2013-03-25 Listed $169,900 MLSU
Property tax history
+12.9%/yrLatest (2025): $2,383 · +15.3% YoY. Source: county tax records.
Cash-flow waterfall
monthlySold comps — $/sqft
last 12 mo · ≤1 miLoading sold comps…