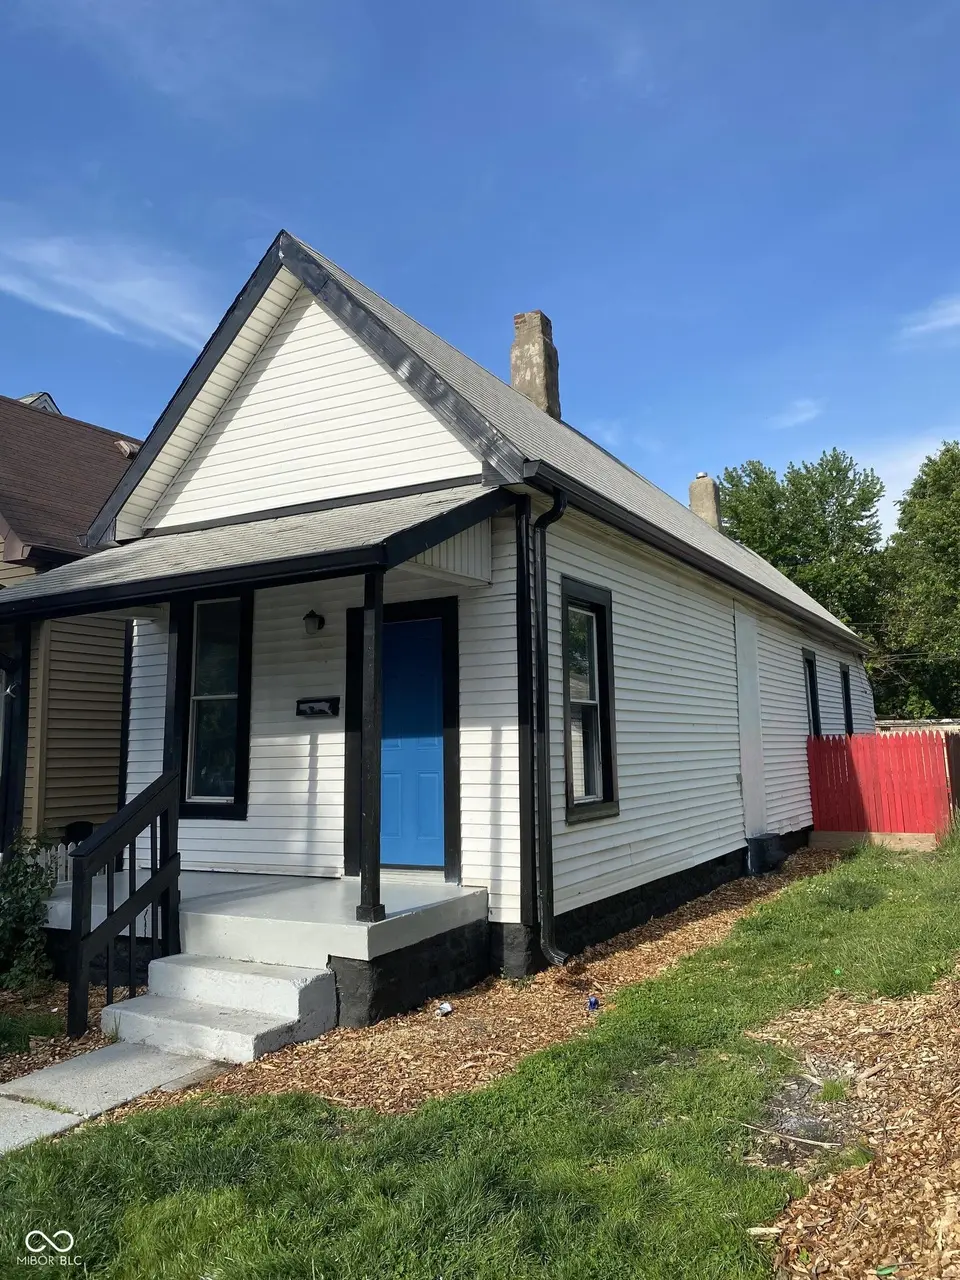
651 Division St · Indianapolis city (balance), IN
Flood risk 5/10 · Moderate
- FEMA flood zone
- X
- Chance of flooding over 30 yrs
- 0.24%
- Est. flood insurance / yr
- $507 – $1,088
Fire risk 1/10 · Minimal
- Est. fire insurance / yr
- $717 – $1,331
Heat risk 4/10 · Minor
- Hot days now (above 101°F)
- 7 days/yr
- Hot days in 30 yrs
- 19 days/yr
Wind risk 2/10 · Minimal
- Chance of severe wind over 30 yrs
- —
Air-quality risk 4/10 · Minor
- Unhealthy air days now
- 5 days/yr
- Unhealthy air days in 30 yrs
- 7 days/yr
Risk factors via First Street. Map © Google.
Why this score? — see what drove the C+ grade
The composite is a weighted blend of 9 inputs, each scored 0–100. Each bar is that input's sub-score; the figure is the points it added to the 100-point composite (weight × sub-score).
- Cash flow +24.3/30.0
- ARV discount +15.0/15.0
- DSCR +7.8/10.0
- 1% rule +6.7/10.0
- Rent growth +2.9/5.0
- Livability +2.5/5.0
- Condition / age +2.5/5.0
- Schools +1.4/10.0
- Appreciation +0.0/10.0
$124,500
🖨 Deal sheet 📄 Offer letter ✓ Due diligence
Listing remarks
This cozy 2-bedroom home sits in one of the hottest up and coming areas of Indy. Located within walking distance to Lucas Oil Stadium and the Convention Center and only blocks from The Elanco Global Headquarters and other planned development. New paint and flooring throughout. New kitchen upgrades and new hot water heater. Multiple investment possibilities with this; it is rent ready to hold as an LTR; or have an outstanding AirBnB. Don't let this one slip away!
Key facts
- New kitchen upgrades
- New hot water heater
- 2,570 sq ft lot
Tags
Property features AI
Exterior
- Utilities: Public water; Municipal sewer connected; Electricity connected (circuit breakers); Natural gas connected; Solid waste service
- Home design: Single-family residence; Updated/remodeled condition; One story
- Construction: Vinyl siding; Block foundation
- Exterior features: Covered porch; Partial privacy fencing; City lot with street lights
Interior
- Kitchen: Eat-in kitchen
- Bedrooms: 2 bedrooms on the main level
- Bathrooms: 1 full bathroom (main level)
- Heating & cooling: Forced air heating; Central air conditioning
- Interior features: Eat-in kitchen; Woodwork painted; Laundry in unit
- Laundry & utility: Dedicated laundry room; Water heater
Neighborhood map
What this means for you Summary
Snapshot
- This is a 2-bed/1.0-bath single-family listed at $124k.
Deal economics
- At list price, monthly cash flow is $250 ($3k/yr) — positive.
- The deal already cash-flows at list — no discount required.
- Meets the 1% rule at list price ($1k rent vs $124k).
- Recommended offer: $123k (1.5% below list) — sets the bar for market timing.
- Cap rate 8.7% vs local median 4.4% in Indianapolis city (balance) — top-decile yield for the area; either an underpriced asset or a hidden risk that comps aren't pricing in. Stress-test before assuming the spread holds.
Location & tenants
- Location reads: area grade C — affects rentability + tenant quality, not the cash-flow math above.
- Indianapolis Public Schools (urban): math 14% / reading 20% proficiency, ranked #286 of 301 in IN (top 95%) — low school quality limits family demand, transient renter base, plan for 1-2y turnover; 77% free/reduced lunch — lower-income household profile, screen leases tightly.
- Zoned schools: George Washington High School (math 2% / reading 17%, grade F, #366 of 369 statewide, top 99%, 753 students, 68% FRL).
- Market conditions: Rents rising (+1.8%/yr); 43 active listings in the ZIP; 15 comparable units currently listed for rent nearby; rentals at typical pace (median 15d on market — plan ~3-4 weeks tenant-placement turnaround); 1,906 units permitted in Marion County in 2024 (621 in 5+ unit buildings).
Forward outlook
- Local home prices are declining (-3.0%/yr); year-one equity from $861 of loan paydown is wiped out by about $4k of value loss. Plan a longer hold.
- Marion County population projected at +18% by 2050 — long-run rental-demand tailwind backs the buy-and-hold thesis.
Negotiation context
- It's been on market 27 days — a 2% lower offer ($123k) is reasonable based on typical stale-listing flexibility.
- 2 sale attempts since 2y ago with the ask held roughly flat each time — persistent listings suggest the price (not the market) is what's stuck; bring a comps-based counter.
Risks & watch-outs
- Watch-outs: built in 1955 — expect roof / HVAC / electrical / plumbing capex.
- Climate carrying-cost: moderate flood risk — expect insurance premiums to compound above CPI over the hold.
Questions for the listing agent
- Built in 1955 — when were the roof, HVAC, electrical panel, plumbing, and water heater last replaced?
- Is there a deadline driving the sale (1031 exchange, divorce, estate, relocation)? That informs how much negotiation room exists.
- What's the average days-on-market for RENTAL listings here right now (not sales)? A rising rental-DOM trend means longer vacancies and softer asking-rent achievability than the comps imply.
- What's the recent tenant-quality profile in this submarket — average credit score on applications, eviction rate, late-payment / NSF rate, and stable-employment percentage? A property-management company in the area should have these aggregated.
- How much new for-sale + rental construction is in the pipeline within 1–3 miles? Heavy new supply typically softens prices + rents 12–24 months out; constrained supply supports both.
Investment metrics
- 1% rule
- 1.17% ✓
- Cap rate
- 8.71%
- Cash-on-cash
- 8.62%
- DSCR
- 1.38
- GRM
- 7.1
CMA / ARV
- ARV (on-the-fly)
- $167,440
- Comps found
- 4
Show comp detail 4 sales within ~0.75 mi
| Address | Dist | Beds/Ba | Sqft | Sold | Price | $/sf | Match |
|---|---|---|---|---|---|---|---|
| 1623 Oliver Ave | 0.43mi | 2/1.0 | 744 (+2%) | 11mo | $158,000 | $212 | 67 |
| 617 Marion Ave | 0.15mi | 1/1.0 (-1) | 675 (-7%) | 14mo | $166,000 | $246 | 64 |
| 624 Holly Ave | 0.17mi | 1/1.0 (-1) | 675 (-7%) | 17mo | $155,000 | $230 | 61 |
| 817 Birch Ave | 0.19mi | 2/1.0 | 806 (+11%) | 19mo | $68,000 | $84 | 57 |
Match score weights: distance 35% · size 25% · config 20% · recency 20%. Top-matched comps best support the ARV.
Projected returns pro-forma
-3.0% appreciation · 1.79% rent growth · sell at horizon
- IRR
- -4.6%
- Equity multiple
- 0.83×
- Total profit
- $-5,926
- Equity at exit
- $18,563
- IRR
- 3.6%
- Equity multiple
- 1.25×
- Total profit
- $8,565
- Equity at exit
- $10,764
Cash invested: $34,860 (down + closing). Projections, not guarantees.
Landlord ↔ Tenant lean methodology
- Overall (STATE)
- 90 Strongly Landlord-Friendly
- State Indiana
- 90 Strongly Landlord-Friendly · R+11
- County
- — inherits STATE
- City
- — inherits STATE
ZIP-level market 46221
- Home prices YoY
- -23.7%
- Rents YoY
- 1.8%
- Active inventory
- 43
- Price-to-rent
- 7.1×
Monthly cashflow live
- Estimated rent
- $1,451 high interval (Pro) →
- Mortgage (P&I)
- −$653
- Tax from tax record
- −$191 /mo · $2,295/yr
- Insurance
- −$52
- HOA
- −$0
- Vacancy / Maint / Mgmt
- −$305
- Net cashflow
- $250
Break-even live
UW: 25.0% down · 7.5% · 30yr · 1.5% tax · 5.0% vac · 8.0% maint · 8.0% mgmt
Financing live
Cash to close
- Down payment
- $31,125
- Closing costs
- $3,735
- Reserves months
- —
- Total cash needed
- —
Loan-product check · same deal, 3 products live
Conventional
25% down · 7.5% · 30yr
- Down + closing
- —
- Monthly P&I
- —
- Monthly cashflow
- —
- DSCR
- —
- Eligible?
- —
Personal DTI + credit; lowest rate.
DSCR
20% down · 8.5% · 30yr
- Down + closing
- —
- Monthly P&I
- —
- Monthly cashflow
- —
- DSCR
- —
- Eligible?
- —
No personal income docs; deal must DSCR.
Hard money
10% down · 12.0% · 12mo
- Down + closing
- —
- Monthly P&I
- —
- Monthly cashflow
- —
- DSCR
- —
- Eligible?
- —
Short-term bridge; refi at stabilization.
Rent comps 15 comps
| Address | Beds | Baths | Sqft | Rent | $/sqft | DOM | Units | Dist |
|---|---|---|---|---|---|---|---|---|
| 1105 Blaine Ave Indianapolis, IN | 1.0–2.0 | 1.0–2.5 | 1157 | $1,795 | $1.55 | 23d | 1 | 0.39mi |
| 1925 Westview Dr Unit 100 Indianapolis, IN | 1.0 | 1.0 | 600 | $900 | $1.50 | 21d | 1 | 0.74mi |
| 1925 Westview Dr Unit 212 Indianapolis, IN | 1.0 | 1.0 | 600 | $900 | $1.50 | 7d | 1 | 0.74mi |
| 1925 Westview Dr Indianapolis, IN | 1.0 | 1.0 | 600 | $900 | $1.50 | 14d | 2 | 0.74mi |
| 1918 W Washington St Unit 12 Indianapolis, IN | 1.0 | 1.0 | 600 | $950 | $1.58 | 43d | 1 | 0.93mi |
| 841 S Addison St Indianapolis, IN | 2.0 | 1.0 | 750 | $1,295 | $1.73 | 43d | 1 | 1.12mi |
| 305 W Washington St Indianapolis, IN | 1.0 | 1.0 | 717 | $925 | $1.29 | 2d | 1 | 1.23mi |
| 460 N White River Parkway Dr W Indianapolis, IN | 2.0 | 1.0 | 681 | $1,725 | $2.53 | 3d | 14 | 1.26mi |
| 915 S Meridian St Indianapolis, IN | 2.0 | 1.0–2.0 | 829 | $2,551 | $3.08 | 1d | 42 | 1.29mi |
| 501 Madison Ave Indianapolis, IN | 1.0 | 1.0 | 800 | $1,412 | $1.76 | 23d | 2 | 1.39mi |
| 1909 S Pershing Ave Indianapolis, IN | 3.0 | 1.5 | 728 | $1,750 | $2.40 | 3d | 1 | 1.40mi |
| 50 N Illinois St Unit 1534468P Indianapolis, IN | 1.0–5.0 | 1.5–4.0 | 1770 | $4,021 | $2.27 | 1d | 3 | 1.44mi |
| 114 W Market St Indianapolis, IN | 1.0–3.0 | 1.0–2.0 | 1193 | $2,139 | $1.79 | 44d | 9 | 1.44mi |
| 30 E Georgia St Indianapolis, IN | 2.0 | 1.0–2.0 | 882 | $1,590 | $1.80 | 1d | 14 | 1.47mi |
| 1409 Union St Indianapolis, IN | 1.0 | 1.0 | 475 | $749 | $1.58 | 23d | 1 | 1.49mi |
Listing history 18 events
-
2026-06-18days on market $124,500 Active 27 DOM
-
2026-06-17days on market $124,500 Active 26 DOM
-
2026-06-16days on market $124,500 Active 25 DOM
-
2026-06-15days on market $124,500 Active 24 DOM
-
2026-06-13days on market $124,500 Active 22 DOM
-
2026-06-13pricedays on market $124,500 Active 21 DOM
-
2026-06-09days on market $129,000 Active 18 DOM
-
2026-06-08days on market $129,000 Active 17 DOM
-
2026-06-07days on market $129,000 Active 16 DOM
-
2026-06-03days on market $129,000 Active 12 DOM
-
2026-06-02days on market $129,000 Active 11 DOM
-
2026-06-01days on market $129,000 Active 10 DOM
-
2026-05-31days on market $129,000 Active 9 DOM
-
2026-05-21$129,000 Active
-
2025-03-31historical
-
2025-02-18price $94,900
-
2024-12-27price $97,000
-
2024-10-17$99,900 Active
ⓘ Source: listings_history table (triggers on properties + properties_extension) + one-shot
backfill from property_details.listing_events for pre-trigger history.
Tax reassessment forecast IN · Partial reset (capped growth)
- Current annual tax
- $2,295 · $191/mo
- Projected year-2 tax
- $2,295 · $191/mo
- Expected delta
- $0/yr ($0/mo · 0.0%)
ⓘ Screening estimate from a state-policy table — verify with the county assessor before closing.
Climate risk First Street
- Flood 5/10 Major FEMA zone X · 24% chance over 30 yrs
- Wildfire 1/10 Low
- Heat 4/10 Moderate 7 d/yr ≥101°F today · 19 d/yr by 30 yrs out
- Wind 2/10 Low
- Air quality 4/10 Moderate 5 unhealthy d/yr today · 7 by 30 yrs out
Nearby sold comps map
Loading sold comps map…
Walkable amenities ~0.75 mi
Loading nearby amenities…
Taxation est. · year 1
- Rental income
- $17,415
- − Mortgage interest
- −$6,974
- − Property taxes
- −$2,295
- − Insurance
- −$622
- − Repairs & maintenance
- −$1,393
- − Management
- −$1,393
- − Depreciation
- −$3,622
- Taxable income
- $1,115
- Est. tax owed @ 24.0%
- −$268
- After-tax cash flow
- $2,738/yr
For passive investors: Depreciation is non-cash, so a rental often shows a tax loss while cash-flowing — sheltering income. Rental losses are passive: they offset passive income freely, and up to $25,000/yr can offset ordinary (W-2) income if you actively participate and your MAGI is under $100k (phasing out to $0 by $150k); unused losses carry forward. On sale, claimed depreciation is recaptured at up to 25%, and gains may owe capital-gains tax (a 1031 exchange can defer both). Figures are a year-1 estimate at your 24.0% rate — not tax advice; consult a CPA.
Schools (NCES district)
- District
- Indianapolis Public Schools
- NCES district ID
- 1804770
- Math proficiency
- 14% ▼ -7.00%
- Reading proficiency
- 20% ▼ -3.00%
- Median HH income
- $32,034
- Composite
- 13.69/100
- National rank
- #9499
- State rank
- #286 of 301 in IN
Livability — Indianapolis city (balance)
No livability data for this city. (Only ~50 U.S. cities are tracked.)
Census & demographics
- Census place
- Indianapolis city (balance), IN
- County
- Marion County · 998,460 people
- City population
- 881,119
- Metro
- Indianapolis-Carmel-Anderson, IN
- Population (ZIP)
- 27,027
- Household income
- $65,280
- Rent vs Own
- Severe rent burden
- 1011.0
Population outlook (Marion County) Hauer SSP2
- Today (2025)
- 1,025,572 people
- By 2030
- 1,065,727 · +3.9%
- By 2040
- 1,141,577 · +11.3%
- By 2050
- 1,208,920 · +17.9%
- By 2075
- 1,367,288 · +33.3%
- By 2100
- 1,438,201 · +40.2%
Race, ethnicity, and origin ACS 2023
- Neighborhood character
- Predominantly White (69%)
- Race & ethnicity
- White 69% Black 13% Hispanic / Latino 13% Two or more races 7%
- Hispanic origin (detail)
- Mexican 7%
- Common ancestry
- Italian 2% Iranian 2% Lithuanian 2%
- Foreign-born
- 9% · Canada, China
- Languages at home
- 87% English-only · Spanish 9% Arabic 1%
Political lean MEDSL · Marion
- 2024 margin
- Strong D (+27.7) · D 63.0% · R 35.3% · Other 1.7%
- 2008→2024 swing
- -0.7pp no change · 2008: 28.4pp · 2024: 27.7pp
- All cycles
- 2024: D+27.7 2020: D+29.1 2016: D+22.8 2012: D+22.2 2008: D+28.4
Not yet ingested
- Civics
- —
Market trends
- HPI YoY
- ▼ -97.56%
- Current HPI
- 313.4711
- Rent YoY
- ▲ 1.79%
- Metro
- Indianapolis-Carmel-Anderson, IN
- State GDP YoY
- ▲ 2.90%
- F500 in state
- 18
Industry mix (Fortune 500 HQ in IN)
| Industry | F500 HQs | Revenue |
|---|---|---|
| Industrial Machinery | 2 | $37B |
|
||
| Healthcare | 1 | $177B |
|
||
| Pharmaceuticals | 1 | $45B |
|
||
| Metals / Steel | 1 | $18B |
|
||
| Agriculture | 1 | $17B |
|
||
| Packaging | 1 | $12B |
|
||
Price history
+29.1% since first listed5 events — show timeline
- 2026-05-21 Listed $129,000 MIBOR as Distributed by MLS Grid
- 2025-03-31 Listing Removed — MIBOR as Distributed by MLS Grid
- 2025-02-18 Price Changed $94,900 MIBOR as Distributed by MLS Grid
- 2024-12-27 Price Changed $97,000 MIBOR as Distributed by MLS Grid
- 2024-10-17 Listed $99,900 MIBOR as Distributed by MLS Grid
Property tax history
+17.1%/yrLatest (2025): $2,295 · +70.7% YoY. Source: county tax records.
Cash-flow waterfall
monthlySold comps — $/sqft
last 12 mo · ≤1 miLoading sold comps…