 Duplex
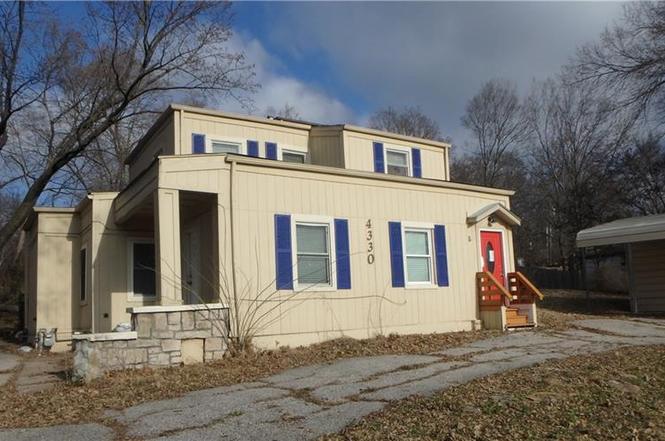
4330 Merriam Dr · Overland Park, KS
Flood risk 1/10 · Minimal
- FEMA flood zone
- X (unshaded)
- Chance of flooding over 30 yrs
- 0.0%
- Est. flood insurance / yr
- $473 – $860
Fire risk 1/10 · Minimal
- Est. fire insurance / yr
- $1,154 – $2,142
Heat risk 4/10 · Minor
- Hot days now (above 107°F)
- 7 days/yr
- Hot days in 30 yrs
- 17 days/yr
Wind risk 2/10 · Minimal
- Chance of severe wind over 30 yrs
- —
Air-quality risk 2/10 · Minimal
- Unhealthy air days now
- 2 days/yr
- Unhealthy air days in 30 yrs
- 2 days/yr
Risk factors via First Street. Map © Google.
Why this score? — see what drove the B grade
The composite is a weighted blend of 9 inputs, each scored 0–100. Each bar is that input's sub-score; the figure is the points it added to the 100-point composite (weight × sub-score).
- Cash flow +30.0/30.0
- 1% rule +10.0/10.0
- DSCR +10.0/10.0
- ARV discount +7.5/15.0
- Livability +4.0/5.0
- Schools +3.8/10.0
- Rent growth +2.5/5.0
- Condition / age +2.5/5.0
- Appreciation +0.0/10.0
$199,900
🖨 Deal sheet 📄 Offer letter ✓ Due diligence
Multi-family units
County records classify this as Multi-Family (5+ Unit). Listing-text estimate: 2 units. estimate disagrees with records
5+ unit building — per-unit beds/baths from public records are typically unavailable; the breakdown below (if shown) is an estimate from the listing text.
Listing remarks
LOCATION , LOCATION , LOCATION. Hard to find . 58 ac close to I-35 and I-635. This is an over under duplex. Vacant and ready for you to live in one side and rent out the other.
Key facts
- Over under duplex
- 0.58 acre lot
- Garage
Tags
Property features AI
Finance
- Other: Zoned RES
- Financial info: Operating expenses include other items (multi-family)
- HOA & community: No association fees
Exterior
- Parking: Carport and off-street parking; Garage available; Total parking for about 15 vehicles
- Utilities: City/public water (verify); Public sewer; Individual heating, cooling and water heaters
- Home design: Residential income property (duplex); Two-story building; Over-under (stacked) unit configuration
- Construction: Brick/mortar construction; Composition roof
- Exterior features: Approximately 0.58-acre lot (public records); Located inside city limits
Interior
- Bedrooms: Units include 2-bedroom and 1-bedroom layouts; Two 2-bedroom units (total unit count includes two 2-bedroom units and one 1-bedroom unit listed under unit types)
- Heating & cooling: Electric heating; Electric cooling
- Interior features: Basement present; Individually metered heating and air systems; Individual water heaters
- Laundry & utility: Individual utilities for each unit
Neighborhood map
What this means for you Summary
Snapshot
- This is a 2 × 2-bed/?-bath units multifamily listed at $200k.
Deal economics
- At list price, monthly cash flow is $1k ($14k/yr) — positive. Per door: $571/mo.
- The deal already cash-flows at list — no discount required.
- Meets the 1% rule at list price ($3k rent vs $200k).
- Recommended offer: $188k (6.0% below list) — sets the bar for market timing.
- Cap rate 13.2% vs local median 3.9% in Overland Park — top-decile yield for the area; either an underpriced asset or a hidden risk that comps aren't pricing in. Stress-test before assuming the spread holds.
Location & tenants
- Location reads 80/100 on livability (#16 in KS, #1,851 nationally) — a professional / high-income tenant draw. Strengths: employment A+, housing A+, crime B; Watch: health & safety C-, commute D+.
- Shawnee Mission Pub Schools (suburban): math 38% / reading 46% proficiency, ranked #22 of 169 in KS (top 13%) — families likely to look elsewhere, expect single-tenant / working-renter base with shorter leases.
- Zoned schools: Merriam Park Elementary (math 29% / reading 39%, grade F, #416 of 684 statewide, top 61%, 431 students, 58% FRL) — zoned schools average 58% FRL vs 29% district-wide (29 pts higher); higher-poverty schools than district average — tighter screening recommended.
- Market conditions: 80 active listings in the ZIP; 3 comparable units currently listed for rent nearby; rentals leasing fast (median 2d on market — plan ~1-2 weeks tenant-placement turnaround); solid renter incomes; 2,969 units permitted in Johnson County in 2024 (1,066 in 5+ unit buildings).
- At $3,160/mo this rent would consume 50% of the median local household income ($76k/yr) (locally 542% of renters already pay >50% of income on rent) — very limited rent-growth headroom before tenants either downsize or default.
Forward outlook
- Local home prices are declining (-3.0%/yr); year-one equity from $1k of loan paydown is wiped out by about $6k of value loss. Plan a longer hold.
- Johnson County population projected at +27% by 2050 — long-run rental-demand tailwind backs the buy-and-hold thesis.
- At projected returns (-3.0% appreciation + 3.0% rent growth), your $56k cash investment doubles in ~5 years — after that, you're playing with house money.
Negotiation context
- It's been on market 79 days — a 6% lower offer ($188k) is reasonable based on typical stale-listing flexibility.
- 8 sale attempts since 12y ago with the ask held roughly flat each time — persistent listings suggest the price (not the market) is what's stuck; bring a comps-based counter.
Risks & watch-outs
- Watch-outs: built in 1910 — expect roof / HVAC / electrical / plumbing capex.
Questions for the listing agent
- It's been on market 79 days. Have you received any prior offers? Is the seller open to a 6% concession, seller financing, or rate buy-down credit?
- Can we see the unit-by-unit rent roll, current vacancy, and any below-market leases? What's the average tenancy length?
- What capital expenditures (roof, boiler, parking lot, exteriors) have been made in the last 5 years, and what's planned in the next 2?
- Built in 1910 — when were the roof, HVAC, electrical panel, plumbing, and water heater last replaced?
- Why hasn't it sold? Are there any deal-killer items the seller is aware of (foundation, flood, title, zoning, code violations)?
- Is there a deadline driving the sale (1031 exchange, divorce, estate, relocation)? That informs how much negotiation room exists.
- Schools are B-rated — typically a magnet for longer-tenancy family renters. What's the average tenant stay here, and is there a school-zone premium baked into asking?
- What's the average days-on-market for RENTAL listings here right now (not sales)? A rising rental-DOM trend means longer vacancies and softer asking-rent achievability than the comps imply.
- What's the recent tenant-quality profile in this submarket — average credit score on applications, eviction rate, late-payment / NSF rate, and stable-employment percentage? A property-management company in the area should have these aggregated.
- How much new apartment / multifamily construction is in the pipeline within 1–3 miles? Heavy new supply (>2% of stock underway) typically softens rents 12–24 months out; light construction supports rent growth.
Investment metrics
- 1% rule
- 1.58% ✓
- Cap rate
- 13.15%
- Cash-on-cash
- 24.50%
- DSCR
- 2.09
- GRM
- 5.3
CMA / ARV
No comps found within radius.
Projected returns pro-forma
-3.0% appreciation · 3.0% rent growth · sell at horizon
- IRR
- 17.9%
- Equity multiple
- 1.72×
- Total profit
- $40,425
- Equity at exit
- $29,806
- IRR
- 26.3%
- Equity multiple
- 3.31×
- Total profit
- $129,050
- Equity at exit
- $17,284
Cash invested: $55,972 (down + closing). Projections, not guarantees.
Landlord ↔ Tenant lean methodology
- Overall (STATE)
- 83 Strongly Landlord-Friendly
- State Kansas
- 83 Strongly Landlord-Friendly · R+10
- County
- — inherits STATE
- City
- — inherits STATE
ZIP-level market 66203
- Active inventory
- 80
- Price-to-rent
- 10.5×
Monthly cashflow live
- Estimated rent
- $3,160 high interval (Pro) →
- Mortgage (P&I)
- −$1,048
- Tax from tax record
- −$222 /mo · $2,664/yr
- Insurance
- −$83
- HOA
- −$0
- Vacancy / Maint / Mgmt
- −$664
- Net cashflow
- $1,143
Break-even live
2-unit breakdown (identical units grouped — click to expand)
| Units | Beds | Baths | Est. rent |
|---|---|---|---|
| 2× units | 2 | — | $3,160 |
| #1 | 2 | — | $1,580 |
| #2 | 2 | — | $1,580 |
| Total (2 units) | $3,160 | ||
UW: 25.0% down · 7.5% · 30yr · 1.5% tax · 5.0% vac · 8.0% maint · 8.0% mgmt
Financing live
Cash to close
- Down payment
- $49,975
- Closing costs
- $5,997
- Reserves months
- —
- Total cash needed
- —
Loan-product check · same deal, 3 products live
Conventional
25% down · 7.5% · 30yr
- Down + closing
- —
- Monthly P&I
- —
- Monthly cashflow
- —
- DSCR
- —
- Eligible?
- —
Personal DTI + credit; lowest rate.
DSCR
20% down · 8.5% · 30yr
- Down + closing
- —
- Monthly P&I
- —
- Monthly cashflow
- —
- DSCR
- —
- Eligible?
- —
No personal income docs; deal must DSCR.
Hard money
10% down · 12.0% · 12mo
- Down + closing
- —
- Monthly P&I
- —
- Monthly cashflow
- —
- DSCR
- —
- Eligible?
- —
Short-term bridge; refi at stabilization.
Rent comps 3 comps
| Address | Beds | Baths | Sqft | Rent | $/sqft | DOM | Units | Dist |
|---|---|---|---|---|---|---|---|---|
| 7205 W 55th Ter Mission, KS | 2.0 | 2.5 | 1300 | $1,730 | $1.33 | 3d | 1 | 1.12mi |
| 6608 W 54th St Mission, KS | 4.0 | 2.0 | 2200 | $3,000 | $1.36 | 1d | 1 | 1.20mi |
| 5402 Knox Ave Shawnee, KS | 3.0 | 2.5 | 1250 | $2,450 | $1.96 | 1d | 1 | 1.26mi |
Listing history 16 events
-
2026-05-05status Active
-
2026-05-04historical
-
2026-04-16status Active
-
2026-03-13status Pending
-
2026-02-04$199,900 Active
-
2024-02-25historical
-
2023-12-02price $355,000
-
2023-11-18$370,000 Active
-
2023-11-07historical
-
2023-11-03$430,000 Active
-
2023-03-09historical
-
2022-10-17$580,000 Active
-
2018-01-15soldstatus Sold
-
2017-12-05historical Contingent - Accepting Backup Offers
-
2017-09-29$1,300,000 Active
-
2014-06-13$149,950
ⓘ Source: listings_history table (triggers on properties + properties_extension) + one-shot
backfill from property_details.listing_events for pre-trigger history.
Tax reassessment forecast KS · Resets to sale price
- Current annual tax
- $2,664 · $222/mo
- Projected year-2 tax
- $2,819 · $235/mo
- Expected delta
- +$155/yr (+$13/mo · 5.8%)
ⓘ Screening estimate from a state-policy table — verify with the county assessor before closing.
Climate risk First Street
- Flood 1/10 Low FEMA zone X (unshaded) · 0% chance over 30 yrs
- Wildfire 1/10 Low
- Heat 4/10 Moderate 7 d/yr ≥107°F today · 17 d/yr by 30 yrs out
- Wind 2/10 Low
- Air quality 2/10 Low 2 unhealthy d/yr today · 2 by 30 yrs out
Nearby sold comps map
Loading sold comps map…
Walkable amenities ~0.75 mi
Loading nearby amenities…
Taxation est. · year 1
- Rental income
- $37,920
- − Mortgage interest
- −$11,198
- − Property taxes
- −$2,664
- − Insurance
- −$1,000
- − Repairs & maintenance
- −$3,034
- − Management
- −$3,034
- − Depreciation
- −$5,815
- Taxable income
- $11,177
- Est. tax owed @ 24.0%
- −$2,682
- After-tax cash flow
- $11,031/yr
For passive investors: Depreciation is non-cash, so a rental often shows a tax loss while cash-flowing — sheltering income. Rental losses are passive: they offset passive income freely, and up to $25,000/yr can offset ordinary (W-2) income if you actively participate and your MAGI is under $100k (phasing out to $0 by $150k); unused losses carry forward. On sale, claimed depreciation is recaptured at up to 25%, and gains may owe capital-gains tax (a 1031 exchange can defer both). Figures are a year-1 estimate at your 24.0% rate — not tax advice; consult a CPA.
Schools (NCES district)
- District
- Shawnee Mission Pub Schools
- NCES district ID
- 2011640
- Math proficiency
- 38% ▼ -6.00%
- Reading proficiency
- 46% ▼ -2.00%
- Median HH income
- $64,923
- Composite
- 37.55/100
- National rank
- #4391
- State rank
- #22 of 169 in KS
Livability — Overland Park
- Score
- 80/100
- State rank
- #16
- US rank
- #1851
Category grades
Schools grade is shown separately in the Schools card above.
Census & demographics
- Census place
- Overland Park, KS
- County
- Johnson County · 574,662 people
- City population
- 180,138
- Metro
- Kansas City, MO-KS
- Population (ZIP)
- 19,441
- Household income
- $75,869
- Rent vs Own
- Severe rent burden
- 542.0
Population outlook (Johnson County) Hauer SSP2
- Today (2025)
- 663,396 people
- By 2030
- 702,585 · +5.9%
- By 2040
- 775,386 · +16.9%
- By 2050
- 841,772 · +26.9%
- By 2075
- 994,137 · +49.9%
- By 2100
- 1,073,036 · +61.7%
Race, ethnicity, and origin ACS 2023
- Neighborhood character
- Predominantly White (72%)
- Race & ethnicity
- White 72% Hispanic / Latino 14% Two or more races 7% Black 5% Asian 4%
- Hispanic origin (detail)
- Mexican 9%
- Common ancestry
- Lithuanian 3% Italian 2% Portuguese 2%
- Foreign-born
- 10% · Canada, South Korea
- Languages at home
- 85% English-only · Spanish 10% Other Asian/Pacific 1% Tagalog/Filipino 1%
Political lean MEDSL · Johnson
- 2024 margin
- Lean D (+8.5) · D 53.4% · R 44.9% · Other 1.8%
- 2008→2024 swing
- +17.5pp toward D · 2008: -9.0pp · 2024: 8.5pp
- All cycles
- 2024: D+8.5 2020: D+8.2 2016: R+2.7 2012: R+17.8 2008: R+9.0
Not yet ingested
- Civics
- —
Market trends
- HPI YoY
- ▼ -262.92%
- Current HPI
- 269.0762
- Rent YoY
- —
- Metro
- Kansas City, MO-KS
- State GDP YoY
- —
- F500 in state
- 0
Price history
+33.3% since first listed16 events — show timeline
- 2026-05-05 Relisted — Heartland MLS as Distributed by MLS Grid
- 2026-05-04 Listing Removed — Heartland MLS as Distributed by MLS Grid
- 2026-04-16 Relisted — Heartland MLS as Distributed by MLS Grid
- 2026-03-13 Pending — Heartland MLS as Distributed by MLS Grid
- 2026-02-04 Listed $199,900 Heartland MLS as Distributed by MLS Grid
- 2024-02-25 Listing Removed — Heartland MLS as Distributed by MLS Grid
- 2023-12-02 Price Changed $355,000 Heartland MLS as Distributed by MLS Grid
- 2023-11-18 Listed $370,000 Heartland MLS as Distributed by MLS Grid
- 2023-11-07 Listing Removed — Heartland MLS as Distributed by MLS Grid
- 2023-11-03 Listed $430,000 Heartland MLS as Distributed by MLS Grid
- 2023-03-09 Listing Removed — Heartland MLS as Distributed by MLS Grid
- 2022-10-17 Listed $580,000 Heartland MLS as Distributed by MLS Grid
- 2018-01-15 Sold (MLS) — Heartland MLS as Distributed by MLS Grid
- 2017-12-05 Contingent — Heartland MLS as Distributed by MLS Grid
- 2017-09-29 Listed $1,300,000 Heartland MLS as Distributed by MLS Grid
- 2014-06-13 Listed $149,950 Heartland MLS as Distributed by MLS Grid
Property tax history
+9.1%/yrLatest (2025): $2,664 · -3.8% YoY. Source: county tax records.
Cash-flow waterfall
monthlySold comps — $/sqft
last 12 mo · ≤1 miLoading sold comps…