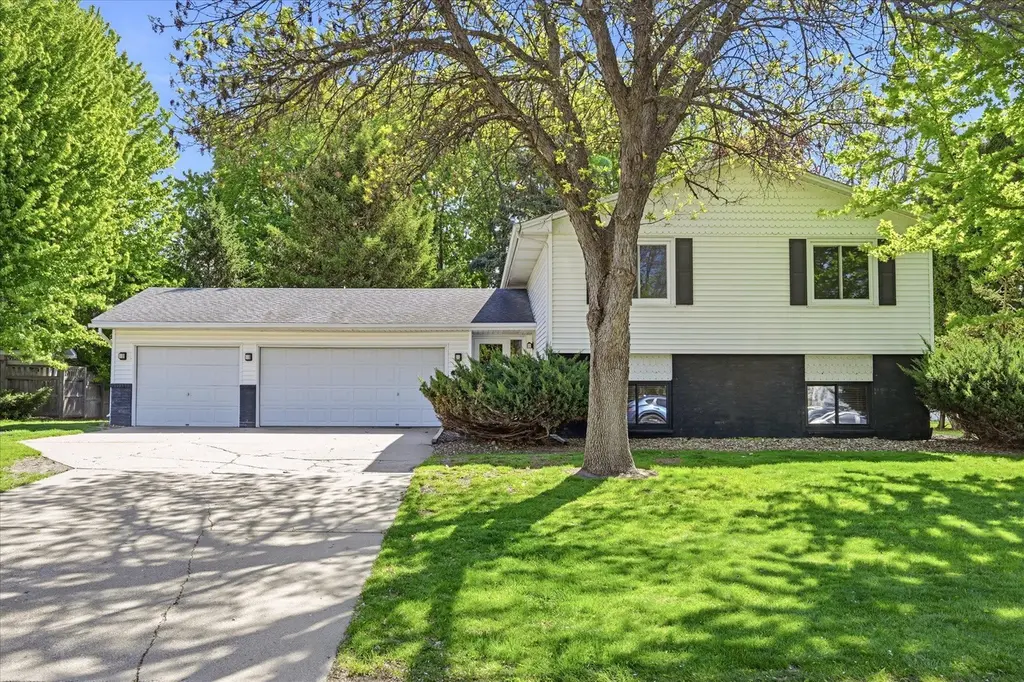
19382 Euclid Path · Farmington, MN
Flood risk 1/10 · Minimal
- FEMA flood zone
- X (unshaded)
- Chance of flooding over 30 yrs
- 0.0%
- Est. flood insurance / yr
- $507 – $1,088
Fire risk 1/10 · Minimal
- Est. fire insurance / yr
- $888 – $1,650
Heat risk 2/10 · Minimal
- Hot days now (above 99°F)
- 7 days/yr
- Hot days in 30 yrs
- 14 days/yr
Wind risk 2/10 · Minimal
- Chance of severe wind over 30 yrs
- —
Air-quality risk 2/10 · Minimal
- Unhealthy air days now
- 1 days/yr
- Unhealthy air days in 30 yrs
- 1 days/yr
Risk factors via First Street. Map © Google.
Why this score? — see what drove the D- grade
The composite is a weighted blend of 9 inputs, each scored 0–100. Each bar is that input's sub-score; the figure is the points it added to the 100-point composite (weight × sub-score).
- ARV discount +15.0/15.0
- Cash flow +6.8/30.0
- Schools +4.4/10.0
- Livability +3.8/5.0
- Rent growth +2.5/5.0
- Condition / age +2.5/5.0
- 1% rule +1.4/10.0
- DSCR +1.1/10.0
- Appreciation +0.0/10.0
$385,000
🖨 Deal sheet (PDF) 📄 Offer letter ✓ Due diligence
Listing remarks
Welcome to 19382 Euclid Path. Originally owned and loved, this home is available for the first time in over 30 years. Tucked into a mature, tree lined neighborhood just steps from Fair Hills Park and close to Akin Road Elementary, this well loved split level home offers over 2,200 square feet of versatile living space, a 3 car garage, and a newer backyard deck that feels like your own private retreat. From the moment you pull up, the canopy of mature trees set a welcoming tone. Out back, the newer deck with a modern wood and steel railing overlooks a spacious, green yard surrounded by towering evergreens and ornamental trees, a genuinely peaceful place to start or end your day. The deck was
Key facts
- 0.34 acre lot
- 3 garage spots
- Built 1991
Property features AI
Exterior
- Parking: Attached garage with 3 parking spaces (garage approx. 28'3" x 20'1")
- Utilities: City water (connected); City sewer (connected); Natural gas; Electric with circuit breakers
- Home design: Residential split-entry (bi-level) home; Above-grade finished and living area provided; Below-grade finished area and basement
- Construction: Block foundation; Roof over 8 years old
- Exterior features: Deck; Medium tree coverage
Interior
- Kitchen: Dishwasher; Microwave; Range; Refrigerator; Stainless steel appliances; Gas water heater
- Bedrooms: 4 bedrooms (bedrooms located on upper and lower levels)
- Bathrooms: 2 full bathrooms (including an ensuite and a main-floor full bath; primary walk-thru configuration)
- Heating & cooling: Forced air heating; Central air conditioning
- Interior features: Primary bedroom suite; Finished basement with egress window(s) and storage space; Gas stone fireplace; Informal dining area
- Laundry & utility: Laundry room on lower level; Washer; Dryer
Neighborhood map
What this means for you Summary
Snapshot
- This is a 3-bed/2.0-bath single-family listed at $385k.
Deal economics
- At list price, monthly cash flow is $-594 ($-7k/yr) — negative.
- To cash-flow at today's rent, offer at most $280k (27.3% below list).
- To meet the 1% rule (rent ≥ 1% of price), the offer needs to be $247k (35.7% below list).
- Recommended offer: $247k (35.7% below list) — sets the bar for 1% rule.
Location & tenants
- Location reads 75/100 on livability (#203 in MN, #4,269 nationally) — a middle-class / working-renter tenant base. Strengths: crime A+, employment A+, housing A+; Watch: amenities F, commute F.
- Farmington Public School District (suburban): math 43% / reading 52% proficiency, ranked #104 of 301 in MN (top 35%) — families likely to look elsewhere, expect single-tenant / working-renter base with shorter leases; only 12% free/reduced lunch — higher-income household profile.
- Zoned schools: Meadowview Elementary (math 60% / reading 58%, grade B-, #247 of 857 statewide, top 29%, 627 students, 31% FRL); Robert Boeckman Middle School (math 41% / reading 51%, grade D+, #103 of 258 statewide, top 40%, 878 students, 25% FRL); Farmington High School (math 32% / reading 56%, grade F, #210 of 471 statewide, top 44%, 2,201 students, 22% FRL).
- Market conditions: 325 active listings in the ZIP; 3 comparable units currently listed for rent nearby; rentals lingering (median 46d on market — plan ~5-8 weeks vacancy on turnover, expect pricing pressure); 67% of comp listings sitting > 30 days — soft ceiling on asking rent; high-income renter base; 2,134 units permitted in Dakota County in 2024 (898 in 5+ unit buildings).
Forward outlook
- Local home prices are declining (-3.0%/yr); year-one equity from $3k of loan paydown is wiped out by about $12k of value loss. Plan a longer hold.
- Dakota County population projected at +11% by 2050 — modest demand growth; plan on rents tracking national, not racing it.
Negotiation context
- Only 4 days on market — expect competitive offers; lowballing is unlikely to land.
- Current owner paid $92k; list at $385k implies a 318% gain — meaningful room to come down on a strong offer.
Questions for the listing agent
- What do current leases actually rent for vs. the listed asking? Can we see a recent rent roll and the last 12 months of T-12 income?
- Is there a deadline driving the sale (1031 exchange, divorce, estate, relocation)? That informs how much negotiation room exists.
- Schools are B-rated — typically a magnet for longer-tenancy family renters. What's the average tenant stay here, and is there a school-zone premium baked into asking?
- The area grade is low — what's the realistic commute time and amenity access for the typical tenant pool here? Any planned neighborhood developments (good or bad) we should know about?
- What's the average days-on-market for RENTAL listings here right now (not sales)? A rising rental-DOM trend means longer vacancies and softer asking-rent achievability than the comps imply.
- What's the recent tenant-quality profile in this submarket — average credit score on applications, eviction rate, late-payment / NSF rate, and stable-employment percentage? A property-management company in the area should have these aggregated.
- How much new for-sale + rental construction is in the pipeline within 1–3 miles? Heavy new supply typically softens prices + rents 12–24 months out; constrained supply supports both.
Investment metrics
- 1% rule
- 0.64% ✗
- Cap rate
- 4.44%
- Cash-on-cash
- -6.62%
- DSCR
- 0.71
- GRM
- 13.0
CMA / ARV
- ARV (median comp)
- $465,555
- List price
- $385,000
- Delta
- -17.30%
- Verdict
- UNDERPRICED
- Comps
- 4 within 1.0 mi
Projected returns pro-forma
-3.0% appreciation · 3.0% rent growth · sell at horizon
- IRR
- -27.8%
- Equity multiple
- 0.07×
- Total profit
- $-100,280
- Equity at exit
- $57,405
- IRR
- -26.3%
- Equity multiple
- -0.26×
- Total profit
- $-136,204
- Equity at exit
- $33,288
Cash invested: $107,800 (down + closing). Projections, not guarantees.
Landlord ↔ Tenant lean methodology
- Overall (STATE)
- 46 Balanced
- State Minnesota
- 46 Balanced · D+2
- County
- — inherits STATE
- City
- — inherits STATE
ZIP-level market 55024
- Home prices YoY
- -31.2%
- Active inventory
- 325
- Price-to-rent
- 13.0×
Monthly cashflow live
- Estimated rent
- $2,474 medium interval (Pro) →
- Mortgage (P&I)
- −$2,019
- Tax from tax record
- −$370 /mo · $4,436/yr
- Insurance
- −$160
- HOA
- −$0
- Vacancy / Maint / Mgmt
- −$520
- Net cashflow
- $-594
Break-even live
Sensitivity live
| Price | -10% $-377 | -5% $-486 | +0% $-594 | +5% $-703 | +10% $-812 |
|---|---|---|---|---|---|
| Rent | -10% $-790 | -5% $-692 | +0% $-594 | +5% $-497 | +10% $-399 |
| Rate | -1.0pp $-401 | -0.5pp $-497 | base $-594 | +0.5pp $-694 | +1.0pp $-796 |
UW: 25.0% down · 7.5% · 30yr · 1.5% tax · 5.0% vac · 8.0% maint · 8.0% mgmt
Financing live
Cash to close
- Down payment
- $96,250
- Closing costs
- $11,550
- Reserves months
- —
- Total cash needed
- —
Loan-product check · same deal, 3 products live
Conventional
25% down · 7.5% · 30yr
- Down + closing
- —
- Monthly P&I
- —
- Monthly cashflow
- —
- DSCR
- —
- Eligible?
- —
Personal DTI + credit; lowest rate.
DSCR
20% down · 8.5% · 30yr
- Down + closing
- —
- Monthly P&I
- —
- Monthly cashflow
- —
- DSCR
- —
- Eligible?
- —
No personal income docs; deal must DSCR.
Hard money
10% down · 12.0% · 12mo
- Down + closing
- —
- Monthly P&I
- —
- Monthly cashflow
- —
- DSCR
- —
- Eligible?
- —
Short-term bridge; refi at stabilization.
Rent comps 3 comps
| Address | Beds | Baths | Sqft | Rent | $/sqft | DOM | Units | Dist |
|---|---|---|---|---|---|---|---|---|
| 19644 Escalade Way #906 Farmington, MN | 2.0 | 2.0 | 1500 | $1,999 | $1.33 | 45d | 1 | 0.31mi |
| 19385 Elkridge Trl Farmington, MN | 4.0 | 2.5 | 2500 | $3,099 | $1.24 | 25d | 1 | 0.58mi |
| 18388 English Ave Farmington, MN | 2.0 | 2.0 | 1544 | $1,999 | $1.29 | 45d | 1 | 1.04mi |
Listing history 3 events
-
2026-05-15$374,999 Active 2819-char remark
-
2026-05-13historical $374,999 2819-char remark
-
1992-05-22soldstatus $92,050
ⓘ Source: listings_history table (triggers on properties + properties_extension) + one-shot
backfill from property_details.listing_events for pre-trigger history.
Tax reassessment forecast MN · Partial reset (capped growth)
- Current annual tax
- $4,436 · $370/mo
- Projected year-2 tax
- $4,436 · $370/mo
- Expected delta
- $0/yr ($0/mo · 0.0%)
ⓘ Screening estimate from a state-policy table — verify with the county assessor before closing.
Climate risk First Street
- Flood 1/10 Low FEMA zone X (unshaded) · 0% chance over 30 yrs
- Wildfire 1/10 Low
- Heat 2/10 Low 7 d/yr ≥99°F today · 14 d/yr by 30 yrs out
- Wind 2/10 Low
- Air quality 2/10 Low 1 unhealthy d/yr today · 1 by 30 yrs out
Nearby sold comps map
Loading sold comps map…
Walkable amenities ~0.75 mi
Loading nearby amenities…
Taxation est. · year 1
- Rental income
- $29,690
- − Mortgage interest
- −$21,566
- − Property taxes
- −$4,436
- − Insurance
- −$1,925
- − Repairs & maintenance
- −$2,375
- − Management
- −$2,375
- − Depreciation
- −$11,200
- Taxable loss
- −$14,187
- Est. tax savings @ 24.0%
- +$3,405
- After-tax cash flow
- $-3,729/yr
For passive investors: Depreciation is non-cash, so a rental often shows a tax loss while cash-flowing — sheltering income. Rental losses are passive: they offset passive income freely, and up to $25,000/yr can offset ordinary (W-2) income if you actively participate and your MAGI is under $100k (phasing out to $0 by $150k); unused losses carry forward. On sale, claimed depreciation is recaptured at up to 25%, and gains may owe capital-gains tax (a 1031 exchange can defer both). Figures are a year-1 estimate at your 24.0% rate — not tax advice; consult a CPA.
Schools (NCES district)
- District
- Farmington Public School District
- NCES district ID
- 2711820
- Math proficiency
- 43% ▼ -12.00%
- Reading proficiency
- 52% ▼ -7.00%
- Median HH income
- $83,959
- Composite
- 43.93/100
- National rank
- #2905
- State rank
- #104 of 301 in MN
Livability — Farmington
- Score
- 75/100
- State rank
- #203
- US rank
- #4269
Category grades
Schools grade is shown separately in the Schools card above.
Census & demographics
- Census place
- Farmington, MN
- County
- Dakota County · 417,704 people
- City population
- 37,287
- Metro
- Minneapolis-St. Paul-Bloomington, MN-WI
- Population (ZIP)
- 37,287
- Household income
- $127,280
- Rent vs Own
- Severe rent burden
- 288.0
Population outlook (Dakota County) Hauer SSP2
- Today (2025)
- 450,671 people
- By 2030
- 465,068 · +3.2%
- By 2040
- 486,770 · +8.0%
- By 2050
- 498,743 · +10.7%
- By 2075
- 533,865 · +18.5%
- By 2100
- 550,133 · +22.1%
Race, ethnicity, and origin ACS 2023
- Neighborhood character
- Predominantly White (84%)
- Race & ethnicity
- White 84% Hispanic / Latino 6% Two or more races 4% Black 4% Asian 3%
- Hispanic origin (detail)
- Mexican 3%
- Common ancestry
- Portuguese 14% Scottish 3% Romanian 3%
- Foreign-born
- 5% · Canada, Vietnam
- Languages at home
- 93% English-only · Spanish 3% Other Asian/Pacific 1% Russian/Polish/Slavic 1%
Political lean MEDSL · Dakota
- 2024 margin
- D (+12.9) · D 55.4% · R 42.5% · Other 2.1%
- 2008→2024 swing
- +7.4pp toward D · 2008: 5.5pp · 2024: 12.9pp
- All cycles
- 2024: D+12.9 2020: D+13.9 2016: D+4.7 2012: D+2.9 2008: D+5.5
Not yet ingested
- Civics
- —
Market trends
- HPI YoY
- ▼ -102.47%
- Current HPI
- 225.6882
- Rent YoY
- —
- Metro
- Minneapolis-St. Paul-Bloomington, MN-WI
- State GDP YoY
- ▲ 2.41%
- F500 in state
- 34
Industry mix (Fortune 500 HQ in MN)
| Industry | F500 HQs | Revenue |
|---|---|---|
| Healthcare | 2 | $407B |
|
||
| Retail | 2 | $150B |
|
||
| Consumer Goods | 2 | $32B |
|
||
| Industrial Machinery | 2 | $6B |
|
||
| Agriculture | 1 | $40B |
|
||
| Healthcare / Medical Devices | 1 | $32B |
|
||
Price history
+318.3% since first listed5 events — show timeline
- 2026-05-19 Pending — NORTHSTARMLS as Distributed by MLS Grid
- 2026-05-19 Price Changed $385,000 NORTHSTARMLS as Distributed by MLS Grid
- 2026-05-15 Listed $374,999 NORTHSTARMLS as Distributed by MLS Grid
- 2026-05-13 Coming Soon $374,999 NORTHSTARMLS as Distributed by MLS Grid
- 1992-05-22 Sold (Public Records) $92,050 Public Records
Property tax history
+3.4%/yrLatest (2025): $4,436 · -0.6% YoY. Source: county tax records.
Cash-flow waterfall
monthlySold comps — $/sqft
last 12 mo · ≤1 miLoading sold comps…