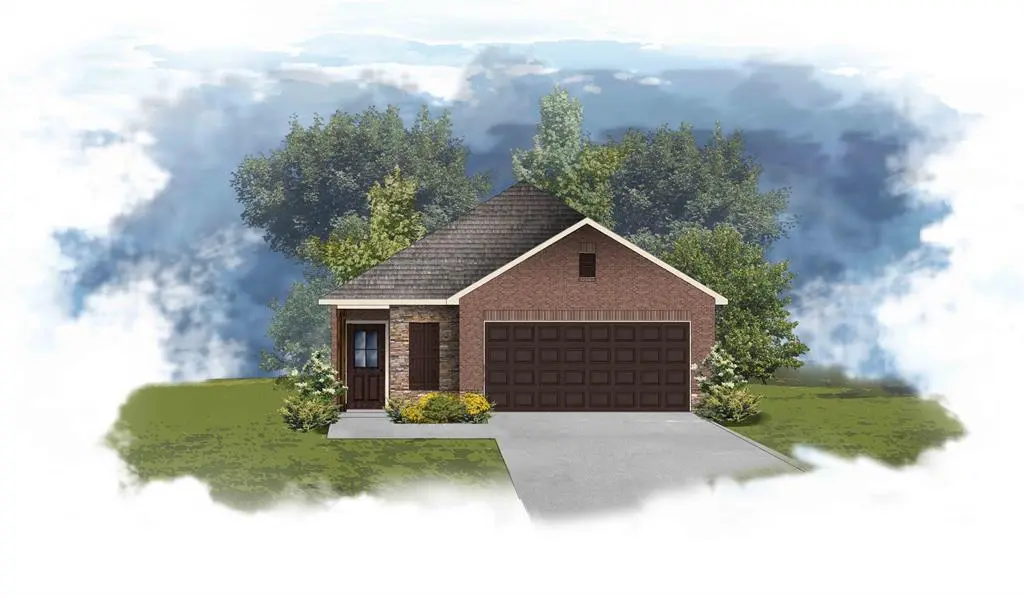
10902 Bonfire Trl · Kendleton, TX
Flood risk No data
- FEMA flood zone
- —
- Chance of flooding over 30 yrs
- —
- Est. flood insurance / yr
- —
Fire risk No data
- Est. fire insurance / yr
- —
Heat risk No data
- Hot days now (above threshold)
- —
- Hot days in 30 yrs
- —
Wind risk No data
- Chance of severe wind over 30 yrs
- —
Air-quality risk No data
- Unhealthy air days now
- —
- Unhealthy air days in 30 yrs
- —
Risk factors via First Street. Map © Google.
Why this score? — see what drove the C grade
The composite is a weighted blend of 9 inputs, each scored 0–100. Each bar is that input's sub-score; the figure is the points it added to the 100-point composite (weight × sub-score).
- ARV discount +15.0/15.0
- Cash flow +11.3/30.0
- Appreciation +7.1/10.0
- 1% rule +6.0/10.0
- Condition / age +5.0/5.0
- Schools +4.6/10.0
- DSCR +3.3/10.0
- Livability +3.1/5.0
- Rent growth +2.5/5.0
$270,000
🖨 Deal sheet 📄 Offer letter ✓ Due diligence
Listing remarks
Beautifully maintained and truly move-in ready, this 4-bedroom, 2-bath single-story home in the growing community of Emberly offers the upgrades, space, and convenience today’s buyers are searching for. Built in 2023, this home features an open-concept design with durable vinyl plank flooring, granite countertops, oversized island, custom backsplash, pendant lighting, LED lighting, matte black fixtures, and energy-efficient stainless steel appliances. The spacious primary suite includes dual sinks and a large walk-in closet, while the covered patio and oversized backyard with sprinkler system create the perfect setting for relaxing or entertaining. Refrigerator included! Why wait on n
Key facts
- Open-concept design
- Custom backsplash
- Pendant lighting
Tags
Neighborhood map
What this means for you Summary
Snapshot
- This is a 4-bed/2.0-bath single-family listed at $270k. Condition is rated excellent.
Deal economics
- At list price, monthly cash flow is $-98 ($-1k/yr) — negative.
- To cash-flow at today's rent, offer at most $253k (6.4% below list).
- Meets the 1% rule at list price ($3k rent vs $270k).
- Recommended offer: $253k (6.4% below list) — sets the bar for cash-flow.
Location & tenants
- Location reads 61/100 on livability (#1,021 in TX) — a middle-class / working-renter tenant base. Strengths: cost of living A+, housing A+; Watch: schools C-, employment D+, crime D.
- Lamar CISD (suburban): math 50% / reading 53% proficiency, ranked #116 of 826 in TX (top 14%) — acceptable for families but not a draw, mixed tenant base, ~2y average lease.
- Market conditions: 232 active listings in the ZIP; 1 comparable units currently listed for rent nearby; 12,093 units permitted in Fort Bend County in 2024 (815 in 5+ unit buildings).
Forward outlook
- In year one you build about $13k of equity ($2k loan paydown + $11k appreciation (4.2% local appreciation)).
- Fort Bend County population projected at +75% by 2050 — long-run rental-demand tailwind backs the buy-and-hold thesis.
- By year 3, paydown + projected appreciation supports a ~$32k cash-out refi (75% LTV) — recoverable capital for the next deal without selling this one.
Negotiation context
- It's been on market 27 days — a 2% lower offer ($266k) is reasonable based on typical stale-listing flexibility.
- 11 sale attempts since 3y ago; this cycle's ask is 11639% above the opening price — seller raised mid-cycle; expect resistance to lowballs.
Risks & watch-outs
- Watch-outs: property tax is 3.5% of price.
Questions for the listing agent
- What do current leases actually rent for vs. the listed asking? Can we see a recent rent roll and the last 12 months of T-12 income?
- Property tax is high relative to price — has the assessment been appealed recently, and will the sale trigger a re-assessment?
- What does the HOA fee cover, when was the last increase, and are there any pending special assessments or reserve-fund shortfalls?
- Is there a deadline driving the sale (1031 exchange, divorce, estate, relocation)? That informs how much negotiation room exists.
- Crime grade is D in this area — have there been break-ins, vandalism, or insurance claims at this property in the last 3 years? What carrier currently insures it and at what premium?
- What's the average days-on-market for RENTAL listings here right now (not sales)? A rising rental-DOM trend means longer vacancies and softer asking-rent achievability than the comps imply.
- What's the recent tenant-quality profile in this submarket — average credit score on applications, eviction rate, late-payment / NSF rate, and stable-employment percentage? A property-management company in the area should have these aggregated.
- How much new for-sale + rental construction is in the pipeline within 1–3 miles? Heavy new supply typically softens prices + rents 12–24 months out; constrained supply supports both.
Investment metrics
- 1% rule
- 1.10% ✓
- Cap rate
- 5.86%
- Cash-on-cash
- -1.56%
- DSCR
- 0.93
- GRM
- 7.6
CMA / ARV
- ARV (median comp)
- $327,129
- List price
- $270,000
- Delta
- -15.94%
- Verdict
- UNDERPRICED
- Comps
- 3 within 2.0 mi
Show comp detail 12 sales within ~0.75 mi
| Address | Dist | Beds/Ba | Sqft | Sold | Price | $/sf | Match |
|---|---|---|---|---|---|---|---|
| 1031 Rosewood Trl | 0.19mi | 4/2.0 | 1,778 (-1%) | 3mo | $299,900 | $169 | 87 |
| 10735 Dogwood Sky Dr | 0.25mi | 4/2.0 | 1,778 (-1%) | 0mo | $289,990 | $163 | 86 |
| 10803 Hickory Ln | 0.31mi | 4/2.0 | 1,778 (-1%) | 2mo | $309,900 | $174 | 83 |
| 719 Mockingbird Psge | 0.17mi | 3/2.0 (-1) | 1,863 (+4%) | 2mo | $335,490 | $180 | 79 |
| 10606 Crimson Trce | 0.45mi | 3/2.0 (-1) | 1,826 (+2%) | 2mo | $265,000 | $145 | 70 |
| 1066 Blue Stone Dr | 0.56mi | 4/2.5 | 1,833 (+2%) | 3mo | $326,990 | $178 | 66 |
| 10710 Sage Bend Dr | 0.29mi | 3/2.0 (-1) | 1,595 (-11%) | 1mo | $274,990 | $172 | 62 |
| 1062 Blue Stone Dr | 0.55mi | 4/2.0 | 1,655 (-8%) | 2mo | $317,990 | $192 | 60 |
| 10414 Rocky Trl | 0.54mi | 4/2.5 | 1,951 (+9%) | 3mo | $290,990 | $149 | 56 |
| 1138 Blue Stone Dr | 0.61mi | 4/2.5 | 1,951 (+9%) | 3mo | $289,990 | $149 | 52 |
| 1031 Blue Stone Dr | 0.55mi | 3/2.0 (-1) | 1,572 (-12%) | 2mo | $307,990 | $196 | 47 |
| 1023 Blue Stone Dr | 0.53mi | 3/2.0 (-1) | 1,572 (-12%) | 3mo | $309,990 | $197 | 47 |
Match score weights: distance 35% · size 25% · config 20% · recency 20%. Top-matched comps best support the ARV.
Projected returns pro-forma
4.15% appreciation · 3.0% rent growth · sell at horizon
- IRR
- 9.4%
- Equity multiple
- 1.58×
- Total profit
- $43,506
- Equity at exit
- $139,319
- IRR
- 11.3%
- Equity multiple
- 2.91×
- Total profit
- $144,448
- Equity at exit
- $229,825
Cash invested: $75,600 (down + closing). Projections, not guarantees.
Landlord ↔ Tenant lean methodology
- Overall (STATE)
- 87 Strongly Landlord-Friendly
- State Texas
- 87 Strongly Landlord-Friendly · R+5
- County
- — inherits STATE
- City
- — inherits STATE
ZIP-level market 77417
- Home prices YoY
- 1.2%
- Active inventory
- 232
- Price-to-rent
- 7.6×
Monthly cashflow live
- Estimated rent
- $2,965 medium interval (Pro) →
- Mortgage (P&I)
- −$1,416
- Tax from tax record
- −$779 /mo · $9,350/yr
- Insurance
- −$112
- HOA
- −$133
- Vacancy / Maint / Mgmt
- −$623
- Net cashflow
- $-98
Break-even live
UW: 25.0% down · 7.5% · 30yr · 1.5% tax · 5.0% vac · 8.0% maint · 8.0% mgmt
Financing live
Cash to close
- Down payment
- $67,500
- Closing costs
- $8,100
- Reserves months
- —
- Total cash needed
- —
Loan-product check · same deal, 3 products live
Conventional
25% down · 7.5% · 30yr
- Down + closing
- —
- Monthly P&I
- —
- Monthly cashflow
- —
- DSCR
- —
- Eligible?
- —
Personal DTI + credit; lowest rate.
DSCR
20% down · 8.5% · 30yr
- Down + closing
- —
- Monthly P&I
- —
- Monthly cashflow
- —
- DSCR
- —
- Eligible?
- —
No personal income docs; deal must DSCR.
Hard money
10% down · 12.0% · 12mo
- Down + closing
- —
- Monthly P&I
- —
- Monthly cashflow
- —
- DSCR
- —
- Eligible?
- —
Short-term bridge; refi at stabilization.
Rent comps 1 comps
| Address | Beds | Baths | Sqft | Rent | $/sqft | DOM | Units | Dist |
|---|---|---|---|---|---|---|---|---|
| 10730 Sky Creek Ln Beasley, TX | 3.0–4.0 | 2.0–2.5 | 1869 | $2,965 | $1.59 | 1d | 1 | 0.42mi |
HOA detail
- Monthly dues
- $133 · $1,596/yr
Listing history 35 events
-
2026-06-18days on market $270,000 Active 27 DOM
-
2026-06-17days on market $270,000 Active 26 DOM
-
2026-06-16days on market $270,000 Active 25 DOM
-
2026-06-15days on market $270,000 Active 24 DOM
-
2026-06-13days on market $270,000 Active 22 DOM
-
2026-06-09days on market $270,000 Active 18 DOM
-
2026-06-08days on market $270,000 Active 17 DOM
-
2026-06-07days on market $270,000 Active 16 DOM
-
2026-06-04days on market $270,000 Active 13 DOM
-
2026-06-03days on market $270,000 Active 12 DOM
-
2026-06-02days on market $270,000 Active 11 DOM
-
2026-06-01days on market $270,000 Active 10 DOM
-
2026-05-31days on market $270,000 Active 9 DOM
-
2026-05-15$2,300
-
2026-05-14historical $2,300
-
2026-05-13historical
-
2026-03-25$2,300
-
2026-03-25historical $2,300
-
2026-03-14$2,300
-
2026-03-14historical $2,300
-
2026-02-10$275,000 Active
-
2026-01-15historical
-
2026-01-01$2,300
-
2026-01-01historical $2,300
-
2025-12-21historical $2,300
-
2025-12-18$2,300
-
2025-11-27$2,300
-
2025-11-27historical $2,300
-
2025-11-14$2,300
-
2025-11-13$270,000 Active
-
2024-10-31soldstatus Sold
-
2024-09-07status Pending
-
2024-09-05status Active
-
2024-04-23status Pending
-
2023-09-29$308,455 Active
ⓘ Source: listings_history table (triggers on properties + properties_extension) + one-shot
backfill from property_details.listing_events for pre-trigger history.
Tax reassessment forecast TX · Resets to sale price
- Current annual tax
- $9,350 · $779/mo
- Projected year-2 tax
- $9,350 · $779/mo
- Expected delta
- $0/yr ($0/mo · 0.0%)
ⓘ Screening estimate from a state-policy table — verify with the county assessor before closing.
Nearby sold comps map
Loading sold comps map…
Walkable amenities ~0.75 mi
Loading nearby amenities…
Taxation est. · year 1
- Rental income
- $35,580
- − Mortgage interest
- −$15,124
- − Property taxes
- −$9,350
- − Insurance
- −$1,350
- − Repairs & maintenance
- −$2,846
- − Management
- −$2,846
- − HOA
- −$1,596
- − Depreciation
- −$7,855
- Taxable loss
- −$5,388
- Est. tax savings @ 24.0%
- +$1,293
- After-tax cash flow
- $114/yr
For passive investors: Depreciation is non-cash, so a rental often shows a tax loss while cash-flowing — sheltering income. Rental losses are passive: they offset passive income freely, and up to $25,000/yr can offset ordinary (W-2) income if you actively participate and your MAGI is under $100k (phasing out to $0 by $150k); unused losses carry forward. On sale, claimed depreciation is recaptured at up to 25%, and gains may owe capital-gains tax (a 1031 exchange can defer both). Figures are a year-1 estimate at your 24.0% rate — not tax advice; consult a CPA.
Condition & rehab AI · 12 photos
This move-in ready, single-story home in Emberly offers a beautiful, well-maintained interior and exterior, with no visible repairs or maintenance needed.
Value-add opportunities
- Both Landscaping — Enhances curb appeal and adds value
- Both Interior paint touch-ups — Maintains a fresh look
- Both Add smart home features — Improves convenience and marketability
Renovation cost estimate screening
Value-add ROI direction
- Both Landscaping — Enhances curb appeal and adds value ↑
- Both Interior paint touch-ups — Maintains a fresh look ↑
- Both Add smart home features — Improves convenience and marketability ↑
ⓘ Cost ranges are severity-bucket heuristics (US national rule-of-thumb). Get contractor quotes + a written scope before underwriting a rehab budget.
Schools (NCES district)
- District
- Lamar CISD
- NCES district ID
- 4826580
- Math proficiency
- 50% ▼ -12.00%
- Reading proficiency
- 53% ▼ -4.00%
- Median HH income
- $75,213
- Composite
- 46.43/100
- National rank
- #2452
- State rank
- #116 of 826 in TX
Livability — Kendleton
- Score
- 61/100
- State rank
- #1021
- US rank
- #18149
Category grades
Schools grade is shown separately in the Schools card above.
Census & demographics
- Population (ZIP)
- 3,232
Population outlook (Fort Bend County) Hauer SSP2
- Today (2025)
- 1,004,526 people
- By 2030
- 1,153,104 · +14.8%
- By 2040
- 1,453,718 · +44.7%
- By 2050
- 1,753,781 · +74.6%
- By 2075
- 2,455,772 · +144.5%
- By 2100
- 2,930,528 · +191.7%
Race, ethnicity, and origin ACS 2023
- Neighborhood character
- Predominantly Hispanic (67%)
- Race & ethnicity
- Hispanic / Latino 67% Two or more races 49% White 22% Black 8%
- Hispanic origin (detail)
- Mexican 54%
- Common ancestry
- Italian 2% Romanian 1%
- Foreign-born
- 3% · Canada
- Languages at home
- 76% English-only · Spanish 24%
Political lean MEDSL · Fort Bend
- 2024 margin
- Toss-up / Even · D 49.5% · R 47.9% · Other 2.6%
- 2008→2024 swing
- +4.0pp toward D · 2008: -2.4pp · 2024: 1.6pp
- All cycles
- 2024: D+1.6 2020: D+10.6 2016: D+6.6 2012: R+6.8 2008: R+2.4
Not yet ingested
- Civics
- —
Market trends
- HPI YoY
- ▲ 4.15%
- Current HPI
- 337.8236
- Rent YoY
- —
- Metro
- —
- State GDP YoY
- ▲ 3.95%
- F500 in state
- 110
Industry mix (Fortune 500 HQ in TX)
| Industry | F500 HQs | Revenue |
|---|---|---|
| Energy | 16 | $1,198B |
|
||
| Technology | 5 | $198B |
|
||
| Engineering / Construction | 4 | $72B |
|
||
| Energy Services | 3 | $60B |
|
||
| Utilities | 3 | $41B |
|
||
| Healthcare | 2 | $330B |
|
||
Price history
-99.3% since first listed22 events — show timeline
- 2026-05-15 Listed for Rent $2,300 SHOWMOJO
- 2026-05-14 Rental Removed $2,300 HARMLS
- 2026-05-13 Listing Removed — HARMLS
- 2026-03-25 Listed for Rent $2,300 HARMLS
- 2026-03-25 Rental Removed $2,300 SHOWMOJO
- 2026-03-14 Listed for Rent $2,300 SHOWMOJO
- 2026-03-14 Rental Removed $2,300 HARMLS
- 2026-02-10 Listed $275,000 HARMLS
- 2026-01-15 Listing Removed — HARMLS
- 2026-01-01 Listed for Rent $2,300 HARMLS
- 2026-01-01 Rental Removed $2,300 SHOWMOJO
- 2025-12-21 Rental Removed $2,300 HARMLS
- 2025-12-18 Listed for Rent $2,300 HARMLS
- 2025-11-27 Listed for Rent $2,300 SHOWMOJO
- 2025-11-27 Rental Removed $2,300 HARMLS
- 2025-11-14 Listed for Rent $2,300 HARMLS
- 2025-11-13 Listed $270,000 HARMLS
- 2024-10-31 Sold (MLS) — HARMLS
- 2024-09-07 Pending — HARMLS
- 2024-09-05 Relisted — HARMLS
- 2024-04-23 Pending — HARMLS
- 2023-09-29 Listed $308,455 HARMLS
Cash-flow waterfall
monthlySold comps — $/sqft
last 12 mo · ≤1 miLoading sold comps…