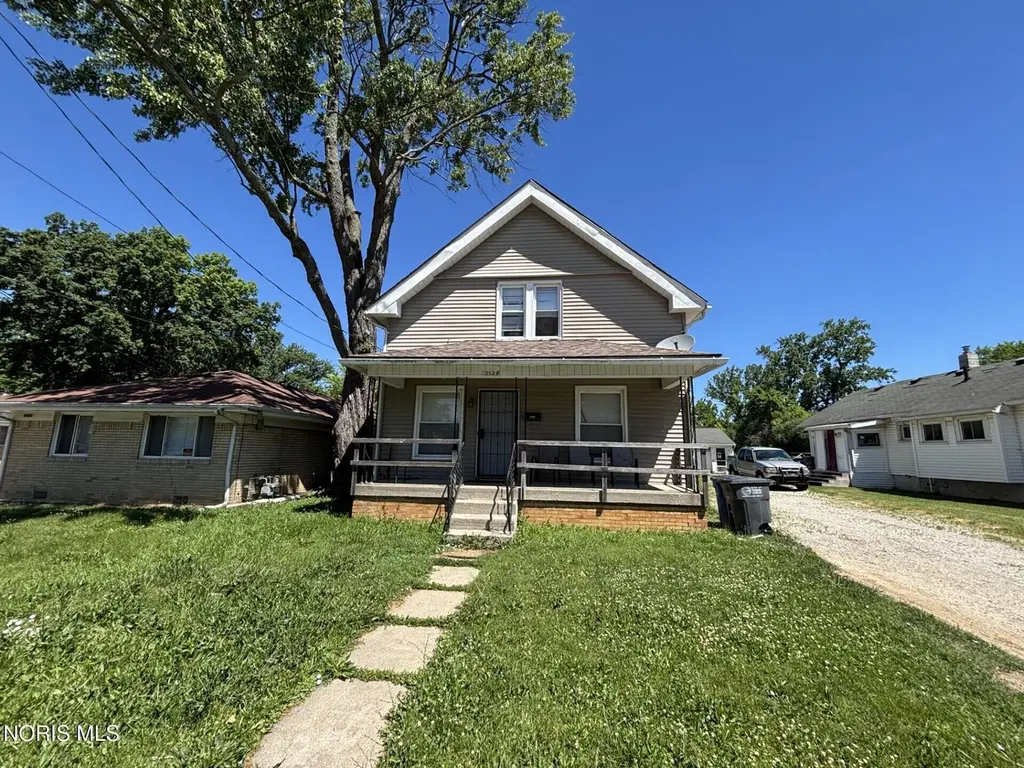
2329 Seaman St · Toledo, OH
Flood risk 1/10 · Minimal
- FEMA flood zone
- X (unshaded)
- Chance of flooding over 30 yrs
- 0.0%
- Est. flood insurance / yr
- $507 – $1,088
Fire risk 1/10 · Minimal
- Est. fire insurance / yr
- $713 – $1,323
Heat risk 3/10 · Minor
- Hot days now (above 100°F)
- 7 days/yr
- Hot days in 30 yrs
- 16 days/yr
Wind risk 2/10 · Minimal
- Chance of severe wind over 30 yrs
- —
Air-quality risk 2/10 · Minimal
- Unhealthy air days now
- 1 days/yr
- Unhealthy air days in 30 yrs
- 3 days/yr
Risk factors via First Street. Map © Google.
Why this score? — see what drove the B+ grade
The composite is a weighted blend of 9 inputs, each scored 0–100. Each bar is that input's sub-score; the figure is the points it added to the 100-point composite (weight × sub-score).
- Cash flow +30.0/30.0
- ARV discount +15.0/15.0
- DSCR +10.0/10.0
- 1% rule +9.4/10.0
- Rent growth +3.8/5.0
- Livability +3.3/5.0
- Condition / age +2.5/5.0
- Schools +1.6/10.0
- Appreciation +0.0/10.0
$80,000
🖨 Deal sheet 📄 Offer letter ✓ Due diligence
Listing remarks MLS
Lot of updates for the price. Siding 2017, Roof 2016, Updated electrical and plumbing, Hot water heater 2014, Updated windows, All appliances stay, Washer and dryer stay
Key facts
- 5,798 sq ft lot
- Built 1920
- Listed 6 days
Property features AI
Exterior
- Parking: Other parking
- Security: Carbon monoxide detector(s); Smoke detector(s)
- Utilities: Cable connected; Electricity connected (100 Amp service); Natural gas connected; Public water; Public sewer
- Home design: Single-family house; Two levels (2 stories); Not attached; no common walls
- Construction: Vinyl siding; Block foundation
- Exterior features: Landscaped, level lot; City street frontage; Asphalt road surface; Asphalt roof
Interior
- Kitchen: Gas Range; Refrigerator
- Bedrooms: Bedroom 2 (Upper) — approximately 12 x 8; Bedroom 3 (Upper) — approximately 12 x 9; Bedroom 4 (Upper) — approximately 14 x 10
- Flooring: Vinyl flooring
- Bathrooms: 1 full bathroom
- Heating & cooling: Natural gas heating; Cooling present (type: Other)
- Interior features: 6 total rooms; Other interior features; Has basement
- Laundry & utility: Laundry located in basement
Neighborhood map
What this means for you Summary
Snapshot
- This is a 3-bed/1.0-bath single-family listed at $80k.
Deal economics
- At list price, monthly cash flow is $341 ($4k/yr) — positive.
- The deal already cash-flows at list — no discount required.
- Meets the 1% rule at list price ($1k rent vs $80k).
- Cap rate 11.4% vs local median 7.6% in Toledo — top-decile yield for the area; either an underpriced asset or a hidden risk that comps aren't pricing in. Stress-test before assuming the spread holds.
Location & tenants
- Location reads 66/100 on livability (#645 in OH) — a middle-class / working-renter tenant base. Strengths: cost of living A+, housing A+, health & safety A+; Watch: amenities C-, crime F, commute F.
- Toledo City (urban): math 15% / reading 24% proficiency, ranked #634 of 656 in OH (top 97%) — low school quality limits family demand, transient renter base, plan for 1-2y turnover; 72% free/reduced lunch — lower-income household profile, screen leases tightly.
- Zoned schools: Navarre Elementary School (math 12% / reading 14%, grade F, #1,429 of 1,584 statewide, top 90%, 428 students, 0% FRL); Waite High School (math 12% / reading 24%, grade F, #687 of 781 statewide, top 88%, 997 students, 0% FRL) — zoned schools average 0% FRL vs 72% district-wide (72 pts lower); this property's tenant base skews higher-income than the district average.
- Market conditions: Rents rising fast (+5.4%/yr); 117 active listings in the ZIP; 22 comparable units currently listed for rent nearby; rentals at typical pace (median 23d on market — plan ~3-4 weeks tenant-placement turnaround); lower-income renter base — watch delinquency; 415 units permitted in Lucas County in 2024 (122 in 5+ unit buildings).
- This rent runs 35% of the median local income ($39k/yr) — at the standard rent-burdened threshold; future hikes will face affordability resistance.
Forward outlook
- Local home prices are declining (-3.0%/yr); year-one equity from $553 of loan paydown is wiped out by about $2k of value loss. Plan a longer hold.
- Lucas County population projected at -16% by 2050 — secular population decline; favor cash flow + early exit over multi-decade hold.
- At projected returns (-3.0% appreciation + 5.4% rent growth), your $22k cash investment doubles in ~6 years — after that, you're playing with house money.
Negotiation context
- Only 6 days on market — expect competitive offers; lowballing is unlikely to land.
- 9 sale attempts since 26y ago with the ask held roughly flat each time — persistent listings suggest the price (not the market) is what's stuck; bring a comps-based counter.
Risks & watch-outs
- Watch-outs: built in 1920 — expect roof / HVAC / electrical / plumbing capex.
Questions for the listing agent
- Built in 1920 — when were the roof, HVAC, electrical panel, plumbing, and water heater last replaced?
- Is there a deadline driving the sale (1031 exchange, divorce, estate, relocation)? That informs how much negotiation room exists.
- Schools are D-rated, which usually means shorter tenancies and higher turnover. Who's the typical renter profile here, and what's been the actual vacancy rate?
- Crime grade is F in this area — have there been break-ins, vandalism, or insurance claims at this property in the last 3 years? What carrier currently insures it and at what premium?
- What's the average days-on-market for RENTAL listings here right now (not sales)? A rising rental-DOM trend means longer vacancies and softer asking-rent achievability than the comps imply.
- What's the recent tenant-quality profile in this submarket — average credit score on applications, eviction rate, late-payment / NSF rate, and stable-employment percentage? A property-management company in the area should have these aggregated.
- How much new for-sale + rental construction is in the pipeline within 1–3 miles? Heavy new supply typically softens prices + rents 12–24 months out; constrained supply supports both.
Investment metrics
- 1% rule
- 1.44% ✓
- Cap rate
- 11.41%
- Cash-on-cash
- 18.27%
- DSCR
- 1.81
- GRM
- 5.8
CMA / ARV
- ARV (on-the-fly)
- $132,600
- Comps found
- 12
Show comp detail 12 sales within ~0.75 mi
| Address | Dist | Beds/Ba | Sqft | Sold | Price | $/sf | Match |
|---|---|---|---|---|---|---|---|
| 130 Burger St | 0.31mi | 2/2.0 (-1) | 1,242 (-3%) | 3mo | $134,000 | $108 | 69 |
| 142 Van Buren Ave | 0.22mi | 3/1.0 | 1,444 (+13%) | 2mo | $72,000 | $50 | 66 |
| 146 Esther St | 0.69mi | 3/1.0 | 1,255 (-2%) | 1mo | $71,500 | $57 | 64 |
| 2137 Valentine St | 0.72mi | 3/1.0 | 1,272 (-0%) | 6mo | $47,500 | $37 | 62 |
| 2017 Kelsey Ave | 0.57mi | 3/1.0 | 1,152 (-10%) | 1mo | $119,900 | $104 | 56 |
| 1839 Genesee St | 0.65mi | 3/1.0 | 1,351 (+6%) | 5mo | $32,000 | $24 | 55 |
| 25 Taylor Rd | 0.73mi | 3/2.0 | 1,306 (+2%) | 4mo | $260,000 | $199 | 55 |
| 310 Whittemore St | 0.69mi | 3/3.0 | 1,296 (+2%) | 4mo | $79,800 | $62 | 53 |
| 2023 Woodford St | 0.54mi | 2/1.0 (-1) | 1,152 (-10%) | 3mo | $26,000 | $23 | 51 |
| 220 Sequoia Dr | 0.74mi | 3/2.0 | 1,204 (-6%) | 2mo | $160,000 | $133 | 51 |
| 256 Midvale Ave | 0.74mi | 3/1.0 | 1,180 (-8%) | 4mo | $137,300 | $116 | 50 |
| 2849 Worth St | 0.66mi | 3/2.0 | 1,416 (+11%) | 6mo | $255,000 | $180 | 42 |
Match score weights: distance 35% · size 25% · config 20% · recency 20%. Top-matched comps best support the ARV.
Projected returns pro-forma
-3.0% appreciation · 5.37% rent growth · sell at horizon
- IRR
- 12.6%
- Equity multiple
- 1.52×
- Total profit
- $11,603
- Equity at exit
- $11,928
- IRR
- 23.4%
- Equity multiple
- 3.25×
- Total profit
- $50,309
- Equity at exit
- $6,917
Cash invested: $22,400 (down + closing). Projections, not guarantees.
Landlord ↔ Tenant lean methodology
- Overall (STATE)
- 73 Landlord-Friendly
- State Ohio
- 73 Landlord-Friendly · R+6
- County
- — inherits STATE
- City
- — inherits STATE
ZIP-level market 43605
- Home prices YoY
- -25.6%
- Rents YoY
- 5.4%
- Active inventory
- 117
- Price-to-rent
- 5.8×
Monthly cashflow live
- Estimated rent
- $1,152 high interval (Pro) →
- Mortgage (P&I)
- −$420
- Tax from tax record
- −$116 /mo · $1,397/yr
- Insurance
- −$33
- HOA
- −$0
- Vacancy / Maint / Mgmt
- −$242
- Net cashflow
- $341
Break-even live
UW: 25.0% down · 7.5% · 30yr · 1.5% tax · 5.0% vac · 8.0% maint · 8.0% mgmt
Financing live
Cash to close
- Down payment
- $20,000
- Closing costs
- $2,400
- Reserves months
- —
- Total cash needed
- —
Loan-product check · same deal, 3 products live
Conventional
25% down · 7.5% · 30yr
- Down + closing
- —
- Monthly P&I
- —
- Monthly cashflow
- —
- DSCR
- —
- Eligible?
- —
Personal DTI + credit; lowest rate.
DSCR
20% down · 8.5% · 30yr
- Down + closing
- —
- Monthly P&I
- —
- Monthly cashflow
- —
- DSCR
- —
- Eligible?
- —
No personal income docs; deal must DSCR.
Hard money
10% down · 12.0% · 12mo
- Down + closing
- —
- Monthly P&I
- —
- Monthly cashflow
- —
- DSCR
- —
- Eligible?
- —
Short-term bridge; refi at stabilization.
Rent comps 22 comps
| Address | Beds | Baths | Sqft | Rent | $/sqft | DOM | Units | Dist |
|---|---|---|---|---|---|---|---|---|
| 2074 Starr Ave Toledo, OH | 3.0 | 1.0 | 1115 | $1,025 | $0.92 | 23d | 1 | 0.63mi |
| 1848 Genesee St Toledo, OH | 3.0 | 1.0 | 1069 | $1,200 | $1.12 | 43d | 1 | 0.66mi |
| 1848 Genesee St Toledo, OH | 3.0 | 1.0 | 1069 | $1,300 | $1.22 | 23d | 1 | 0.66mi |
| 1964 Burr St Toledo, OH | 3.0 | 1.0 | 1159 | $1,250 | $1.08 | 43d | 1 | 0.73mi |
| 2129 Nevada St Toledo, OH | 3.0 | 1.0 | 1352 | $1,200 | $0.89 | 13d | 1 | 0.81mi |
| 223 Valleywood Dr Toledo, OH | 2.0 | 1.0 | 1098 | $1,099 | $1.00 | 23d | 1 | 0.84mi |
| 622 Whitlock Ave Toledo, OH | 3.0 | 1.0 | 925 | $1,195 | $1.29 | 43d | 1 | 0.88mi |
| 722 Coyne Ave Toledo, OH | 2.0 | 1.0 | 900 | $1,000 | $1.11 | 13d | 1 | 0.94mi |
| 732 Coyne Ave Toledo, OH | 3.0 | 1.0 | 968 | $1,145 | $1.18 | 13d | 1 | 0.96mi |
| 2453 Caledonia St Toledo, OH | 2.0 | 1.0 | 1179 | $810 | $0.69 | 13d | 1 | 0.99mi |
| 221 Licking St Unit 2 Toledo, OH | 3.0 | 1.0 | 1048 | $1,099 | $1.05 | 23d | 1 | 1.01mi |
| 245 Plymouth St Toledo, OH | 3.0 | 1.0 | 1600 | $1,125 | $0.70 | 13d | 1 | 1.03mi |
| 128 Carbon St Toledo, OH | 3.0 | 1.0 | 1113 | $1,200 | $1.08 | 23d | 1 | 1.05mi |
| 1614 Nevada St Toledo, OH | 2.0 | 1.0 | 1172 | $1,000 | $0.85 | 21d | 1 | 1.09mi |
| 1306 Mott Ave Toledo, OH | 3.0 | 1.5 | 1282 | $1,149 | $0.90 | 43d | 1 | 1.11mi |
| 1305 Mott Ave Toledo, OH | 3.0 | 1.0 | 1080 | $1,000 | $0.93 | 43d | 1 | 1.12mi |
| 3148 Corduroy Rd Oregon, OH | 1.0–2.0 | 1.0–1.5 | 800 | $870 | $1.09 | 13d | 1 | 1.14mi |
| 653 Oswald St Toledo, OH | 2.0 | 1.0 | 920 | $800 | $0.87 | 43d | 1 | 1.27mi |
| 1505 Navarre Ave Toledo, OH | 3.0 | 1.0 | 1331 | $1,145 | $0.86 | 43d | 1 | 1.31mi |
| 420 Platt St Toledo, OH | 2.0 | 1.0 | 1499 | $685 | $0.46 | 21d | 1 | 1.42mi |
| 414 Platt St Unit ST-3 Toledo, OH | 3.0 | 1.0 | 1500 | $1,150 | $0.77 | 23d | 1 | 1.42mi |
| 948 White St Toledo, OH | 3.0 | 1.0 | 1024 | $1,135 | $1.11 | 13d | 1 | 1.45mi |
Listing history 6 events
-
2026-06-18days on market $80,000 Active 6 DOM
-
2026-06-17days on market $80,000 Active 5 DOM
-
2026-06-16days on market $80,000 Active 4 DOM
-
2026-06-15days on market $80,000 Active 3 DOM
-
2026-06-14remarks 304-char remark
-
2026-06-14$80,000 Active 1 DOM
ⓘ Source: listings_history table (triggers on properties + properties_extension) + one-shot
backfill from property_details.listing_events for pre-trigger history.
Tax reassessment forecast OH · Partial reset (capped growth)
- Current annual tax
- $1,397 · $116/mo
- Projected year-2 tax
- $1,397 · $116/mo
- Expected delta
- $0/yr ($0/mo · 0.0%)
ⓘ Screening estimate from a state-policy table — verify with the county assessor before closing.
Climate risk First Street
- Flood 1/10 Low FEMA zone X (unshaded) · 0% chance over 30 yrs
- Wildfire 1/10 Low
- Heat 3/10 Moderate 7 d/yr ≥100°F today · 16 d/yr by 30 yrs out
- Wind 2/10 Low
- Air quality 2/10 Low 1 unhealthy d/yr today · 3 by 30 yrs out
Nearby sold comps map
Loading sold comps map…
Walkable amenities ~0.75 mi
Loading nearby amenities…
Taxation est. · year 1
- Rental income
- $13,829
- − Mortgage interest
- −$4,481
- − Property taxes
- −$1,397
- − Insurance
- −$400
- − Repairs & maintenance
- −$1,106
- − Management
- −$1,106
- − Depreciation
- −$2,327
- Taxable income
- $3,011
- Est. tax owed @ 24.0%
- −$723
- After-tax cash flow
- $3,371/yr
For passive investors: Depreciation is non-cash, so a rental often shows a tax loss while cash-flowing — sheltering income. Rental losses are passive: they offset passive income freely, and up to $25,000/yr can offset ordinary (W-2) income if you actively participate and your MAGI is under $100k (phasing out to $0 by $150k); unused losses carry forward. On sale, claimed depreciation is recaptured at up to 25%, and gains may owe capital-gains tax (a 1031 exchange can defer both). Figures are a year-1 estimate at your 24.0% rate — not tax advice; consult a CPA.
Schools (NCES district)
- District
- Toledo City
- NCES district ID
- 3904490
- Math proficiency
- 15% ▼ -16.00%
- Reading proficiency
- 24% ▼ -13.00%
- Median HH income
- $32,137
- Composite
- 15.76/100
- National rank
- #9276
- State rank
- #634 of 656 in OH
Livability — Toledo
- Score
- 66/100
- State rank
- #645
- US rank
- #11442
Category grades
Schools grade is shown separately in the Schools card above.
Census & demographics
- Census place
- Toledo, OH
- County
- Lucas County · 380,724 people
- City population
- 280,811
- Metro
- Toledo, OH
- Population (ZIP)
- 24,441
- Household income
- $39,118
- Rent vs Own
- Severe rent burden
- 1257.0
Population outlook (Lucas County) Hauer SSP2
- Today (2025)
- 420,751 people
- By 2030
- 410,187 · -2.5%
- By 2040
- 384,019 · -8.7%
- By 2050
- 355,125 · -15.6%
- By 2075
- 291,683 · -30.7%
- By 2100
- 233,670 · -44.5%
Race, ethnicity, and origin ACS 2023
- Neighborhood character
- Diverse neighborhood (Simpson 0.61)
- Race & ethnicity
- White 57% Hispanic / Latino 21% Black 14% Two or more races 14%
- Hispanic origin (detail)
- Mexican 17% Puerto Rican 2%
- Common ancestry
- Romanian 3% Lithuanian 2% Portuguese 1%
- Foreign-born
- 3% · Canada
- Languages at home
- 91% English-only · Spanish 7% Arabic 1%
Political lean MEDSL · Lucas
- 2024 margin
- D (+12.6) · D 55.8% · R 43.2%
- 2008→2024 swing
- -18.9pp toward R · 2008: 31.4pp · 2024: 12.6pp
- All cycles
- 2024: D+12.6 2020: D+16.8 2016: D+17.4 2012: D+30.4 2008: D+31.4
Not yet ingested
- Civics
- —
Market trends
- HPI YoY
- ▼ -47.85%
- Current HPI
- 138.6894
- Rent YoY
- ▲ 5.37%
- Metro
- Toledo, OH
- State GDP YoY
- ▲ 1.98%
- F500 in state
- 48
Industry mix (Fortune 500 HQ in OH)
| Industry | F500 HQs | Revenue |
|---|---|---|
| Insurance | 3 | $145B |
|
||
| Industrial Machinery | 3 | $49B |
|
||
| Financial Services | 3 | $24B |
|
||
| Consumer Goods | 2 | $93B |
|
||
| Aerospace / Defense | 2 | $47B |
|
||
| Utilities | 2 | $33B |
|
||
Price history
+220.0% since first listed28 events — show timeline
- 2026-06-12 Listed $80,000 NORIS
- 2026-04-03 Listing Removed — NORIS
- 2026-03-10 Relisted — NORIS
- 2026-02-13 Contingent — NORIS
- 2025-11-13 Price Changed $89,900 NORIS
- 2025-10-14 Price Changed $25,000 NORIS
- 2025-10-14 Price Changed $6,000 NORIS
- 2025-10-09 Price Changed $27,500 NORIS
- 2025-10-03 Listed $94,900 NORIS
- 2025-09-26 Coming Soon — NORIS
- 2024-07-26 Sold (MLS) $77,000 NORIS
- 2024-07-19 Pending — NORIS
- 2024-07-19 Price Changed $77,000 NORIS
- 2024-06-15 Contingent — NORIS
- 2024-06-13 Listed $72,500 NORIS
- 2019-07-09 Sold (MLS) $25,000 NORIS
- 2019-05-02 Listed $34,900 NORIS
- 2019-04-26 Listing Removed — NORIS
- 2019-03-14 Listed $39,900 NORIS
- 2014-03-19 Sold (MLS) $6,000 NORIS
- 2014-03-13 Price Changed $7,500 NORIS
- 2014-01-08 Listed $7,500 NORIS
- 2013-12-03 Listing Removed — NORIS
- 2013-08-27 Listed $9,999 NORIS
- 2000-12-04 Sold (Public Records) $27,500 Public Records
- 2000-11-30 Sold (MLS) $27,500 NORIS
- 2000-10-20 Listed $32,500 NORIS
- 1998-07-06 Sold (Public Records) $25,000 Public Records
Property tax history
+2.7%/yrLatest (2025): $1,397 · +0.7% YoY. Source: county tax records.
Cash-flow waterfall
monthlySold comps — $/sqft
last 12 mo · ≤1 miLoading sold comps…