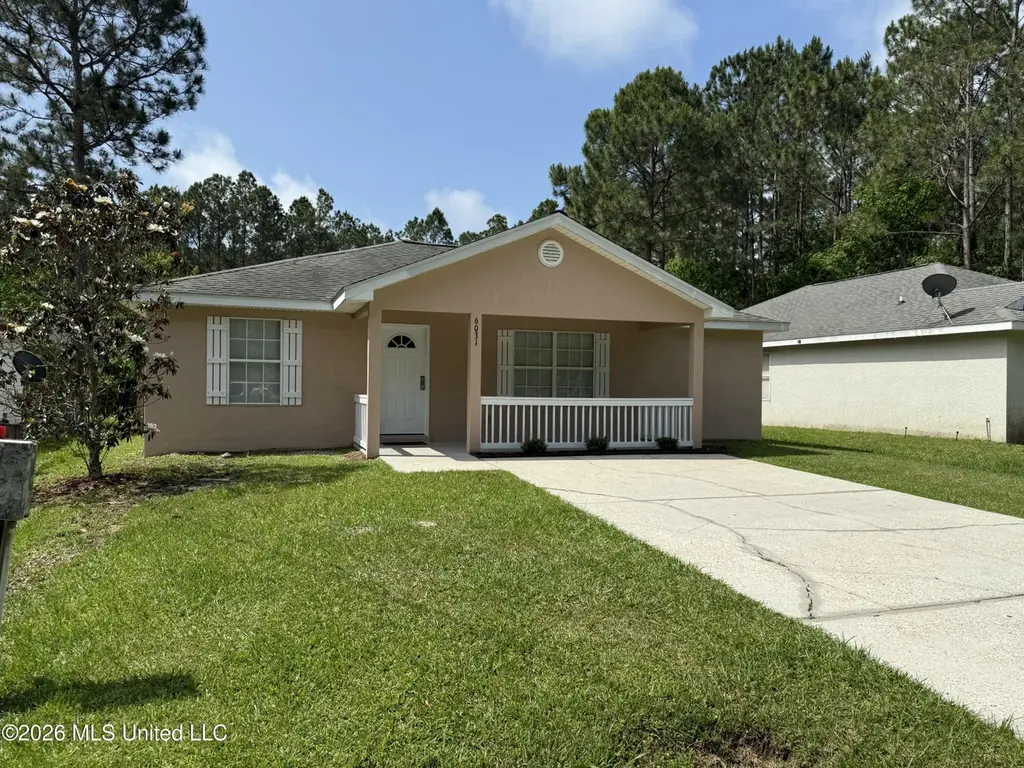
6031 E Newton St · Waveland, MS
Flood risk 4/10 · Minor
- FEMA flood zone
- AE
- Chance of flooding over 30 yrs
- 0.23%
- Est. flood insurance / yr
- $1,737 – $8,500
Fire risk 3/10 · Minor
- Est. fire insurance / yr
- $1,241 – $2,305
Heat risk 10/10 · Severe
- Hot days now (above 107°F)
- 7 days/yr
- Hot days in 30 yrs
- 21 days/yr
Wind risk 10/10 · Severe
- Chance of severe wind over 30 yrs
- 99.0%
Air-quality risk 1/10 · Minimal
- Unhealthy air days now
- 0 days/yr
- Unhealthy air days in 30 yrs
- 0 days/yr
Risk factors via First Street. Map © Google.
Why this score? — see what drove the C+ grade
The composite is a weighted blend of 9 inputs, each scored 0–100. Each bar is that input's sub-score; the figure is the points it added to the 100-point composite (weight × sub-score).
- Cash flow +27.3/30.0
- DSCR +9.5/10.0
- ARV discount +7.5/15.0
- 1% rule +6.8/10.0
- Schools +3.9/10.0
- Livability +3.1/5.0
- Rent growth +2.5/5.0
- Condition / age +2.5/5.0
- Appreciation +0.0/10.0
$134,900
🖨 Deal sheet (PDF) 📄 Offer letter ✓ Due diligence
Listing remarks
Enjoy the best of Gulf Coast living in this completely renovated single family homes. It features an open floor plan with vaulted ceilings and many quality upgrades such as granite counters and tile / laminate floors. The home features a new 6' privacy fence around the backyard and a covered front porch. The home is conveniently located less than 10 minutes from I-10 / Stennis Space Center, the Beaches and Casinos, Old Town Bay St Louis and the Bay St Louis Depot District.
Key facts
- Open floor plan
- Tile floors
- Laminate floors
Tags
Property features AI
Finance
- HOA & community: Playground in the community
Exterior
- Parking: Driveway on concrete
- Utilities: Public water; Public sewer; Fiber to the house
- Home design: Single family residence (house); One story; Move-in ready; 50x100 lot dimensions; Facing direction not specified
- Construction: Stucco exterior; Architectural shingle roof; Slab foundation; Built year source: assessor
- Exterior features: Front porch; Private backyard; Privacy fencing in the back yard; City lot
Interior
- Kitchen: Dishwasher; Free-standing range; Free-standing refrigerator; Granite counters
- Flooring: Carpet; Ceramic tile; Laminate
- Bathrooms: 2 full bathrooms
- Heating & cooling: Electric heating; Electric cooling
- Interior features: Cathedral ceilings; Tray ceilings; Open floorplan; Granite counters; Double vanity; Blinds on windows
- Laundry & utility: Laundry room with washer and electric dryer hookups
Neighborhood map
What this means for you Summary
Snapshot
- This is a 3-bed/2.0-bath single-family listed at $135k.
Deal economics
- At list price, monthly cash flow is $-35 ($-423/yr) — negative.
- To cash-flow at today's rent, offer at most $129k (4.6% below list).
- Meets the 1% rule at list price ($2k rent vs $135k).
- Recommended offer: $129k (4.6% below list) — sets the bar for cash-flow.
- Cap rate 9.8% vs local median 2.5% in Waveland — top-decile yield for the area; either an underpriced asset or a hidden risk that comps aren't pricing in. Stress-test before assuming the spread holds.
Location & tenants
- Location reads 61/100 on livability (#199 in MS) — a middle-class / working-renter tenant base. Strengths: cost of living A+, housing A+, health & safety A+; Watch: amenities F, commute F, employment D-.
- Hancock County School District (rural): math 47% / reading 44% proficiency, ranked #23 of 130 in MS (top 18%) — families likely to look elsewhere, expect single-tenant / working-renter base with shorter leases.
- Zoned schools: South Hancock Elementary School (math 34% / reading 32%, grade F, #168 of 375 statewide, top 45%, 535 students, 100% FRL); Hancock Middle School (math 48% / reading 44%, grade D+, #39 of 179 statewide, top 22%, 958 students, 100% FRL); Hancock High School (math 42% / reading 43%, grade F, #42 of 197 statewide, top 21%, 1,187 students, 100% FRL) — zoned schools average 100% FRL vs 58% district-wide (41 pts higher); higher-poverty schools than district average — tighter screening recommended.
- Market conditions: 622 active listings in the ZIP; 6 comparable units currently listed for rent nearby; rentals lingering (median 46d on market — plan ~5-8 weeks vacancy on turnover, expect pricing pressure); 50% of comp listings sitting > 30 days — soft ceiling on asking rent; 248 units permitted in Hancock County in 2024 (0 in 5+ unit buildings).
Forward outlook
- Local home prices are declining (-3.0%/yr); year-one equity from $933 of loan paydown is wiped out by about $4k of value loss. Plan a longer hold.
- Hancock County population projected at +20% by 2050 — long-run rental-demand tailwind backs the buy-and-hold thesis.
Negotiation context
- Only 8 days on market — expect competitive offers; lowballing is unlikely to land.
Risks & watch-outs
- Watch-outs: flood insurance adds $427/mo.
- Climate carrying-cost: in FEMA flood zone AE (mandatory federal flood insurance); severe wind risk, 99% chance of damaging wind over 30y; extreme-heat days projected 7→21/yr by 2055 (HVAC capex compounding) — expect insurance premiums to compound above CPI over the hold.
Questions for the listing agent
- What do current leases actually rent for vs. the listed asking? Can we see a recent rent roll and the last 12 months of T-12 income?
- What's the actual annual flood-insurance premium (NFIP or private), and is the property in a SFHA with mandatory coverage?
- Is there a deadline driving the sale (1031 exchange, divorce, estate, relocation)? That informs how much negotiation room exists.
- Schools are F-rated, which usually means shorter tenancies and higher turnover. Who's the typical renter profile here, and what's been the actual vacancy rate?
- What's the average days-on-market for RENTAL listings here right now (not sales)? A rising rental-DOM trend means longer vacancies and softer asking-rent achievability than the comps imply.
- What's the recent tenant-quality profile in this submarket — average credit score on applications, eviction rate, late-payment / NSF rate, and stable-employment percentage? A property-management company in the area should have these aggregated.
- How much new for-sale + rental construction is in the pipeline within 1–3 miles? Heavy new supply typically softens prices + rents 12–24 months out; constrained supply supports both.
Investment metrics
- 1% rule
- 1.18% ✓
- Cap rate
- 9.77%
- Cash-on-cash
- 12.43%
- DSCR
- 1.55
- GRM
- 7.1
CMA / ARV
- ARV (median comp)
- $134,950
- List price
- $134,900
- Delta
- -0.04%
- Verdict
- FAIR
- Comps
- 20 within 1.0 mi
Show comp detail 12 sales within ~0.75 mi
| Address | Dist | Beds/Ba | Sqft | Sold | Price | $/sf | Match |
|---|---|---|---|---|---|---|---|
| 6031 E Newton St | 0.00mi | 3/2.0 | 1,396 (+6%) | 1mo | $134,900 | $97 | 90 |
| 6125 E Madison St | 0.19mi | 3/2.0 | 1,320 (0%) | 4mo | $84,500 | $64 | 88 |
| 6101 E Quitman St | 0.19mi | 3/2.0 | 1,344 (+2%) | 6mo | $139,000 | $103 | 83 |
| 6263 E Newton St | 0.46mi | 3/2.0 | 1,296 (-2%) | 1mo | $129,900 | $100 | 75 |
| 6122 E Jackson St | 0.27mi | 3/2.0 | 1,185 (-10%) | 2mo | $135,000 | $114 | 68 |
| 6098 W Ridley St | 0.74mi | 3/2.0 | 1,320 (0%) | 1mo | $119,995 | $91 | 64 |
| 6195 E Jackson St | 0.37mi | 3/2.0 | 1,195 (-10%) | 4mo | $123,900 | $104 | 64 |
| 6077 E Kemper St | 0.17mi | 3/1.0 | 1,134 (-14%) | 2mo | $119,500 | $105 | 63 |
| 6090 Copiah St | 0.56mi | 3/2.0 | 1,386 (+5%) | 6mo | $145,000 | $105 | 60 |
| 6045 W Clay St | 0.68mi | 3/2.0 | 1,392 (+6%) | 2mo | $134,900 | $97 | 57 |
| 6123 W Lamar St | 0.70mi | 4/2.0 (+1) | 1,398 (+6%) | 4mo | $124,900 | $89 | 49 |
| 6062 E Benton St | 0.65mi | 3/2.0 | 1,136 (-14%) | 2mo | $138,000 | $121 | 45 |
Match score weights: distance 35% · size 25% · config 20% · recency 20%. Top-matched comps best support the ARV.
Projected returns pro-forma
-3.0% appreciation · 3.0% rent growth · sell at horizon
- IRR
- -17.9%
- Equity multiple
- 0.37×
- Total profit
- $-23,864
- Equity at exit
- $20,114
- IRR
- -9.7%
- Equity multiple
- 0.40×
- Total profit
- $-22,686
- Equity at exit
- $11,664
Cash invested: $37,772 (down + closing). Projections, not guarantees.
Landlord ↔ Tenant lean methodology
- Overall (STATE)
- 90 Strongly Landlord-Friendly
- State Mississippi
- 90 Strongly Landlord-Friendly · R+11
- County
- — inherits STATE
- City
- — inherits STATE
ZIP-level market 39520
- Active inventory
- 622
- Price-to-rent
- 7.1×
Monthly cashflow live
- Estimated rent
- $1,587 high interval (Pro) →
- Mortgage (P&I)
- −$707
- Tax from tax record
- −$99 /mo · $1,184/yr
- Insurance
- −$56
- Flood insurance flood zone
- −$427 /mo · $5,118/yr
- HOA
- −$0
- Vacancy / Maint / Mgmt
- −$333
- Net cashflow
- $-35
Break-even live
Sensitivity live
| Price | -10% $41 | -5% $3 | +0% $-35 | +5% $-73 | +10% $-112 |
|---|---|---|---|---|---|
| Rent | -10% $-161 | -5% $-98 | +0% $-35 | +5% $27 | +10% $90 |
| Rate | -1.0pp $33 | -0.5pp $-1 | base $-35 | +0.5pp $-70 | +1.0pp $-106 |
UW: 25.0% down · 7.5% · 30yr · 1.5% tax · 5.0% vac · 8.0% maint · 8.0% mgmt
Financing live
Cash to close
- Down payment
- $33,725
- Closing costs
- $4,047
- Reserves months
- —
- Total cash needed
- —
Loan-product check · same deal, 3 products live
Conventional
25% down · 7.5% · 30yr
- Down + closing
- —
- Monthly P&I
- —
- Monthly cashflow
- —
- DSCR
- —
- Eligible?
- —
Personal DTI + credit; lowest rate.
DSCR
20% down · 8.5% · 30yr
- Down + closing
- —
- Monthly P&I
- —
- Monthly cashflow
- —
- DSCR
- —
- Eligible?
- —
No personal income docs; deal must DSCR.
Hard money
10% down · 12.0% · 12mo
- Down + closing
- —
- Monthly P&I
- —
- Monthly cashflow
- —
- DSCR
- —
- Eligible?
- —
Short-term bridge; refi at stabilization.
Rent comps 6 comps
| Address | Beds | Baths | Sqft | Rent | $/sqft | DOM | Units | Dist |
|---|---|---|---|---|---|---|---|---|
| 6095 E Lamar St Bay Saint Louis, MS | 3.0 | 2.0 | 1392 | $1,645 | $1.18 | 45d | 1 | 0.13mi |
| 6004 E Jackson St Bay Saint Louis, MS | 3.0 | 2.0 | 1329 | $1,700 | $1.28 | 45d | 1 | 0.21mi |
| 6225 E Newton St Bay Saint Louis, MS | 3.0 | 2.0 | 1064 | $1,450 | $1.36 | 13d | 1 | 0.37mi |
| 6227 E Newton St Bay St Louis, MS | 3.0 | 2.0 | 1064 | $1,450 | $1.36 | 45d | 1 | 0.38mi |
| 8016 Lowndes St Bay St Louis, MS | 3.0 | 2.0 | 1083 | $1,250 | $1.15 | 15d | 1 | 1.05mi |
| 7132 Sunflower St Bay Saint Louis, MS | 3.0 | 2.0 | 933 | $1,400 | $1.50 | 13d | 1 | 1.48mi |
Listing history 3 events
-
2026-05-05status Pending 482-char remark
-
2026-04-27$134,900 Active 482-char remark
-
1999-07-16soldstatus
ⓘ Source: listings_history table (triggers on properties + properties_extension) + one-shot
backfill from property_details.listing_events for pre-trigger history.
Tax reassessment forecast MS · Resets to sale price
- Current annual tax
- $1,184 · $99/mo
- Projected year-2 tax
- $1,184 · $99/mo
- Expected delta
- $0/yr ($0/mo · 0.0%)
ⓘ Screening estimate from a state-policy table — verify with the county assessor before closing.
Climate risk First Street
- Flood 4/10 Moderate FEMA zone AE · 23% chance over 30 yrs
- Wildfire 3/10 Moderate
- Heat 10/10 Extreme 7 d/yr ≥107°F today · 21 d/yr by 30 yrs out
- Wind 10/10 Extreme 99% chance of damaging wind over 30 yrs
- Air quality 1/10 Low 0 unhealthy d/yr today · 0 by 30 yrs out
Nearby sold comps map
Loading sold comps map…
Walkable amenities ~0.75 mi
Loading nearby amenities…
Taxation est. · year 1
- Rental income
- $19,042
- − Mortgage interest
- −$7,556
- − Property taxes
- −$1,184
- − Insurance
- −$5,793
- − Repairs & maintenance
- −$1,523
- − Management
- −$1,523
- − Depreciation
- −$3,924
- Taxable loss
- −$2,463
- Est. tax savings @ 24.0%
- +$591
- After-tax cash flow
- $168/yr
For passive investors: Depreciation is non-cash, so a rental often shows a tax loss while cash-flowing — sheltering income. Rental losses are passive: they offset passive income freely, and up to $25,000/yr can offset ordinary (W-2) income if you actively participate and your MAGI is under $100k (phasing out to $0 by $150k); unused losses carry forward. On sale, claimed depreciation is recaptured at up to 25%, and gains may owe capital-gains tax (a 1031 exchange can defer both). Figures are a year-1 estimate at your 24.0% rate — not tax advice; consult a CPA.
Schools (NCES district)
- District
- Hancock County School District
- NCES district ID
- 2801740
- Math proficiency
- 47% ▼ -11.00%
- Reading proficiency
- 44% ▼ -9.00%
- Median HH income
- $47,971
- Composite
- 38.88/100
- National rank
- #4099
- State rank
- #23 of 130 in MS
Livability — Waveland
- Score
- 61/100
- State rank
- #199
- US rank
- #18110
Category grades
Schools grade is shown separately in the Schools card above.
Census & demographics
- City population
- 6,249
- Population (ZIP)
- 15,471
Population outlook (Hancock County) Hauer SSP2
- Today (2025)
- 52,161 people
- By 2030
- 54,753 · +5.0%
- By 2040
- 59,242 · +13.6%
- By 2050
- 62,417 · +19.7%
- By 2075
- 68,168 · +30.7%
- By 2100
- 69,212 · +32.7%
Race, ethnicity, and origin ACS 2023
- Neighborhood character
- Predominantly White (80%)
- Race & ethnicity
- White 80% Black 11% Two or more races 6% Hispanic / Latino 3% Asian 1%
- Common ancestry
- Lithuanian 15% Romanian 2% Serbian 2%
- Foreign-born
- 3% · Canada, China
- Languages at home
- 96% English-only · Spanish 2% Chinese 1%
Political lean MEDSL · Hancock
- 2024 margin
- Solid R (+58.7) · D 20.1% · R 78.8% · Other 1.1%
- 2008→2024 swing
- -4.4pp toward R · 2008: -54.2pp · 2024: -58.7pp
- All cycles
- 2024: R+58.7 2020: R+55.5 2016: R+59.4 2012: R+52.8 2008: R+54.2
Not yet ingested
- Civics
- —
Market trends
- HPI YoY
- ▼ -169.80%
- Current HPI
- 227.2103
- Rent YoY
- —
- Metro
- —
- State GDP YoY
- —
- F500 in state
- 0
Price history
4 events — show timeline
- 2026-05-28 Sold (MLS) — MLSU
- 2026-05-05 Pending — MLSU
- 2026-04-27 Listed $134,900 MLSU
- 1999-07-16 Sold (Public Records) — Public Records
Property tax history
+4.9%/yrLatest (2025): $1,184 · +0.0% YoY. Source: county tax records.
Cash-flow waterfall
monthlySold comps — $/sqft
last 12 mo · ≤1 miLoading sold comps…