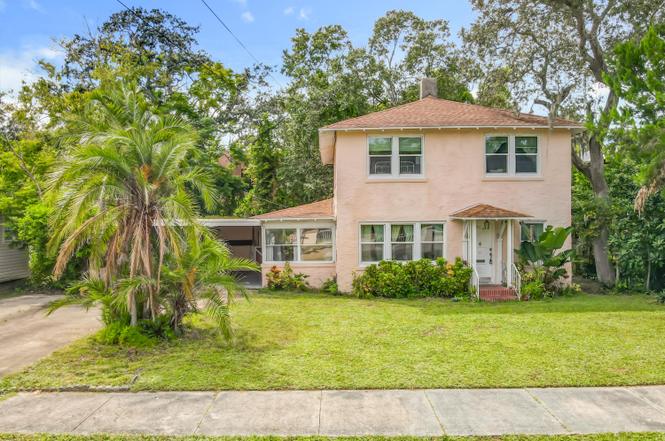
824 Indian River Ave · Titusville, FL
Flood risk 5/10 · Moderate
- FEMA flood zone
- X (unshaded)
- Chance of flooding over 30 yrs
- 0.24%
- Est. flood insurance / yr
- $507 – $1,088
Fire risk 3/10 · Minor
- Est. fire insurance / yr
- $947 – $1,759
Heat risk 10/10 · Severe
- Hot days now (above 108°F)
- 7 days/yr
- Hot days in 30 yrs
- 21 days/yr
Wind risk 10/10 · Severe
- Chance of severe wind over 30 yrs
- 99.0%
Air-quality risk 1/10 · Minimal
- Unhealthy air days now
- 0 days/yr
- Unhealthy air days in 30 yrs
- 0 days/yr
Risk factors via First Street. Map © Google.
Why this score? — see what drove the D grade
The composite is a weighted blend of 9 inputs, each scored 0–100. Each bar is that input's sub-score; the figure is the points it added to the 100-point composite (weight × sub-score).
- Cash flow +13.8/30.0
- ARV discount +7.5/15.0
- Schools +4.7/10.0
- DSCR +4.2/10.0
- Livability +4.2/5.0
- Rent growth +2.8/5.0
- 1% rule +2.6/10.0
- Condition / age +2.5/5.0
- Appreciation +0.0/10.0
$275,000
🖨 Deal sheet 📄 Offer letter ✓ Due diligence
Listing remarks
Discover timeless character in this 1945 concrete block residence, where original hardwood floors set a warm and inviting tone. The main level offers a comfortable living space that opens to a delightful kitchen with a sunny breakfast nook and an adjacent dining room overlooking the peaceful backyard. A full bathroom and a light-filled sunroom complete the downstairs, blending practicality with charm. Upstairs, you'll find three bedrooms and another full bathroom. Two of the bedrooms enjoy charming glimpses of the river, while hurricane-rated impact windows protect the eastern side of the home. The upstairs bathroom provides a spa-like retreat, offering a relaxing escape at the end of the d
Key facts
- 9,148 sq ft lot
- 2 parking spots
- Built 1945
Property features AI
Exterior
- Parking: Attached carport with 2 spaces
- Utilities: Public sewer; Electricity connected; Water connected; Propane available
- Home design: Single family residence; Single-story (entry level: 1); East-facing
- Construction: Concrete construction; Shingle roof
- Exterior features: Historic area; Many trees; No private pool
Interior
- Kitchen: Induction cooktop; Refrigerator; Gas water heater
- Bedrooms: 3 bedrooms
- Flooring: Wood flooring
- Bathrooms: 2 full bathrooms
- Heating & cooling: Central heating (electric); Central air (electric)
- Interior features: Breakfast nook; Wood-burning fireplace (1)
- Laundry & utility: Laundry located in the carport
Neighborhood map
What this means for you Summary
Snapshot
- This is a 3-bed/1.0-bath single-family listed at $275k.
Deal economics
- At list price, monthly cash flow is $26 ($313/yr) — positive.
- The deal already cash-flows at list — no discount required.
- To meet the 1% rule (rent ≥ 1% of price), the offer needs to be $210k (23.7% below list).
- Recommended offer: $210k (23.7% below list) — sets the bar for 1% rule.
Location & tenants
- Location reads 84/100 on livability (#42 in FL, #668 nationally) — a professional / high-income tenant draw. Strengths: commute A+, cost of living A+, housing A+; Watch: crime D, employment D.
- Brevard (suburban): math 53% / reading 57% proficiency, ranked #19 of 73 in FL (top 26%) — acceptable for families but not a draw, mixed tenant base, ~2y average lease.
- Zoned schools: Apollo Elementary School (math 47% / reading 51%, grade D, #1,134 of 2,144 statewide, top 54%, 730 students, 68% FRL); Andrew Jackson Middle School (math 52% / reading 47%, grade C, #259 of 571 statewide, top 46%, 551 students, 58% FRL); Titusville High School (math 33% / reading 52%, grade F, #264 of 667 statewide, top 41%, 1,314 students, 55% FRL) — zoned schools average 60% FRL vs 43% district-wide (18 pts higher); higher-poverty schools than district average — tighter screening recommended.
- Market conditions: Rents rising (+1.3%/yr); 462 active listings in the ZIP; 17 comparable units currently listed for rent nearby; rentals at typical pace (median 24d on market — plan ~3-4 weeks tenant-placement turnaround); 4,602 units permitted in Brevard County in 2024 (702 in 5+ unit buildings).
- This rent runs 37% of the median local income ($68k/yr) — at the standard rent-burdened threshold; future hikes will face affordability resistance.
Forward outlook
- Local home prices are declining (-3.0%/yr); year-one equity from $2k of loan paydown is wiped out by about $8k of value loss. Plan a longer hold.
- Brevard County population projected at +15% by 2050 — modest demand growth; plan on rents tracking national, not racing it.
Negotiation context
- It's been on market 272 days — a 12% lower offer ($242k) is reasonable based on typical stale-listing flexibility.
- 2 sale attempts; this cycle's ask has dropped $125k (31%) from the opening price — seller is motivated, your offer sets the floor, not the list.
- Current owner paid $115k; list at $275k implies a 139% gain — meaningful room to come down on a strong offer.
Risks & watch-outs
- Watch-outs: built in 1945 — expect roof / HVAC / electrical / plumbing capex.
- Climate carrying-cost: moderate flood risk; severe wind risk, 99% chance of damaging wind over 30y; extreme-heat days projected 7→21/yr by 2055 (HVAC capex compounding) — expect insurance premiums to compound above CPI over the hold.
Questions for the listing agent
- It's been on market 272 days. Have you received any prior offers? Is the seller open to a 24% concession, seller financing, or rate buy-down credit?
- Built in 1945 — when were the roof, HVAC, electrical panel, plumbing, and water heater last replaced?
- Why hasn't it sold? Are there any deal-killer items the seller is aware of (foundation, flood, title, zoning, code violations)?
- Is there a deadline driving the sale (1031 exchange, divorce, estate, relocation)? That informs how much negotiation room exists.
- Crime grade is D in this area — have there been break-ins, vandalism, or insurance claims at this property in the last 3 years? What carrier currently insures it and at what premium?
- The area grade is low — what's the realistic commute time and amenity access for the typical tenant pool here? Any planned neighborhood developments (good or bad) we should know about?
- What's the average days-on-market for RENTAL listings here right now (not sales)? A rising rental-DOM trend means longer vacancies and softer asking-rent achievability than the comps imply.
- What's the recent tenant-quality profile in this submarket — average credit score on applications, eviction rate, late-payment / NSF rate, and stable-employment percentage? A property-management company in the area should have these aggregated.
- How much new for-sale + rental construction is in the pipeline within 1–3 miles? Heavy new supply typically softens prices + rents 12–24 months out; constrained supply supports both.
Investment metrics
- 1% rule
- 0.76% ✗
- Cap rate
- 6.41%
- Cash-on-cash
- 0.41%
- DSCR
- 1.02
- GRM
- 10.9
CMA / ARV
No comps found within radius.
Projected returns pro-forma
-3.0% appreciation · 1.29% rent growth · sell at horizon
- IRR
- -17.4%
- Equity multiple
- 0.40×
- Total profit
- $-46,584
- Equity at exit
- $41,003
- IRR
- -12.5%
- Equity multiple
- 0.31×
- Total profit
- $-53,043
- Equity at exit
- $23,777
Cash invested: $77,000 (down + closing). Projections, not guarantees.
Landlord ↔ Tenant lean methodology
- Overall (STATE)
- 87 Strongly Landlord-Friendly
- State Florida
- 87 Strongly Landlord-Friendly · R+3
- County
- — inherits STATE
- City
- — inherits STATE
ZIP-level market 32780
- Rents YoY
- 1.3%
- Active inventory
- 462
- Price-to-rent
- 10.9×
Monthly cashflow live
- Estimated rent
- $2,098 high interval (Pro) →
- Mortgage (P&I)
- −$1,442
- Tax from tax record
- −$75 /mo · $899/yr
- Insurance
- −$115
- HOA
- −$0
- Vacancy / Maint / Mgmt
- −$441
- Net cashflow
- $26
Break-even live
UW: 25.0% down · 7.5% · 30yr · 1.5% tax · 5.0% vac · 8.0% maint · 8.0% mgmt
Financing live
Cash to close
- Down payment
- $68,750
- Closing costs
- $8,250
- Reserves months
- —
- Total cash needed
- —
Loan-product check · same deal, 3 products live
Conventional
25% down · 7.5% · 30yr
- Down + closing
- —
- Monthly P&I
- —
- Monthly cashflow
- —
- DSCR
- —
- Eligible?
- —
Personal DTI + credit; lowest rate.
DSCR
20% down · 8.5% · 30yr
- Down + closing
- —
- Monthly P&I
- —
- Monthly cashflow
- —
- DSCR
- —
- Eligible?
- —
No personal income docs; deal must DSCR.
Hard money
10% down · 12.0% · 12mo
- Down + closing
- —
- Monthly P&I
- —
- Monthly cashflow
- —
- DSCR
- —
- Eligible?
- —
Short-term bridge; refi at stabilization.
Rent comps 17 comps
| Address | Beds | Baths | Sqft | Rent | $/sqft | DOM | Units | Dist |
|---|---|---|---|---|---|---|---|---|
| 513 Warren St Unit 513 Titusville, FL | 2.0 | 1.0 | 1410 | $1,480 | $1.05 | 23d | 1 | 0.31mi |
| 405 Dummitt Ave Titusville, FL | 3.0 | 2.0 | 1320 | $2,150 | $1.63 | 21d | 1 | 0.44mi |
| 1405 Riverside Dr Titusville, FL | 3.0 | 2.5 | 2100 | $4,500 | $2.14 | 23d | 1 | 0.48mi |
| 1428 Riverside Dr Titusville, FL | 3.0 | 1.0 | 1412 | $2,200 | $1.56 | 23d | 1 | 0.54mi |
| 1023 S Park Ave Titusville, FL | 2.0–3.0 | 2.0 | 1002 | $1,400 | $1.40 | 13d | 1 | 0.65mi |
| 1540 Riverside Dr #402 Titusville, FL | 2.0 | 2.0 | 1120 | $1,800 | $1.61 | 23d | 1 | 0.68mi |
| 660 Minnie St Titusville, FL | 3.0 | 1.5 | 1860 | $1,500 | $0.81 | 23d | 1 | 0.79mi |
| 5 N Deleon Ave Unit Sfr Titusville, FL | 3.0 | 1.0 | 2168 | $1,700 | $0.78 | 23d | 1 | 0.81mi |
| 1590 S Deleon Ave Titusville, FL | 3.0 | 1.0 | 1072 | $1,600 | $1.49 | 23d | 1 | 0.82mi |
| 1825 Riverside Dr Titusville, FL | 2.0 | 2.0 | 1201 | $2,555 | $2.13 | 14d | 3 | 0.92mi |
| 1640 Elizabeth Ave Titusville, FL | 3.0 | 2.0 | 1319 | $2,100 | $1.59 | 23d | 1 | 0.95mi |
| 1795 S Lilac Cir Titusville, FL | 3.0 | 2.0 | 1584 | $2,000 | $1.26 | 23d | 1 | 1.09mi |
| 1279 Macon Dr Titusville, FL | 3.0 | 2.0 | 1620 | $2,000 | $1.23 | 23d | 1 | 1.14mi |
| 1885 White Sands Dr Titusville, FL | 3.0 | 2.0 | 1800 | $2,400 | $1.33 | 14d | 1 | 1.14mi |
| 1049 Macon Dr Titusville, FL | 3.0 | 2.0 | 1865 | $2,200 | $1.18 | 23d | 1 | 1.32mi |
| 888 Macon Dr Titusville, FL | 3.0 | 2.0 | 1865 | $2,000 | $1.07 | 23d | 1 | 1.34mi |
| 919 Macon Dr Titusville, FL | 3.0 | 2.0 | 1620 | $2,000 | $1.23 | 23d | 1 | 1.37mi |
Listing history 25 events
-
2026-06-18days on market $275,000 Active 272 DOM
-
2026-06-17days on market $275,000 Active 271 DOM
-
2026-06-16days on market $275,000 Active 270 DOM
-
2026-06-15days on market $275,000 Active 269 DOM
-
2026-06-14days on market $275,000 Active 267 DOM
-
2026-06-10pricedays on market $275,000 Active 264 DOM
-
2026-06-08days on market $299,000 Active 262 DOM
-
2026-06-07days on market $299,000 Active 261 DOM
-
2026-06-05days on market $299,000 Active 258 DOM
-
2026-06-03days on market $299,000 Active 257 DOM
-
2026-06-02days on market $299,000 Active 256 DOM
-
2026-06-01days on market $299,000 Active 255 DOM
-
2026-05-31days on market $299,000 Active 254 DOM
-
2026-05-31days on market $299,000 Active 253 DOM
-
2026-05-08price $299,000
-
2026-03-13price $325,000
-
2026-02-18status Active
-
2026-02-13historical Active Under Contract
-
2026-01-04price $370,000
-
2025-11-19price $375,000
-
2025-09-19$399,999 Active
-
2025-09-18historical $399,999
-
1998-01-12soldstatus $115,000
-
1989-10-01soldstatus $82,500
-
1984-07-01soldstatus $65,000
ⓘ Source: listings_history table (triggers on properties + properties_extension) + one-shot
backfill from property_details.listing_events for pre-trigger history.
Tax reassessment forecast FL · Resets to sale price
- Current annual tax
- $899 · $75/mo
- Projected year-2 tax
- $2,282 · $190/mo
- Expected delta
- +$1,384/yr (+$115/mo · 154.0%)
ⓘ Screening estimate from a state-policy table — verify with the county assessor before closing.
Climate risk First Street
- Flood 5/10 Major FEMA zone X (unshaded) · 24% chance over 30 yrs
- Wildfire 3/10 Moderate
- Heat 10/10 Extreme 7 d/yr ≥108°F today · 21 d/yr by 30 yrs out
- Wind 10/10 Extreme 99% chance of damaging wind over 30 yrs
- Air quality 1/10 Low 0 unhealthy d/yr today · 0 by 30 yrs out
Nearby sold comps map
Loading sold comps map…
Walkable amenities ~0.75 mi
Loading nearby amenities…
Taxation est. · year 1
- Rental income
- $25,180
- − Mortgage interest
- −$15,404
- − Property taxes
- −$899
- − Insurance
- −$1,375
- − Repairs & maintenance
- −$2,014
- − Management
- −$2,014
- − Depreciation
- −$8,000
- Taxable loss
- −$4,527
- Est. tax savings @ 24.0%
- +$1,086
- After-tax cash flow
- $1,399/yr
For passive investors: Depreciation is non-cash, so a rental often shows a tax loss while cash-flowing — sheltering income. Rental losses are passive: they offset passive income freely, and up to $25,000/yr can offset ordinary (W-2) income if you actively participate and your MAGI is under $100k (phasing out to $0 by $150k); unused losses carry forward. On sale, claimed depreciation is recaptured at up to 25%, and gains may owe capital-gains tax (a 1031 exchange can defer both). Figures are a year-1 estimate at your 24.0% rate — not tax advice; consult a CPA.
Schools (NCES district)
- District
- Brevard
- NCES district ID
- 1200150
- Math proficiency
- 53% ▼ -9.00%
- Reading proficiency
- 57% ▼ -4.00%
- Median HH income
- $49,426
- Composite
- 46.86/100
- National rank
- #2370
- State rank
- #19 of 73 in FL
Livability — Titusville
- Score
- 84/100
- State rank
- #42
- US rank
- #668
Category grades
Schools grade is shown separately in the Schools card above.
Census & demographics
- Census place
- Titusville, FL
- County
- Brevard County · 602,871 people
- City population
- 60,286
- Metro
- Palm Bay-Melbourne-Titusville, FL
- Population (ZIP)
- 40,064
- Household income
- $67,690
- Rent vs Own
- Severe rent burden
- 1141.0
Population outlook (Brevard County) Hauer SSP2
- Today (2025)
- 623,254 people
- By 2030
- 648,420 · +4.0%
- By 2040
- 690,009 · +10.7%
- By 2050
- 715,669 · +14.8%
- By 2075
- 775,744 · +24.5%
- By 2100
- 776,687 · +24.6%
Race, ethnicity, and origin ACS 2023
- Neighborhood character
- Predominantly White (70%)
- Race & ethnicity
- White 70% Black 13% Hispanic / Latino 8% Two or more races 8% Asian 3%
- Hispanic origin (detail)
- Mexican 1% Puerto Rican 4% Cuban 1%
- Common ancestry
- Romanian 2% Slovak 2% Lithuanian 2%
- Foreign-born
- 8% · Canada, China
- Languages at home
- 89% English-only · Spanish 6% Other Indo-European 1% German/W. Germanic 1%
Political lean MEDSL · Brevard
- 2024 margin
- Strong R (+20.8) · D 39.1% · R 59.9% · Other 1.0%
- 2008→2024 swing
- -10.4pp toward R · 2008: -10.4pp · 2024: -20.8pp
- All cycles
- 2024: R+20.8 2020: R+16.4 2016: R+19.8 2012: R+12.7 2008: R+10.4
Not yet ingested
- Civics
- —
Market trends
- HPI YoY
- ▼ -162.54%
- Current HPI
- 297.151
- Rent YoY
- ▲ 1.29%
- Metro
- Palm Bay-Melbourne-Titusville, FL
- State GDP YoY
- ▲ 3.28%
- F500 in state
- 36
Industry mix (Fortune 500 HQ in FL)
| Industry | F500 HQs | Revenue |
|---|---|---|
| Industrial Technology | 2 | $29B |
|
||
| Insurance | 2 | $17B |
|
||
| Retail | 1 | $60B |
|
||
| Technology Distribution | 1 | $58B |
|
||
| Homebuilding | 1 | $35B |
|
||
| Technology Manufacturing | 1 | $35B |
|
||
Price history
+360.0% since first listed11 events — show timeline
- 2026-05-08 Price Changed $299,000 SCMLS
- 2026-03-13 Price Changed $325,000 SCMLS
- 2026-02-18 Relisted — SCMLS
- 2026-02-13 Contingent — SCMLS
- 2026-01-04 Price Changed $370,000 SCMLS
- 2025-11-19 Price Changed $375,000 SCMLS
- 2025-09-19 Listed $399,999 SCMLS
- 2025-09-18 Coming Soon $399,999 SCMLS
- 1998-01-12 Sold (Public Records) $115,000 Public Records
- 1989-10-01 Sold (Public Records) $82,500 Public Records
- 1984-07-01 Sold (Public Records) $65,000 Public Records
Property tax history
+1.8%/yrLatest (2025): $899 · +5.1% YoY. Source: county tax records.
Cash-flow waterfall
monthlySold comps — $/sqft
last 12 mo · ≤1 miLoading sold comps…