 🏢 Co-op
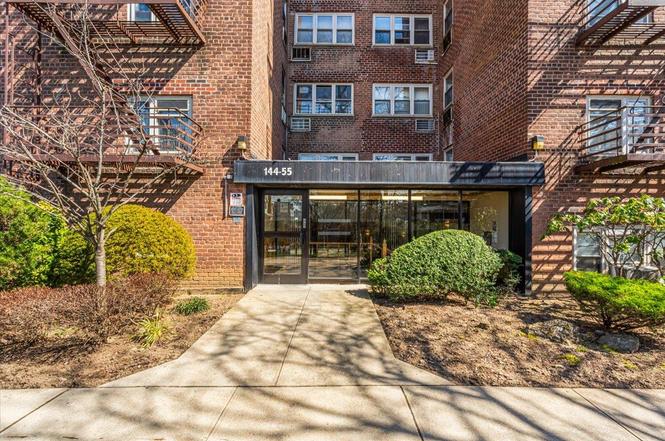
144-55 Melbourne Ave Unit 3J · New York, NY
Flood risk 1/10 · Minimal
- FEMA flood zone
- X (unshaded)
- Chance of flooding over 30 yrs
- 0.0%
- Est. flood insurance / yr
- $507 – $1,088
Fire risk 1/10 · Minimal
- Est. fire insurance / yr
- $691 – $1,283
Heat risk 6/10 · Moderate
- Hot days now (above 99°F)
- 7 days/yr
- Hot days in 30 yrs
- 15 days/yr
Wind risk 6/10 · Moderate
- Chance of severe wind over 30 yrs
- 27.0%
Air-quality risk 4/10 · Minor
- Unhealthy air days now
- 6 days/yr
- Unhealthy air days in 30 yrs
- 6 days/yr
Risk factors via First Street. Map © Google.
Why this score? — see what drove the D grade
The composite is a weighted blend of 9 inputs, each scored 0–100. Each bar is that input's sub-score; the figure is the points it added to the 100-point composite (weight × sub-score).
- 1% rule +10.0/10.0
- Cash flow +9.9/30.0
- ARV discount +7.5/15.0
- Schools +5.0/10.0
- Livability +3.8/5.0
- DSCR +2.8/10.0
- Rent growth +2.5/5.0
- Condition / age +2.5/5.0
- Appreciation +0.0/10.0
$142,500
🖨 Deal sheet (PDF) 📄 Offer letter ✓ Due diligence
Listing remarks
* * * Owner Occupied, No Subletting * * * Bright 1 Bedroom And 1 Bathroom Coop Unit, Southern Exposure Lot Closets, Maintenance Includes All Utilities ( Heat, Hot water, Gas, Electric and property tax), indoor/outdoor Parking available ( short waiting list), Playground, Storage, Are Available. Sale May Be Subject To the Terms and Conditions Of An Offering Plan, All Transportation is convenient, Buses(Q44 & Q20), Easy Access To Lie, Close To Queens College, Supermarkets, Etc. All Information Deemed Accurate However Should Be Independently Verified.
Key facts
- Garage
- Built 1954
- Listed 350 days
Neighborhood map
What this means for you Summary
Snapshot
- This is a 1-bed/1.0-bath condo listed at $142k.
Deal economics
- At list price, monthly cash flow is $-88 ($-1k/yr) — negative.
- The deal already cash-flows at list — no discount required.
- Meets the 1% rule at list price ($2k rent vs $142k).
- Recommended offer: $125k (12.0% below list) — sets the bar for market timing.
- Cap rate 5.6% vs local median 2.6% in New York — top-decile yield for the area; either an underpriced asset or a hidden risk that comps aren't pricing in. Stress-test before assuming the spread holds.
Location & tenants
- Location reads 75/100 on livability (#268 in NY, #4,188 nationally) — a middle-class / working-renter tenant base. Strengths: amenities A+, commute A+, health & safety A; Watch: crime F, cost of living F.
- Market conditions: 260 active listings in the ZIP; 29 comparable units currently listed for rent nearby; rentals at typical pace (median 21d on market — plan ~3-4 weeks tenant-placement turnaround); solid renter incomes; 5,302 units permitted in Queens County in 2024 (4,918 in 5+ unit buildings).
- This rent runs 38% of the median local income ($75k/yr) — at the standard rent-burdened threshold; future hikes will face affordability resistance.
Forward outlook
- Local home prices are declining (-3.0%/yr); year-one equity from $985 of loan paydown is wiped out by about $4k of value loss. Plan a longer hold.
- Queens County population projected at +16% by 2050 — long-run rental-demand tailwind backs the buy-and-hold thesis.
Negotiation context
- It's been on market 350 days — a 12% lower offer ($125k) is reasonable based on typical stale-listing flexibility.
- 2 sale attempts since 2y ago; this cycle's ask has dropped $8k (5%) from the opening price — seller is motivated, your offer sets the floor, not the list.
Risks & watch-outs
- Watch-outs: HOA is 41% of rent; built in 1954 — expect roof / HVAC / electrical / plumbing capex.
- Climate carrying-cost: major wind risk, 27% chance of damaging wind over 30y; extreme-heat days projected 7→15/yr by 2055 (HVAC capex compounding) — expect insurance premiums to compound above CPI over the hold.
Questions for the listing agent
- What do current leases actually rent for vs. the listed asking? Can we see a recent rent roll and the last 12 months of T-12 income?
- It's been on market 350 days. Have you received any prior offers? Is the seller open to a 12% concession, seller financing, or rate buy-down credit?
- Built in 1954 — when were the roof, HVAC, electrical panel, plumbing, and water heater last replaced?
- What does the HOA fee cover, when was the last increase, and are there any pending special assessments or reserve-fund shortfalls?
- Any open or pending special assessments — roof, HVAC, plumbing, elevator, façade? What's the per-unit balance and payoff schedule, and is the seller paying it off at close or rolling it to the buyer?
- Why hasn't it sold? Are there any deal-killer items the seller is aware of (foundation, flood, title, zoning, code violations)?
- Is there a deadline driving the sale (1031 exchange, divorce, estate, relocation)? That informs how much negotiation room exists.
- Schools are B-rated — typically a magnet for longer-tenancy family renters. What's the average tenant stay here, and is there a school-zone premium baked into asking?
- Crime grade is F in this area — have there been break-ins, vandalism, or insurance claims at this property in the last 3 years? What carrier currently insures it and at what premium?
- The area grade is low — what's the realistic commute time and amenity access for the typical tenant pool here? Any planned neighborhood developments (good or bad) we should know about?
- What's the average days-on-market for RENTAL listings here right now (not sales)? A rising rental-DOM trend means longer vacancies and softer asking-rent achievability than the comps imply.
- What's the recent tenant-quality profile in this submarket — average credit score on applications, eviction rate, late-payment / NSF rate, and stable-employment percentage? A property-management company in the area should have these aggregated.
- How much new apartment / multifamily construction is in the pipeline within 1–3 miles? Heavy new supply (>2% of stock underway) typically softens rents 12–24 months out; light construction supports rent growth.
Investment metrics
- 1% rule
- 1.67% ✓
- Cap rate
- 5.55%
- Cash-on-cash
- -2.65%
- DSCR
- 0.88
- GRM
- 5.0
CMA / ARV
No comps found within radius.
Projected returns pro-forma
-3.0% appreciation · 3.0% rent growth · sell at horizon
- IRR
- -20.1%
- Equity multiple
- 0.30×
- Total profit
- $-28,051
- Equity at exit
- $21,247
- IRR
- -12.0%
- Equity multiple
- 0.27×
- Total profit
- $-29,029
- Equity at exit
- $12,321
Cash invested: $39,900 (down + closing). Projections, not guarantees.
Landlord ↔ Tenant lean methodology
- Overall (CITY)
- 0 Strongly Tenant-Friendly
- State New York
- 15 Strongly Tenant-Friendly · D+10
- County
- — inherits STATE
- City New York
- 0 Strongly Tenant-Friendly · D+34
ZIP-level market 11367
- Active inventory
- 260
- Price-to-rent
- 5.0×
Monthly cashflow live
- Estimated rent
- $2,386 high interval (Pro) →
- Mortgage (P&I)
- −$747
- Tax est. 1.5%
- −$178 /mo · $2,138/yr
- Insurance
- −$59
- HOA est. from 1 same-building comp
- −$988
- Vacancy / Maint / Mgmt
- −$501
- Net cashflow
- $-88
Break-even live
Sensitivity live
| Price | -10% $10 | -5% $-39 | +0% $-88 | +5% $-137 | +10% $-186 |
|---|---|---|---|---|---|
| Rent | -10% $-276 | -5% $-182 | +0% $-88 | +5% $6 | +10% $101 |
| Rate | -1.0pp $-16 | -0.5pp $-52 | base $-88 | +0.5pp $-125 | +1.0pp $-162 |
UW: 25.0% down · 7.5% · 30yr · 1.5% tax · 5.0% vac · 8.0% maint · 8.0% mgmt
Financing live
Cash to close
- Down payment
- $35,625
- Closing costs
- $4,275
- Reserves months
- —
- Total cash needed
- —
Loan-product check · same deal, 3 products live
Conventional
25% down · 7.5% · 30yr
- Down + closing
- —
- Monthly P&I
- —
- Monthly cashflow
- —
- DSCR
- —
- Eligible?
- —
Personal DTI + credit; lowest rate.
DSCR
20% down · 8.5% · 30yr
- Down + closing
- —
- Monthly P&I
- —
- Monthly cashflow
- —
- DSCR
- —
- Eligible?
- —
No personal income docs; deal must DSCR.
Hard money
10% down · 12.0% · 12mo
- Down + closing
- —
- Monthly P&I
- —
- Monthly cashflow
- —
- DSCR
- —
- Eligible?
- —
Short-term bridge; refi at stabilization.
Rent comps 29 comps
| Address | Beds | Baths | Sqft | Rent | $/sqft | DOM | Units | Dist |
|---|---|---|---|---|---|---|---|---|
| 150-25 72nd Rd Flushing, NY | 1.0 | 1.0 | 700 | $2,300 | $3.29 | 25d | 1 | 0.59mi |
| 163-07 72nd Ave Unit 2G Flushing, NY | 1.0 | 1.0 | 402 | $2,000 | $4.98 | 25d | 1 | 1.00mi |
| 163-07 72nd Ave Unit 3G Flushing, NY | 2.0 | 2.0 | 716 | $2,900 | $4.05 | 25d | 1 | 1.00mi |
| 7835 147th St Unit 2E Flushing, NY | 1.0 | 1.0 | 700 | $2,200 | $3.14 | 7d | 1 | 1.12mi |
| 7837 Main St Unit 2G Queens, NY | 1.0 | 1.0 | 700 | $2,300 | $3.29 | 25d | 1 | 1.13mi |
| 14112 78th Rd Unit 1G Flushing, NY | 1.0 | 1.0 | 700 | $2,200 | $3.14 | 25d | 1 | 1.14mi |
| 11131 66th Ave Unit 3C Forest Hills, NY | 1.0 | 1.0 | 600 | $2,000 | $3.33 | 6d | 1 | 1.14mi |
| 15038 Union Tpke Unit 8L Flushing, NY | — | 1.0 | 489 | $2,100 | $4.29 | 23d | 1 | 1.28mi |
| 15038 Union Tpke Unit 8L Flushing, NY | — | 1.0 | 415 | $2,100 | $5.06 | 0d | 1 | 1.28mi |
| 13226 Avery Ave Unit 8A Flushing, NY | 2.0 | 2.0 | 725 | $2,800 | $3.86 | 5d | 1 | 1.28mi |
| 152-18 Union Tpke Unit 8S Queens, NY | — | 1.0 | 496 | $1,950 | $3.93 | 15d | 1 | 1.30mi |
| 13434 Franklin Ave Unit 4E Flushing, NY | 1.0 | 1.0 | 477 | $2,800 | $5.87 | 2d | 1 | 1.32mi |
| 13208 Pople Ave Unit 4A Flushing, NY | 1.0 | 1.0 | 650 | $2,500 | $3.85 | 25d | 1 | 1.33mi |
| 11019 72nd Rd Unit 1B Forest Hills, NY | 1.0 | 1.0 | 750 | $3,200 | $4.27 | 15d | 1 | 1.34mi |
| 110-19 72nd Rd Unit 1A Forest Hills, NY | — | 1.0 | 500 | $2,395 | $4.79 | 25d | 1 | 1.34mi |
| 13239 Pople Ave Unit 6D Flushing, NY | 1.0 | 1.0 | 750 | $2,500 | $3.33 | 5d | 1 | 1.36mi |
| 10849 63rd Ave Unit 2C Forest Hills, NY | — | 1.0 | 600 | $1,900 | $3.17 | 25d | 1 | 1.37mi |
| 105-25 67th Rd Forest Hills, NY | 1.0 | 1.0 | 750 | $1,800 | $2.40 | 20d | 1 | 1.41mi |
| 14065 Beech Ave Unit 6J Flushing, NY | — | 1.0 | 366 | $2,000 | $5.46 | 7d | 1 | 1.42mi |
| 10825 72nd Ave Forest Hills, NY | 1.0–2.0 | 1.0 | 700 | $3,500 | $5.00 | 6d | 2 | 1.44mi |
| 10919 72nd Rd Unit 6F Forest Hills, NY | 1.0 | 1.0 | 696 | $3,485 | $5.01 | 12d | 1 | 1.44mi |
| 6771 Yellowstone Blvd Unit 2R Forest Hills, NY | 1.0 | 1.0 | 700 | $2,550 | $3.64 | 25d | 1 | 1.44mi |
| 6259 108th St Unit 3S Forest Hills, NY | — | 1.0 | 500 | $1,900 | $3.80 | 5d | 1 | 1.45mi |
| 132-30 Sanford Ave Unit 4Af Queens, NY | 1.0 | 1.0 | 470 | $2,300 | $4.89 | 25d | 1 | 1.45mi |
| 6435 Yellowstone Blvd Unit 6G Forest Hills, NY | — | 1.0 | 575 | $1,900 | $3.30 | 20d | 1 | 1.46mi |
| 13203 Sanford Ave Unit 7E Flushing, NY | 2.0 | 2.0 | 702 | $2,800 | $3.99 | 25d | 1 | 1.48mi |
| 10740 70th Rd Unit 7F Forest Hills, NY | 1.0 | 1.0 | 750 | $2,650 | $3.53 | 25d | 1 | 1.48mi |
| 6405 Yellowstone Blvd Unit 403S Forest Hills, NY | 1.0 | 1.0 | 720 | $3,100 | $4.31 | 25d | 1 | 1.50mi |
| 102-55 67th Rd Unit 2V Forest Hills, NY | 1.0 | 1.0 | 633 | $2,350 | $3.71 | 20d | 1 | 1.50mi |
HOA detail condo
- Monthly dues
- $0 · $0/yr
- Likely covers
- watergaselectric
- Assessments
- None detected in remarks — confirm with the listing agent.
Listing history 6 events
-
2026-03-09status Pending
-
2025-07-21price $142,500
-
2025-03-24$150,000 Active
-
2025-01-13status Pending
-
2025-01-13historical
-
2024-03-14$150,000 Active
ⓘ Source: listings_history table (triggers on properties + properties_extension) + one-shot
backfill from property_details.listing_events for pre-trigger history.
Climate risk First Street
- Flood 1/10 Low FEMA zone X (unshaded) · 0% chance over 30 yrs
- Wildfire 1/10 Low
- Heat 6/10 Major 7 d/yr ≥99°F today · 15 d/yr by 30 yrs out
- Wind 6/10 Major 27% chance of damaging wind over 30 yrs
- Air quality 4/10 Moderate 6 unhealthy d/yr today · 6 by 30 yrs out
Nearby sold comps map
Loading sold comps map…
Walkable amenities ~0.75 mi
Loading nearby amenities…
Taxation est. · year 1
- Rental income
- $28,630
- − Mortgage interest
- −$7,982
- − Property taxes
- −$2,138
- − Insurance
- −$712
- − Repairs & maintenance
- −$2,290
- − Management
- −$2,290
- − HOA
- −$11,856
- − Depreciation
- −$4,145
- Taxable loss
- −$2,785
- Est. tax savings @ 24.0%
- +$668
- After-tax cash flow
- $-387/yr
For passive investors: Depreciation is non-cash, so a rental often shows a tax loss while cash-flowing — sheltering income. Rental losses are passive: they offset passive income freely, and up to $25,000/yr can offset ordinary (W-2) income if you actively participate and your MAGI is under $100k (phasing out to $0 by $150k); unused losses carry forward. On sale, claimed depreciation is recaptured at up to 25%, and gains may owe capital-gains tax (a 1031 exchange can defer both). Figures are a year-1 estimate at your 24.0% rate — not tax advice; consult a CPA.
Schools (NCES district)
No district data.
Livability — New York
- Score
- 75/100
- State rank
- #268
- US rank
- #4188
Category grades
Schools grade is shown separately in the Schools card above.
Census & demographics
- Census place
- New York, NY
- County
- Queens County · 1,914,869 people
- City population
- 7,731,280
- Metro
- New York-Newark-Jersey City, NY-NJ-PA
- Population (ZIP)
- 40,923
- Household income
- $75,061
- Rent vs Own
- Severe rent burden
- 2010.0
Population outlook (Queens County) Hauer SSP2
- Today (2025)
- 2,546,320 people
- By 2030
- 2,643,059 · +3.8%
- By 2040
- 2,815,563 · +10.6%
- By 2050
- 2,944,423 · +15.6%
- By 2075
- 3,123,338 · +22.7%
- By 2100
- 3,098,688 · +21.7%
Race, ethnicity, and origin ACS 2023
- Neighborhood character
- Highly diverse neighborhood (Simpson 0.72)
- Race & ethnicity
- White 42% Asian 25% Hispanic / Latino 19% Black 7% Two or more races 7%
- Hispanic origin (detail)
- Puerto Rican 3% Dominican 6%
- Common ancestry
- Scotch-Irish 5% Romanian 3% Hispanic 1%
- Foreign-born
- 41% · China, Canada, Jamaica
- Languages at home
- 41% English-only · Chinese 16% Spanish 15% Russian/Polish/Slavic 9%
Political lean MEDSL · Queens
- 2024 margin
- Strong D (+24.6) · D 62.3% · R 37.7%
- 2008→2024 swing
- -26.2pp toward R · 2008: 50.8pp · 2024: 24.6pp
- All cycles
- 2024: D+24.6 2020: D+45.2 2016: D+53.4 2012: D+58.5 2008: D+50.8
Not yet ingested
- Civics
- —
Market trends
- HPI YoY
- ▼ -211.36%
- Current HPI
- 220.6177
- Rent YoY
- —
- Metro
- New York-Newark-Jersey City, NY-NJ-PA
- State GDP YoY
- ▲ 2.60%
- F500 in state
- 92
Industry mix (Fortune 500 HQ in NY)
| Industry | F500 HQs | Revenue |
|---|---|---|
| Financial Services | 10 | $950B |
|
||
| Consumer Goods | 9 | $162B |
|
||
| Insurance | 4 | $225B |
|
||
| Telecommunications | 2 | $144B |
|
||
| Pharmaceuticals | 2 | $112B |
|
||
| Media / Entertainment | 2 | $69B |
|
||
Price history
-5.0% since first listed6 events — show timeline
- 2026-03-09 Pending — OneKey® MLS as Distributed by MLS Grid
- 2025-07-21 Price Changed $142,500 OneKey® MLS as Distributed by MLS Grid
- 2025-03-24 Listed $150,000 OneKey® MLS as Distributed by MLS Grid
- 2025-01-13 Pending — OneKey® MLS as Distributed by MLS Grid
- 2025-01-13 Listing Removed — OneKey® MLS as Distributed by MLS Grid
- 2024-03-14 Listed $150,000 OneKey® MLS as Distributed by MLS Grid
Cash-flow waterfall
monthlySold comps — $/sqft
last 12 mo · ≤1 miLoading sold comps…