 Triplex
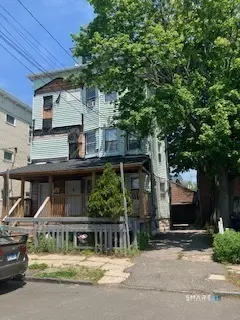
22-26 Waldorf Ave · Bridgeport, CT
Flood risk 1/10 · Minimal
- FEMA flood zone
- X (unshaded)
- Chance of flooding over 30 yrs
- 0.0%
- Est. flood insurance / yr
- $473 – $860
Fire risk 1/10 · Minimal
- Est. fire insurance / yr
- $829 – $1,539
Heat risk 6/10 · Moderate
- Hot days now (above 97°F)
- 7 days/yr
- Hot days in 30 yrs
- 15 days/yr
Wind risk 6/10 · Moderate
- Chance of severe wind over 30 yrs
- 65.0%
Air-quality risk 4/10 · Minor
- Unhealthy air days now
- 5 days/yr
- Unhealthy air days in 30 yrs
- 7 days/yr
Risk factors via First Street. Map © Google.
Why this score? — see what drove the B grade
The composite is a weighted blend of 9 inputs, each scored 0–100. Each bar is that input's sub-score; the figure is the points it added to the 100-point composite (weight × sub-score).
- Cash flow +30.0/30.0
- ARV discount +15.0/15.0
- 1% rule +10.0/10.0
- DSCR +10.0/10.0
- Livability +4.0/5.0
- Rent growth +3.0/5.0
- Schools +1.2/10.0
- Condition / age +1.0/5.0
- Appreciation +0.0/10.0
$449,900
🖨 Deal sheet (PDF) 📄 Offer letter ✓ Due diligence
Multi-family units
County records classify this as Multi-Family (2-4 Unit). Listing-text estimate: 3 units. confirmed
Listing remarks
Multi family house with 3 apartments, 14 rooms (5+5+4), newer front porch, full basement and 2 car garage. To be sold in as is condition. Seller prefers cash offers. Occupied by tenants. Black Rock Location.
Key facts
- Front porches
- Full basement
- 3,920 sq ft lot
Tags
Property features AI
Finance
- Financial info: Assessed value listed
Exterior
- Utilities: Public water connected; Public sewer connected; Domestic hot water
- Home design: Multi-family property (3-family)
- Construction: Frame construction; Masonry foundation; Asphalt shingle roof; Aluminum exterior siding; Built as a multi-family building
- Exterior features: Front porch; City views
Interior
- Bedrooms: 6 bedrooms
- Bathrooms: 3 full bathrooms
- Heating & cooling: Hot water (radiator) heating; Natural gas heat fuel
- Interior features: 14 total rooms; Full unfinished basement
Neighborhood map
What this means for you Summary
Snapshot
- This is a 3 × 2-bed/1-bath units multifamily listed at $450k. Condition is rated poor.
Deal economics
- At list price, monthly cash flow is $2k ($29k/yr) — positive. Per door: $818/mo.
- The deal already cash-flows at list — no discount required.
- Meets the 1% rule at list price ($7k rent vs $450k).
- Cap rate 12.8% vs local median 5.0% in Bridgeport — top-decile yield for the area; either an underpriced asset or a hidden risk that comps aren't pricing in. Stress-test before assuming the spread holds.
Location & tenants
- Location reads 81/100 on livability (#15 in CT, #1,374 nationally) — a professional / high-income tenant draw. Strengths: amenities A+, commute A+, health & safety A+; Watch: crime C-, employment D+, schools D-.
- Bridgeport School District (urban): math 9% / reading 19% proficiency, ranked #151 of 153 in CT (top 99%) — low school quality limits family demand, transient renter base, plan for 1-2y turnover; 97% free/reduced lunch — lower-income household profile, screen leases tightly.
- Market conditions: Rents rising (+1.8%/yr); 47 active listings in the ZIP; 2 comparable units currently listed for rent nearby; 852 units permitted in Greater Bridgeport Planning Region in 2024 (698 in 5+ unit buildings).
- At $7,042/mo this rent would consume 150% of the median local household income ($56k/yr) (locally 2367% of renters already pay >50% of income on rent) — very limited rent-growth headroom before tenants either downsize or default.
Forward outlook
- Local home prices are declining (-3.0%/yr); year-one equity from $3k of loan paydown is wiped out by about $13k of value loss. Plan a longer hold.
- At projected returns (-3.0% appreciation + 1.8% rent growth), your $126k cash investment doubles in ~6 years — after that, you're playing with house money.
Negotiation context
- Only 8 days on market — expect competitive offers; lowballing is unlikely to land.
- 2 sale attempts since 20y ago with the ask held roughly flat each time — persistent listings suggest the price (not the market) is what's stuck; bring a comps-based counter.
Risks & watch-outs
- Watch-outs: built in 1912 — expect roof / HVAC / electrical / plumbing capex.
- Climate carrying-cost: major wind risk, 65% chance of damaging wind over 30y; extreme-heat days projected 7→15/yr by 2055 (HVAC capex compounding) — expect insurance premiums to compound above CPI over the hold.
Questions for the listing agent
- Can we see the unit-by-unit rent roll, current vacancy, and any below-market leases? What's the average tenancy length?
- What capital expenditures (roof, boiler, parking lot, exteriors) have been made in the last 5 years, and what's planned in the next 2?
- Have any recent inspections been done? Can we get a copy of the seller's disclosures and any deferred-maintenance estimates?
- Built in 1912 — when were the roof, HVAC, electrical panel, plumbing, and water heater last replaced?
- Is there a deadline driving the sale (1031 exchange, divorce, estate, relocation)? That informs how much negotiation room exists.
- Schools are D-rated, which usually means shorter tenancies and higher turnover. Who's the typical renter profile here, and what's been the actual vacancy rate?
- What's the average days-on-market for RENTAL listings here right now (not sales)? A rising rental-DOM trend means longer vacancies and softer asking-rent achievability than the comps imply.
- What's the recent tenant-quality profile in this submarket — average credit score on applications, eviction rate, late-payment / NSF rate, and stable-employment percentage? A property-management company in the area should have these aggregated.
- How much new apartment / multifamily construction is in the pipeline within 1–3 miles? Heavy new supply (>2% of stock underway) typically softens rents 12–24 months out; light construction supports rent growth.
Investment metrics
- 1% rule
- 1.57% ✓
- Cap rate
- 12.84%
- Cash-on-cash
- 23.38%
- DSCR
- 2.04
- GRM
- 5.3
CMA / ARV
- ARV (on-the-fly)
- $708,471
- Comps found
- 12
Show comp detail 12 sales within ~0.75 mi
| Address | Dist | Beds/Ba | Sqft | Sold | Price | $/sf | Match |
|---|---|---|---|---|---|---|---|
| 105 Scofield Ave | 0.24mi | 6/3.0 | 3,050 (-4%) | 7mo | $650,000 | $213 | 76 |
| 22 Monroe St | 0.26mi | 5/3.0 (-1) | 3,293 (+4%) | 2mo | $685,000 | $208 | 75 |
| 220 King St | 0.31mi | 6/3.0 | 3,189 (+0%) | 14mo | $801,000 | $251 | 73 |
| 105 Fox St | 0.63mi | 6/3.0 | 3,258 (+2%) | 6mo | $665,000 | $204 | 62 |
| 344 Ellsworth St | 0.31mi | 5/2.0 (-1) | 3,001 (-6%) | 13mo | $568,500 | $189 | 57 |
| 75-77 Homestead Ave | 0.65mi | 6/3.0 | 3,368 (+6%) | 4mo | $750,000 | $223 | 56 |
| 435 Davidson St | 0.74mi | 6/3.0 | 3,170 (-0%) | 16mo | $710,000 | $224 | 52 |
| 318-316 Grovers Ave | 0.71mi | 6/3.0 | 2,807 (-12%) | 2mo | $786,500 | $280 | 46 |
| 450 Davidson St | 0.70mi | 6/6.0 | 3,310 (+4%) | 7mo | $1,100,000 | $332 | 43 |
| 324 Mountain Grove St | 0.64mi | 6/3.0 | 2,769 (-13%) | 10mo | $540,000 | $195 | 40 |
| 165 Halley Ave | 0.58mi | 6/— | 2,761 (-13%) | 14mo | $750,000 | $272 | 40 |
| 766 Hancock Ave | 0.74mi | 6/4.0 | 2,906 (-8%) | 10mo | $467,000 | $161 | 39 |
Match score weights: distance 35% · size 25% · config 20% · recency 20%. Top-matched comps best support the ARV.
Projected returns pro-forma
-3.0% appreciation · 1.81% rent growth · sell at horizon
- IRR
- 15.1%
- Equity multiple
- 1.60×
- Total profit
- $75,168
- Equity at exit
- $67,082
- IRR
- 22.9%
- Equity multiple
- 2.86×
- Total profit
- $233,760
- Equity at exit
- $38,899
Cash invested: $125,972 (down + closing). Projections, not guarantees.
Landlord ↔ Tenant lean methodology
- Overall (STATE)
- 27 Tenant-Leaning
- State Connecticut
- 27 Tenant-Leaning · D+7
- County
- — inherits STATE
- City
- — inherits STATE
ZIP-level market 06605
- Home prices YoY
- -14.5%
- Rents YoY
- 1.8%
- Active inventory
- 47
- Price-to-rent
- 16.0×
Monthly cashflow live
- Estimated rent
- $7,042 high interval (Pro) →
- Mortgage (P&I)
- −$2,359
- Tax est. 1.5%
- −$562 /mo · $6,748/yr
- Insurance
- −$187
- HOA
- −$0
- Vacancy / Maint / Mgmt
- −$1,479
- Net cashflow
- $2,454
Break-even live
Sensitivity live
| Price | -10% $2,765 | -5% $2,609 | +0% $2,454 | +5% $2,299 | +10% $2,143 |
|---|---|---|---|---|---|
| Rent | -10% $1,898 | -5% $2,176 | +0% $2,454 | +5% $2,732 | +10% $3,010 |
| Rate | -1.0pp $2,681 | -0.5pp $2,568 | base $2,454 | +0.5pp $2,337 | +1.0pp $2,219 |
3-unit breakdown (identical units grouped — click to expand)
| Units | Beds | Baths | Est. rent |
|---|---|---|---|
| 3× units | 2 | 1 | $7,041 |
| #1 | 2 | 1 | $2,347 |
| #2 | 2 | 1 | $2,347 |
| #3 | 2 | 1 | $2,347 |
| Total (3 units) | $7,042 | ||
UW: 25.0% down · 7.5% · 30yr · 1.5% tax · 5.0% vac · 8.0% maint · 8.0% mgmt
Financing live
Cash to close
- Down payment
- $112,475
- Closing costs
- $13,497
- Reserves months
- —
- Total cash needed
- —
Loan-product check · same deal, 3 products live
Conventional
25% down · 7.5% · 30yr
- Down + closing
- —
- Monthly P&I
- —
- Monthly cashflow
- —
- DSCR
- —
- Eligible?
- —
Personal DTI + credit; lowest rate.
DSCR
20% down · 8.5% · 30yr
- Down + closing
- —
- Monthly P&I
- —
- Monthly cashflow
- —
- DSCR
- —
- Eligible?
- —
No personal income docs; deal must DSCR.
Hard money
10% down · 12.0% · 12mo
- Down + closing
- —
- Monthly P&I
- —
- Monthly cashflow
- —
- DSCR
- —
- Eligible?
- —
Short-term bridge; refi at stabilization.
Rent comps 2 comps
| Address | Beds | Baths | Sqft | Rent | $/sqft | DOM | Units | Dist |
|---|---|---|---|---|---|---|---|---|
| 108 New England Ave Fairfield, CT | 5.0 | 4.5 | 3225 | $7,500 | $2.33 | 46d | 1 | 0.87mi |
| 241 Lewis St Unit 241 Bridgeport, CT | 6.0 | 2.0 | 2300 | $3,500 | $1.52 | 46d | 1 | 1.24mi |
Listing history 3 events
-
2026-05-18$449,900 Active
-
2006-09-05historical
-
2006-06-04$379,777
ⓘ Source: listings_history table (triggers on properties + properties_extension) + one-shot
backfill from property_details.listing_events for pre-trigger history.
Climate risk First Street
- Flood 1/10 Low FEMA zone X (unshaded) · 0% chance over 30 yrs
- Wildfire 1/10 Low
- Heat 6/10 Major 7 d/yr ≥97°F today · 15 d/yr by 30 yrs out
- Wind 6/10 Major 65% chance of damaging wind over 30 yrs
- Air quality 4/10 Moderate 5 unhealthy d/yr today · 7 by 30 yrs out
Nearby sold comps map
Loading sold comps map…
Walkable amenities ~0.75 mi
Loading nearby amenities…
Taxation est. · year 1
- Rental income
- $84,504
- − Mortgage interest
- −$25,201
- − Property taxes
- −$6,748
- − Insurance
- −$2,250
- − Repairs & maintenance
- −$6,760
- − Management
- −$6,760
- − Depreciation
- −$13,088
- Taxable income
- $23,696
- Est. tax owed @ 24.0%
- −$5,687
- After-tax cash flow
- $23,761/yr
For passive investors: Depreciation is non-cash, so a rental often shows a tax loss while cash-flowing — sheltering income. Rental losses are passive: they offset passive income freely, and up to $25,000/yr can offset ordinary (W-2) income if you actively participate and your MAGI is under $100k (phasing out to $0 by $150k); unused losses carry forward. On sale, claimed depreciation is recaptured at up to 25%, and gains may owe capital-gains tax (a 1031 exchange can defer both). Figures are a year-1 estimate at your 24.0% rate — not tax advice; consult a CPA.
Condition & rehab AI · 4 photos
This multi-family property requires extensive repairs and updates to its exterior and interior, significantly impacting its current condition and value. Significant investments in repairs and improvements are necessary to bring it up to a livable and marketable standard.
Repairs flagged
- Major siding — Severe weathering and peeling
- Major roof — Missing shingles and structural damage
- Major flooring — Exposed concrete and debris
- Major interior walls/paint — No interior photos available
Value-add opportunities
- Both exterior repairs and landscaping — Improves curb appeal and overall property value
- Both interior repairs and updates — Enhances living conditions and rental appeal
Renovation cost estimate screening
| Repair item | Severity | Est. cost |
|---|---|---|
| siding · Severe weathering and peeling | Major | $15,000–50,000 |
| roof · Missing shingles and structural damage | Major | $15,000–50,000 |
| flooring · Exposed concrete and debris | Major | $15,000–50,000 |
| interior walls/paint · No interior photos available | Major | $15,000–50,000 |
| Total estimated repair cost · 4 items | $60,000–200,000 |
Value-add ROI direction
- Both exterior repairs and landscaping — Improves curb appeal and overall property value ↑
- Both interior repairs and updates — Enhances living conditions and rental appeal ↑
ⓘ Cost ranges are severity-bucket heuristics (US national rule-of-thumb). Get contractor quotes + a written scope before underwriting a rehab budget.
Schools (NCES district)
- District
- Bridgeport School District
- NCES district ID
- 0900450
- Math proficiency
- 9% ▼ -7.00%
- Reading proficiency
- 19% ▼ -10.00%
- Median HH income
- $41,507
- Composite
- 12.09/100
- National rank
- #9656
- State rank
- #151 of 153 in CT
Livability — Bridgeport
- Score
- 81/100
- State rank
- #15
- US rank
- #1374
Category grades
Schools grade is shown separately in the Schools card above.
Census & demographics
- Census place
- Bridgeport, CT
- County
- Fairfield County · 765,532 people
- City population
- 149,153
- Metro
- Bridgeport-Stamford-Norwalk, CT
- Population (ZIP)
- 25,929
- Household income
- $56,179
- Rent vs Own
- Severe rent burden
- 2367.0
Population outlook (Greater Bridgeport County) Hauer SSP2
- By 2040
- 365,581
Race, ethnicity, and origin ACS 2023
- Neighborhood character
- Diverse neighborhood (Simpson 0.70)
- Race & ethnicity
- Hispanic / Latino 39% White 33% Black 19% Two or more races 12% Asian 5% Native American 1%
- Hispanic origin (detail)
- Mexican 6% Puerto Rican 17% Cuban 3% Dominican 3%
- Common ancestry
- Romanian 4% Hispanic 3% Scotch-Irish 2%
- Foreign-born
- 25% · Canada, Guatemala, China
- Languages at home
- 54% English-only · Spanish 32% Other Indo-European 4% French/Haitian/Cajun 3%
Political lean MEDSL · Greater Bridgeport
- 2024 margin
- Strong D (+23.3) · D 60.9% · R 37.6% · Other 1.5%
- All cycles
- 2024: D+23.3
Not yet ingested
- Civics
- —
Market trends
- HPI YoY
- ▼ -40.42%
- Current HPI
- 238.1786
- Rent YoY
- ▲ 1.81%
- Metro
- Bridgeport-Stamford-Norwalk, CT
- State GDP YoY
- ▲ 1.06%
- F500 in state
- 38
Industry mix (Fortune 500 HQ in CT)
| Industry | F500 HQs | Revenue |
|---|---|---|
| Industrial Machinery | 4 | $38B |
|
||
| Insurance | 3 | $71B |
|
||
| Financial Services | 2 | $25B |
|
||
| Transportation / Logistics | 2 | $18B |
|
||
| Healthcare | 1 | $247B |
|
||
| Telecommunications | 1 | $55B |
|
||
Price history
+18.5% since first listed4 events — show timeline
- 2026-05-27 Pending — Smart MLS
- 2026-05-18 Listed $449,900 Smart MLS
- 2006-09-05 Listing Removed — Smart MLS
- 2006-06-04 Listed $379,777 Smart MLS
Cash-flow waterfall
monthlySold comps — $/sqft
last 12 mo · ≤1 miLoading sold comps…