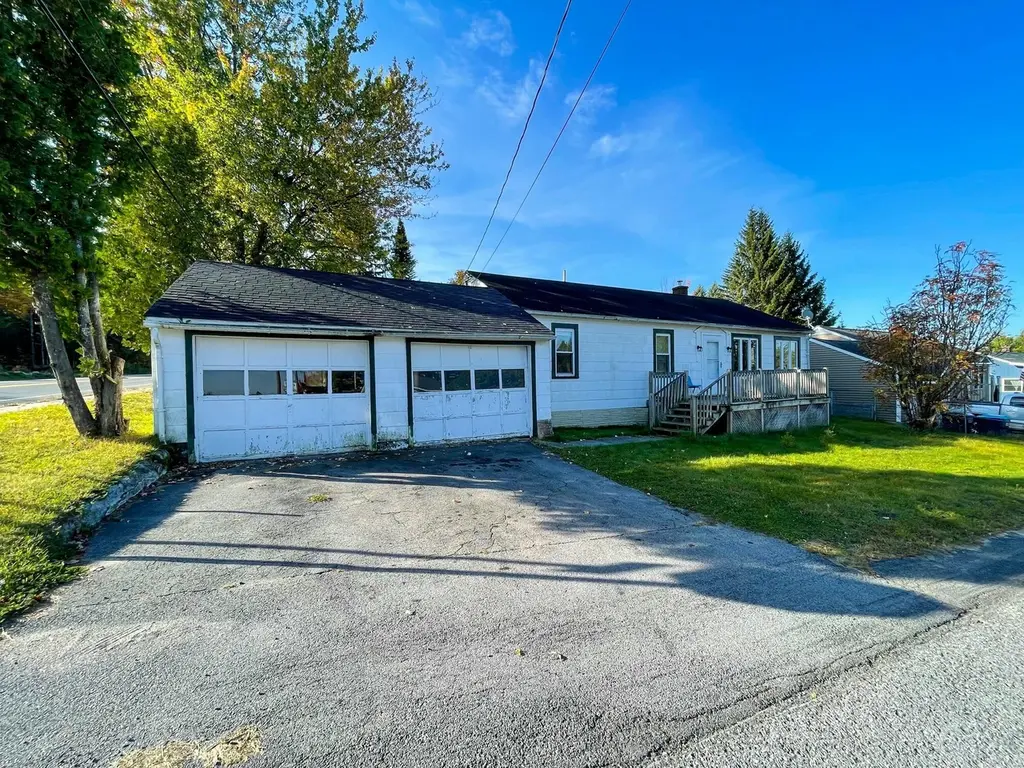
1 Marvin St · Lyon Mountain, NY
Flood risk 1/10 · Minimal
- FEMA flood zone
- X (unshaded)
- Chance of flooding over 30 yrs
- 0.0%
- Est. flood insurance / yr
- $473 – $860
Fire risk 1/10 · Minimal
- Est. fire insurance / yr
- $691 – $1,283
Heat risk 1/10 · Minimal
- Hot days now (above 84°F)
- 8 days/yr
- Hot days in 30 yrs
- 17 days/yr
Wind risk 1/10 · Minimal
- Chance of severe wind over 30 yrs
- —
Air-quality risk 2/10 · Minimal
- Unhealthy air days now
- 1 days/yr
- Unhealthy air days in 30 yrs
- 1 days/yr
Risk factors via First Street. Map © Google.
Why this score? — see what drove the B+ grade
The composite is a weighted blend of 9 inputs, each scored 0–100. Each bar is that input's sub-score; the figure is the points it added to the 100-point composite (weight × sub-score).
- Cash flow +28.4/30.0
- DSCR +10.0/10.0
- ARV discount +9.5/15.0
- Appreciation +8.2/10.0
- 1% rule +7.9/10.0
- Schools +4.1/10.0
- Condition / age +3.8/5.0
- Rent growth +2.5/5.0
- Livability +2.5/5.0
$85,000
🖨 Deal sheet 📄 Offer letter ✓ Due diligence
Listing remarks MLS
Located on a corner lot in a little neighborhood, this home is ready for someone to make it their own. Attached 2 car garage, full basement, partially fenced in backyard. New roof in 2023. New pex piping in 2023. New windows in 2024. Located under 90 minutes to Montreal and Burlington, VT. Under an hour to Plattsburgh and Lake Placid, NY.
Key facts
- Attached garage
- New pex piping
- Full basement
Tags
Neighborhood map
What this means for you Summary
Snapshot
- This is a 3-bed/1.0-bath single-family listed at $85k. Condition is rated good.
Deal economics
- At list price, monthly cash flow is $276 ($3k/yr) — positive.
- The deal already cash-flows at list — no discount required.
- Meets the 1% rule at list price ($1k rent vs $85k).
- Recommended offer: $75k (12.0% below list) — sets the bar for market timing.
Location & tenants
- Location reads 49/100 on livability (#1,174 in NY) — a working-class tenant base; expect higher turnover. Strengths: crime A, cost of living B; Watch: health & safety C-, schools F, amenities F.
- Northern Adirondack Central School District (rural): math 47% / reading 49% proficiency, ranked #430 of 590 in NY (top 73%) — families likely to look elsewhere, expect single-tenant / working-renter base with shorter leases.
- Market conditions: 2 active listings in the ZIP; 192 units permitted in Clinton County in 2024 (64 in 5+ unit buildings).
Forward outlook
- In year one you build about $6k of equity ($588 loan paydown + $5k appreciation (6.5% local appreciation)).
- Clinton County population projected at -16% by 2050 — secular population decline; favor cash flow + early exit over multi-decade hold.
- At projected returns (6.5% appreciation + 3.0% rent growth), your $24k cash investment doubles in ~3 years — after that, you're playing with house money.
- By year 6, paydown + projected appreciation supports a ~$33k cash-out refi (75% LTV) — recoverable capital for the next deal without selling this one.
Negotiation context
- It's been on market 348 days — a 12% lower offer ($75k) is reasonable based on typical stale-listing flexibility.
- 2 sale attempts; this cycle's ask has dropped $10k (11%) from the opening price — seller is motivated, your offer sets the floor, not the list.
Risks & watch-outs
- Watch-outs: built in 1948 — expect roof / HVAC / electrical / plumbing capex.
Questions for the listing agent
- It's been on market 348 days. Have you received any prior offers? Is the seller open to a 12% concession, seller financing, or rate buy-down credit?
- Built in 1948 — when were the roof, HVAC, electrical panel, plumbing, and water heater last replaced?
- Why hasn't it sold? Are there any deal-killer items the seller is aware of (foundation, flood, title, zoning, code violations)?
- Is there a deadline driving the sale (1031 exchange, divorce, estate, relocation)? That informs how much negotiation room exists.
- Schools are F-rated, which usually means shorter tenancies and higher turnover. Who's the typical renter profile here, and what's been the actual vacancy rate?
- What's the average days-on-market for RENTAL listings here right now (not sales)? A rising rental-DOM trend means longer vacancies and softer asking-rent achievability than the comps imply.
- What's the recent tenant-quality profile in this submarket — average credit score on applications, eviction rate, late-payment / NSF rate, and stable-employment percentage? A property-management company in the area should have these aggregated.
- How much new for-sale + rental construction is in the pipeline within 1–3 miles? Heavy new supply typically softens prices + rents 12–24 months out; constrained supply supports both.
Investment metrics
- 1% rule
- 1.29% ✓
- Cap rate
- 10.19%
- Cash-on-cash
- 13.93%
- DSCR
- 1.62
- GRM
- 6.5
CMA / ARV
- ARV (median comp)
- $89,050
- List price
- $85,000
- Delta
- -4.55%
- Verdict
- FAIR
- Comps
- 7 within 1.0 mi
Show comp detail 2 sales within ~0.75 mi
| Address | Dist | Beds/Ba | Sqft | Sold | Price | $/sf | Match |
|---|---|---|---|---|---|---|---|
| 3 Marvin St | 0.01mi | 3/1.0 | 1,188 (+12%) | 7mo | $82,400 | $69 | 73 |
| 2859 Standish Rd | 0.35mi | 3/1.0 | 1,044 (-1%) | 17mo | $29,000 | $28 | 67 |
Match score weights: distance 35% · size 25% · config 20% · recency 20%. Top-matched comps best support the ARV.
Projected returns pro-forma
6.46% appreciation · 3.0% rent growth · sell at horizon
- IRR
- 27.9%
- Equity multiple
- 2.87×
- Total profit
- $44,485
- Equity at exit
- $55,917
- IRR
- 25.8%
- Equity multiple
- 5.90×
- Total profit
- $116,555
- Equity at exit
- $103,618
Cash invested: $23,800 (down + closing). Projections, not guarantees.
Landlord ↔ Tenant lean methodology
- Overall (STATE)
- 15 Strongly Tenant-Friendly
- State New York
- 15 Strongly Tenant-Friendly · D+10
- County
- — inherits STATE
- City
- — inherits STATE
ZIP-level market 12952
- Home prices YoY
- 2.1%
- Active inventory
- 2
- Price-to-rent
- 6.5×
Monthly cashflow live
- Estimated rent
- $1,093 medium interval (Pro) →
- Mortgage (P&I)
- −$446
- Tax est. 1.5%
- −$106 /mo · $1,275/yr
- Insurance
- −$35
- HOA
- −$0
- Vacancy / Maint / Mgmt
- −$230
- Net cashflow
- $276
Break-even live
UW: 25.0% down · 7.5% · 30yr · 1.5% tax · 5.0% vac · 8.0% maint · 8.0% mgmt
Financing live
Cash to close
- Down payment
- $21,250
- Closing costs
- $2,550
- Reserves months
- —
- Total cash needed
- —
Loan-product check · same deal, 3 products live
Conventional
25% down · 7.5% · 30yr
- Down + closing
- —
- Monthly P&I
- —
- Monthly cashflow
- —
- DSCR
- —
- Eligible?
- —
Personal DTI + credit; lowest rate.
DSCR
20% down · 8.5% · 30yr
- Down + closing
- —
- Monthly P&I
- —
- Monthly cashflow
- —
- DSCR
- —
- Eligible?
- —
No personal income docs; deal must DSCR.
Hard money
10% down · 12.0% · 12mo
- Down + closing
- —
- Monthly P&I
- —
- Monthly cashflow
- —
- DSCR
- —
- Eligible?
- —
Short-term bridge; refi at stabilization.
Listing history 18 events
-
2026-06-18days on market $85,000 Active 348 DOM
-
2026-06-17days on market $85,000 Active 347 DOM
-
2026-06-16days on market $85,000 Active 346 DOM
-
2026-06-15days on market $85,000 Active 345 DOM
-
2026-06-13days on market $85,000 Active 343 DOM
-
2026-06-12days on market $85,000 Active 342 DOM
-
2026-06-09days on market $85,000 Active 339 DOM
-
2026-06-08days on market $85,000 Active 338 DOM
-
2026-06-07days on market $85,000 Active 337 DOM
-
2026-06-07days on market $85,000 Active 336 DOM
-
2026-06-04days on market $85,000 Active 333 DOM
-
2026-06-02days on market $85,000 Active 332 DOM
-
2026-06-01days on market $85,000 Active 331 DOM
-
2026-05-31days on market $85,000 Active 330 DOM
-
2026-05-31price $85,000 Active 329 DOM
-
2025-08-01status Active 343-char remark
Show marketing remark (343 chars)
Located on a corner lot in a little neighborhood, this home is ready for someone to make it their own. Attached 2 car garage, full basement, partially fenced in backyard. New roof in 2023. New pex piping in 2023. New windows in 2024. Located under 90 minutes to Montreal and Burlington, VT. Under an hour to Plattsburgh and Lake Placid, NY.
-
2025-04-29status Pending 343-char remark
Show marketing remark (343 chars)
Located on a corner lot in a little neighborhood, this home is ready for someone to make it their own. Attached 2 car garage, full basement, partially fenced in backyard. New roof in 2023. New pex piping in 2023. New windows in 2024. Located under 90 minutes to Montreal and Burlington, VT. Under an hour to Plattsburgh and Lake Placid, NY.
-
2025-04-02$95,000 Active 343-char remark
Show marketing remark (343 chars)
Located on a corner lot in a little neighborhood, this home is ready for someone to make it their own. Attached 2 car garage, full basement, partially fenced in backyard. New roof in 2023. New pex piping in 2023. New windows in 2024. Located under 90 minutes to Montreal and Burlington, VT. Under an hour to Plattsburgh and Lake Placid, NY.
ⓘ Source: listings_history table (triggers on properties + properties_extension) + one-shot
backfill from property_details.listing_events for pre-trigger history.
Climate risk First Street
- Flood 1/10 Low FEMA zone X (unshaded) · 0% chance over 30 yrs
- Wildfire 1/10 Low
- Heat 1/10 Low 8 d/yr ≥84°F today · 17 d/yr by 30 yrs out
- Wind 1/10 Low
- Air quality 2/10 Low 1 unhealthy d/yr today · 1 by 30 yrs out
Nearby sold comps map
Loading sold comps map…
Walkable amenities ~0.75 mi
Loading nearby amenities…
Taxation est. · year 1
- Rental income
- $13,119
- − Mortgage interest
- −$4,761
- − Property taxes
- −$1,275
- − Insurance
- −$425
- − Repairs & maintenance
- −$1,050
- − Management
- −$1,050
- − Depreciation
- −$2,473
- Taxable income
- $2,086
- Est. tax owed @ 24.0%
- −$501
- After-tax cash flow
- $2,814/yr
For passive investors: Depreciation is non-cash, so a rental often shows a tax loss while cash-flowing — sheltering income. Rental losses are passive: they offset passive income freely, and up to $25,000/yr can offset ordinary (W-2) income if you actively participate and your MAGI is under $100k (phasing out to $0 by $150k); unused losses carry forward. On sale, claimed depreciation is recaptured at up to 25%, and gains may owe capital-gains tax (a 1031 exchange can defer both). Figures are a year-1 estimate at your 24.0% rate — not tax advice; consult a CPA.
Condition & rehab AI · 2 photos
This single-family home on a corner lot is in good condition with a new roof, pex piping, and windows. It's ready for a fresh coat of paint and some landscaping to enhance its curb appeal and value.
Value-add opportunities
- Both Paint exterior — Enhances curb appeal and value
- Both Landscaping — Improves curb appeal and rental value
Renovation cost estimate screening
Value-add ROI direction
- Both Paint exterior — Enhances curb appeal and value ↑
- Both Landscaping — Improves curb appeal and rental value ↑
ⓘ Cost ranges are severity-bucket heuristics (US national rule-of-thumb). Get contractor quotes + a written scope before underwriting a rehab budget.
Schools (NCES district)
- District
- Northern Adirondack Central School District
- NCES district ID
- 3621260
- Math proficiency
- 47% ▬ 0.00%
- Reading proficiency
- 49% ▲ 2.00%
- Median HH income
- $44,656
- Composite
- 40.62/100
- National rank
- #3689
- State rank
- #430 of 590 in NY
Livability — Lyon Mountain
- Score
- 49/100
- State rank
- #1174
- US rank
- #25808
Category grades
Schools grade is shown separately in the Schools card above.
Census & demographics
- Census place
- Lyon Mountain, NY
- City population
- 226
- Population (ZIP)
- 226
Population outlook (Clinton County) Hauer SSP2
- Today (2025)
- 78,791 people
- By 2030
- 76,848 · -2.5%
- By 2040
- 71,579 · -9.2%
- By 2050
- 66,471 · -15.6%
- By 2075
- 57,361 · -27.2%
- By 2100
- 47,232 · -40.1%
Race, ethnicity, and origin ACS 2023
- Neighborhood character
- Predominantly White (80%)
- Race & ethnicity
- White 80% Two or more races 20%
- Common ancestry
- Lithuanian 33% Romanian 7%
- Foreign-born
- 5% · Canada
Political lean MEDSL · Clinton
- 2024 margin
- Toss-up / Even · D 48.9% · R 51.1%
- 2008→2024 swing
- -25.1pp toward R · 2008: 22.9pp · 2024: -2.2pp
- All cycles
- 2024: R+2.2 2020: D+5.2 2016: D+0.9 2012: D+25.6 2008: D+22.9
Not yet ingested
- Civics
- —
Market trends
- HPI YoY
- ▲ 6.46%
- Current HPI
- 319.0358
- Rent YoY
- —
- Metro
- —
- State GDP YoY
- ▲ 2.60%
- F500 in state
- 92
Industry mix (Fortune 500 HQ in NY)
| Industry | F500 HQs | Revenue |
|---|---|---|
| Financial Services | 10 | $950B |
|
||
| Consumer Goods | 9 | $162B |
|
||
| Insurance | 4 | $225B |
|
||
| Telecommunications | 2 | $144B |
|
||
| Pharmaceuticals | 2 | $112B |
|
||
| Media / Entertainment | 2 | $69B |
|
||
Price history
3 events — show timeline
- 2025-08-01 Relisted — ACVMLS
- 2025-04-29 Pending — ACVMLS
- 2025-04-02 Listed $95,000 ACVMLS
Cash-flow waterfall
monthlySold comps — $/sqft
last 12 mo · ≤1 miLoading sold comps…