153 Prairie Lea Dr · Angleton, TX
Flood risk 6/10 · Moderate
- FEMA flood zone
- X (unshaded)
- Chance of flooding over 30 yrs
- 0.67%
- Est. flood insurance / yr
- $507 – $1,088
Fire risk 6/10 · Moderate
- Est. fire insurance / yr
- $1,222 – $2,270
Heat risk 10/10 · Severe
- Hot days now (above 111°F)
- 7 days/yr
- Hot days in 30 yrs
- 25 days/yr
Wind risk 9/10 · Severe
- Chance of severe wind over 30 yrs
- 99.0%
Air-quality risk 2/10 · Minimal
- Unhealthy air days now
- 1 days/yr
- Unhealthy air days in 30 yrs
- 2 days/yr
Risk factors via First Street. Map © Google.
Why this score? — see what drove the B- grade
The composite is a weighted blend of 9 inputs, each scored 0–100. Each bar is that input's sub-score; the figure is the points it added to the 100-point composite (weight × sub-score).
- Cash flow +29.5/30.0
- DSCR +10.0/10.0
- 1% rule +7.7/10.0
- ARV discount +7.5/15.0
- Livability +3.7/5.0
- Schools +3.5/10.0
- Rent growth +2.5/5.0
- Condition / age +2.5/5.0
- Appreciation +0.0/10.0
$120,000
🖨 Deal sheet 📄 Offer letter ✓ Due diligence
Listing remarks
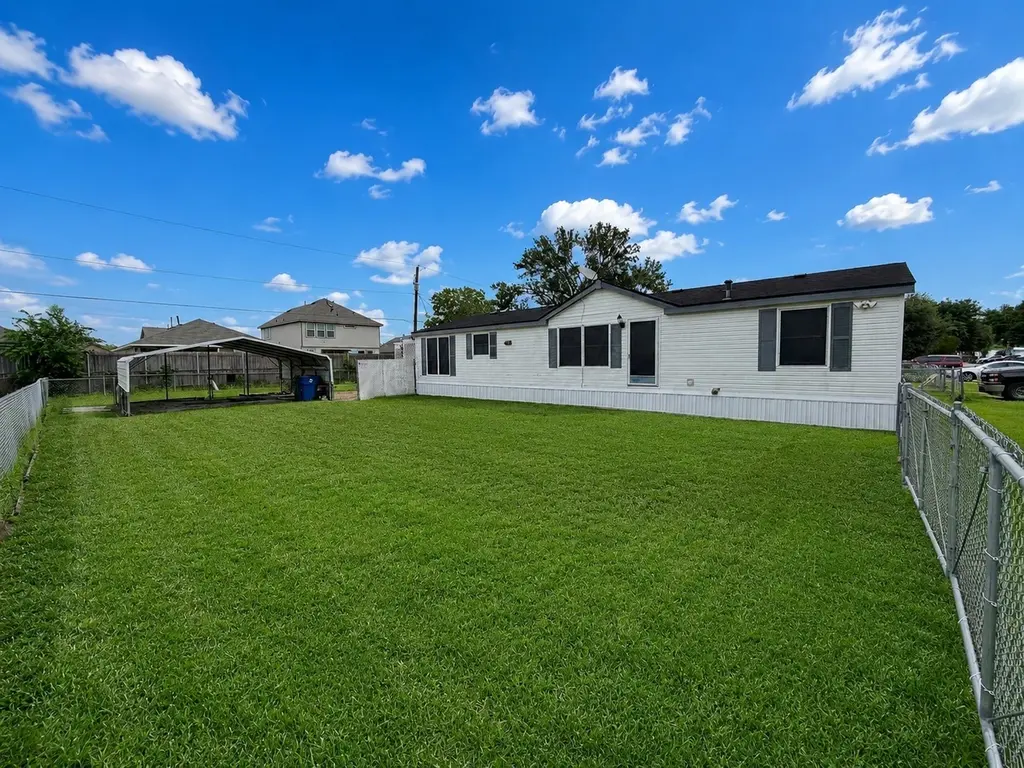
Well-maintained 1994 mobile home featuring 3 bedrooms and 2 bathrooms with a spacious living area highlighted by a cozy fireplace. This home offers a great floor plan designed for comfortable living and functionality.
Key facts
- 9,448 sq ft lot
- 2 parking spots
- Built 1994
Property features AI
Finance
- Other: Concrete road surface; Located in a subdivision
Exterior
- Parking: Detached carport; 2-space carport; Driveway; Additional parking; Electric gate
- Security: Electric gate
- Utilities: Public water; Public sewer
- Home design: Residential property; Faces west; Built in 1994
- Construction: Composition roof; Construction materials: Unknown
- Exterior features: Covered patio; Deck; Enclosed porch; Fully fenced yard; Fence (back yard); Porch; Patio; Private yard; Screened porch/patio
Interior
- Kitchen: Dishwasher; Electric range; Oven; Breakfast bar
- Bedrooms: Primary bedroom on the first floor (approx. 13x14); Bedroom on the first floor (approx. 12x12); Bedroom on the first floor (approx. 10.5x12.5)
- Flooring: Carpet; Laminate
- Bathrooms: 2 full bathrooms
- Heating & cooling: Central heating (electric); Central air conditioning (electric)
- Interior features: Breakfast bar; Jetted tub; Kitchen and family room combo; Separate shower; Tub with shower; Window treatments; Ceiling fans; Kitchen and dining combo; Electric fireplace
- Laundry & utility: Washer hookup; Electric dryer hookup
Neighborhood map
What this means for you Summary
Snapshot
- This is a 3-bed/2.0-bath manufactured listed at $120k.
Deal economics
- At list price, monthly cash flow is $430 ($5k/yr) — positive.
- The deal already cash-flows at list — no discount required.
- Meets the 1% rule at list price ($2k rent vs $120k).
- Recommended offer: $116k (3.0% below list) — sets the bar for market timing.
- Cap rate 10.6% vs local median 4.0% in Angleton — top-decile yield for the area; either an underpriced asset or a hidden risk that comps aren't pricing in. Stress-test before assuming the spread holds.
Location & tenants
- Location reads 74/100 on livability (#171 in TX, #4,520 nationally) — a middle-class / working-renter tenant base. Strengths: cost of living A+, housing A+, employment A-; Watch: amenities F, commute F.
- Angleton ISD (suburban): math 36% / reading 44% proficiency, ranked #375 of 826 in TX (top 45%) — families likely to look elsewhere, expect single-tenant / working-renter base with shorter leases.
- Zoned schools: Southside El (math 37% / reading 32%, grade F, #1,995 of 4,322 statewide, top 50%, 315 students, 82% FRL); Angleton H S (math 22% / reading 45%, grade F, #1,011 of 1,632 statewide, top 63%, 2,066 students, 67% FRL) — zoned schools average 75% FRL vs 54% district-wide (21 pts higher); higher-poverty schools than district average — tighter screening recommended.
- Market conditions: 921 active listings in the ZIP; 5 comparable units currently listed for rent nearby; rentals leasing fast (median 12d on market — plan ~1-2 weeks tenant-placement turnaround); solid renter incomes; 3,960 units permitted in Brazoria County in 2024 (593 in 5+ unit buildings).
Forward outlook
- Local home prices are declining (-3.0%/yr); year-one equity from $830 of loan paydown is wiped out by about $4k of value loss. Plan a longer hold.
- Brazoria County population projected at +44% by 2050 — long-run rental-demand tailwind backs the buy-and-hold thesis.
- At projected returns (-3.0% appreciation + 3.0% rent growth), your $34k cash investment doubles in ~8 years — after that, you're playing with house money.
Negotiation context
- It's been on market 36 days — a 3% lower offer ($116k) is reasonable based on typical stale-listing flexibility.
- 3 sale attempts since 22y ago with the ask held roughly flat each time — persistent listings suggest the price (not the market) is what's stuck; bring a comps-based counter.
Risks & watch-outs
- Climate carrying-cost: major flood risk; severe wind risk, 99% chance of damaging wind over 30y; major wildfire risk; extreme-heat days projected 7→25/yr by 2055 (HVAC capex compounding) — expect insurance premiums to compound above CPI over the hold.
Questions for the listing agent
- It's been on market 36 days. Have you received any prior offers? Is the seller open to a 3% concession, seller financing, or rate buy-down credit?
- Is there a deadline driving the sale (1031 exchange, divorce, estate, relocation)? That informs how much negotiation room exists.
- Schools are D-rated, which usually means shorter tenancies and higher turnover. Who's the typical renter profile here, and what's been the actual vacancy rate?
- What's the average days-on-market for RENTAL listings here right now (not sales)? A rising rental-DOM trend means longer vacancies and softer asking-rent achievability than the comps imply.
- What's the recent tenant-quality profile in this submarket — average credit score on applications, eviction rate, late-payment / NSF rate, and stable-employment percentage? A property-management company in the area should have these aggregated.
- How much new for-sale + rental construction is in the pipeline within 1–3 miles? Heavy new supply typically softens prices + rents 12–24 months out; constrained supply supports both.
Investment metrics
- 1% rule
- 1.27% ✓
- Cap rate
- 10.59%
- Cash-on-cash
- 15.36%
- DSCR
- 1.68
- GRM
- 6.6
CMA / ARV
- ARV (median comp)
- $317,935
- List price
- $120,000
- Delta
- -62.26%
- Verdict
- UNDERPRICED
- Comps
- 1 within 2.0 mi
Projected returns pro-forma
-3.0% appreciation · 3.0% rent growth · sell at horizon
- IRR
- 6.1%
- Equity multiple
- 1.24×
- Total profit
- $7,939
- Equity at exit
- $17,892
- IRR
- 15.4%
- Equity multiple
- 2.25×
- Total profit
- $42,141
- Equity at exit
- $10,375
Cash invested: $33,600 (down + closing). Projections, not guarantees.
Landlord ↔ Tenant lean methodology
- Overall (STATE)
- 87 Strongly Landlord-Friendly
- State Texas
- 87 Strongly Landlord-Friendly · R+5
- County
- — inherits STATE
- City
- — inherits STATE
ZIP-level market 77515
- Home prices YoY
- -5.1%
- Active inventory
- 921
- Price-to-rent
- 6.6×
Monthly cashflow live
- Estimated rent
- $1,521 high interval (Pro) →
- Mortgage (P&I)
- −$629
- Tax from tax record
- −$92 /mo · $1,106/yr
- Insurance
- −$50
- HOA
- −$0
- Vacancy / Maint / Mgmt
- −$319
- Net cashflow
- $430
Break-even live
UW: 25.0% down · 7.5% · 30yr · 1.5% tax · 5.0% vac · 8.0% maint · 8.0% mgmt
Financing live
Cash to close
- Down payment
- $30,000
- Closing costs
- $3,600
- Reserves months
- —
- Total cash needed
- —
Loan-product check · same deal, 3 products live
Conventional
25% down · 7.5% · 30yr
- Down + closing
- —
- Monthly P&I
- —
- Monthly cashflow
- —
- DSCR
- —
- Eligible?
- —
Personal DTI + credit; lowest rate.
DSCR
20% down · 8.5% · 30yr
- Down + closing
- —
- Monthly P&I
- —
- Monthly cashflow
- —
- DSCR
- —
- Eligible?
- —
No personal income docs; deal must DSCR.
Hard money
10% down · 12.0% · 12mo
- Down + closing
- —
- Monthly P&I
- —
- Monthly cashflow
- —
- DSCR
- —
- Eligible?
- —
Short-term bridge; refi at stabilization.
Rent comps 5 comps
| Address | Beds | Baths | Sqft | Rent | $/sqft | DOM | Units | Dist |
|---|---|---|---|---|---|---|---|---|
| 832 S Anderson St Angleton, TX | 3.0 | 1.0 | 1104 | $1,495 | $1.35 | 7d | 1 | 0.84mi |
| 312 Rice St Angleton, TX | 2.0 | 2.0 | 1100 | $1,195 | $1.09 | 24d | 1 | 0.89mi |
| 312 Rice St Unit B Angleton, TX | 2.0 | 1.5 | 1100 | $1,250 | $1.14 | 11d | 1 | 0.89mi |
| 312 Rice St Unit A Angleton, TX | 2.0 | 1.5 | 1100 | $1,195 | $1.09 | 24d | 1 | 0.89mi |
| 312 Rice St Angleton, TX | 2.0 | 2.0 | 1100 | $1,250 | $1.14 | 3d | 1 | 0.89mi |
Listing history 18 events
-
2026-06-18days on market $120,000 Active 36 DOM
-
2026-06-17statusdays on market $120,000 Active 35 DOM
-
2026-06-16days on market $120,000 Pending 34 DOM
-
2026-06-15days on market $120,000 Pending 33 DOM
-
2026-06-13days on market $120,000 Pending 31 DOM
-
2026-06-10status $120,000 Pending 27 DOM
-
2026-06-09days on market $120,000 Active 27 DOM
-
2026-06-08days on market $120,000 Active 26 DOM
-
2026-06-07days on market $120,000 Active 25 DOM
-
2026-06-04days on market $120,000 Active 22 DOM
-
2026-06-03days on market $120,000 Active 21 DOM
-
2026-06-02days on market $120,000 Active 20 DOM
-
2026-06-01days on market $120,000 Active 19 DOM
-
2026-05-31days on market $120,000 Active 18 DOM
-
2026-05-13$120,000 Active 217-char remark
-
2005-05-20historical
-
2004-11-16$70,000
-
1994-05-11soldstatus
ⓘ Source: listings_history table (triggers on properties + properties_extension) + one-shot
backfill from property_details.listing_events for pre-trigger history.
Tax reassessment forecast TX · Resets to sale price
- Current annual tax
- $1,106 · $92/mo
- Projected year-2 tax
- $2,196 · $183/mo
- Expected delta
- +$1,090/yr (+$91/mo · 98.5%)
ⓘ Screening estimate from a state-policy table — verify with the county assessor before closing.
Climate risk First Street
- Flood 6/10 Major FEMA zone X (unshaded) · 67% chance over 30 yrs
- Wildfire 6/10 Major
- Heat 10/10 Extreme 7 d/yr ≥111°F today · 25 d/yr by 30 yrs out
- Wind 9/10 Extreme 99% chance of damaging wind over 30 yrs
- Air quality 2/10 Low 1 unhealthy d/yr today · 2 by 30 yrs out
Nearby sold comps map
Loading sold comps map…
Walkable amenities ~0.75 mi
Loading nearby amenities…
Taxation est. · year 1
- Rental income
- $18,253
- − Mortgage interest
- −$6,722
- − Property taxes
- −$1,106
- − Insurance
- −$600
- − Repairs & maintenance
- −$1,460
- − Management
- −$1,460
- − Depreciation
- −$3,491
- Taxable income
- $3,413
- Est. tax owed @ 24.0%
- −$819
- After-tax cash flow
- $4,343/yr
For passive investors: Depreciation is non-cash, so a rental often shows a tax loss while cash-flowing — sheltering income. Rental losses are passive: they offset passive income freely, and up to $25,000/yr can offset ordinary (W-2) income if you actively participate and your MAGI is under $100k (phasing out to $0 by $150k); unused losses carry forward. On sale, claimed depreciation is recaptured at up to 25%, and gains may owe capital-gains tax (a 1031 exchange can defer both). Figures are a year-1 estimate at your 24.0% rate — not tax advice; consult a CPA.
Schools (NCES district)
- District
- Angleton ISD
- NCES district ID
- 4808310
- Math proficiency
- 36% ▼ -8.00%
- Reading proficiency
- 44% ▲ 1.00%
- Median HH income
- $55,670
- Composite
- 35.01/100
- National rank
- #5046
- State rank
- #375 of 826 in TX
Livability — Angleton
- Score
- 74/100
- State rank
- #171
- US rank
- #4520
Category grades
Schools grade is shown separately in the Schools card above.
Census & demographics
- Census place
- Angleton, TX
- County
- Brazoria County · 374,982 people
- City population
- 34,088
- Metro
- Houston-The Woodlands-Sugar Land, TX
- Population (ZIP)
- 34,088
- Household income
- $88,787
- Rent vs Own
- Severe rent burden
- 785.0
Population outlook (Brazoria County) Hauer SSP2
- Today (2025)
- 420,414 people
- By 2030
- 457,585 · +8.8%
- By 2040
- 532,232 · +26.6%
- By 2050
- 605,399 · +44.0%
- By 2075
- 779,358 · +85.4%
- By 2100
- 883,759 · +110.2%
Race, ethnicity, and origin ACS 2023
- Neighborhood character
- Diverse neighborhood (Simpson 0.58)
- Race & ethnicity
- White 55% Hispanic / Latino 33% Two or more races 18% Black 8% Asian 2%
- Hispanic origin (detail)
- Mexican 28%
- Common ancestry
- Lithuanian 3% Romanian 2% Slovak 1%
- Foreign-born
- 8% · Canada, Vietnam
- Languages at home
- 78% English-only · Spanish 20% Other Asian/Pacific 1%
Political lean MEDSL · Brazoria
- 2024 margin
- R (+19.7) · D 39.5% · R 59.2% · Other 1.3%
- 2008→2024 swing
- +9.9pp toward D · 2008: -29.6pp · 2024: -19.7pp
- All cycles
- 2024: R+19.7 2020: R+18.2 2016: R+24.6 2012: R+34.2 2008: R+29.6
Not yet ingested
- Civics
- —
Market trends
- HPI YoY
- ▼ -15.59%
- Current HPI
- 288.7286
- Rent YoY
- —
- Metro
- Houston-The Woodlands-Sugar Land, TX
- State GDP YoY
- ▲ 3.95%
- F500 in state
- 110
Industry mix (Fortune 500 HQ in TX)
| Industry | F500 HQs | Revenue |
|---|---|---|
| Energy | 16 | $1,198B |
|
||
| Technology | 5 | $198B |
|
||
| Engineering / Construction | 4 | $72B |
|
||
| Energy Services | 3 | $60B |
|
||
| Utilities | 3 | $41B |
|
||
| Healthcare | 2 | $330B |
|
||
Price history
+71.4% since first listed6 events — show timeline
- 2026-06-16 Relisted — HARMLS
- 2026-06-09 Pending — HARMLS
- 2026-05-13 Listed $120,000 HARMLS
- 2005-05-20 Listing Removed — HARMLS
- 2004-11-16 Listed $70,000 HARMLS
- 1994-05-11 Sold (Public Records) — Public Records
Property tax history
+1.8%/yrLatest (2025): $1,106 · +7.6% YoY. Source: county tax records.
Cash-flow waterfall
monthlySold comps — $/sqft
last 12 mo · ≤1 miLoading sold comps…