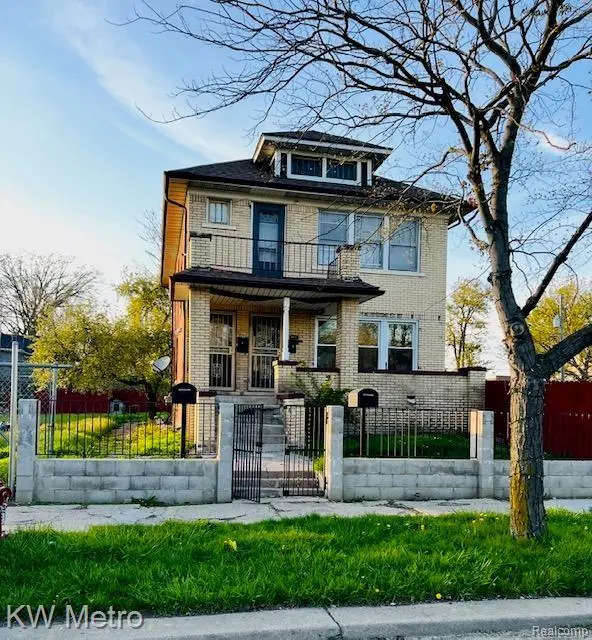
1174 & 1176 Collingwood St · Detroit, MI
Flood risk 1/10 · Minimal
- FEMA flood zone
- X (unshaded)
- Chance of flooding over 30 yrs
- 0.0%
- Est. flood insurance / yr
- $507 – $1,088
Fire risk 1/10 · Minimal
- Est. fire insurance / yr
- $784 – $1,456
Heat risk 3/10 · Minor
- Hot days now (above 96°F)
- 7 days/yr
- Hot days in 30 yrs
- 14 days/yr
Wind risk 2/10 · Minimal
- Chance of severe wind over 30 yrs
- —
Air-quality risk 4/10 · Minor
- Unhealthy air days now
- 4 days/yr
- Unhealthy air days in 30 yrs
- 6 days/yr
Risk factors via First Street. Map © Google.
Why this score? — see what drove the C grade
The composite is a weighted blend of 9 inputs, each scored 0–100. Each bar is that input's sub-score; the figure is the points it added to the 100-point composite (weight × sub-score).
- Cash flow +30.0/30.0
- DSCR +10.0/10.0
- 1% rule +8.8/10.0
- Livability +3.7/5.0
- Condition / age +2.5/5.0
- Schools +1.3/10.0
- Rent growth +1.2/5.0
- ARV discount +0.0/15.0
- Appreciation +0.0/10.0
$141,900
🖨 Deal sheet 📄 Offer letter ✓ Due diligence
Listing remarks
Look no further beautiful multi-family duplex that blends classic character with opportunity. Featuring hardwood floors and a full basement. The property offers plenty of space for customization, expansion, or added value. Centrally in the heart of the city, located just a short walking distance from the Berry Gordan Mansion and just 2 streets from the historical Boston Edison Neighborhood. You’ll enjoy quick access to Downtown Detroit, Midtown, and a wide array of dining, shopping, and entertainment options. The property also offers quick access to many major freeways. The location makes this a compelling choice for homeowners and investors alike. With schools, parks, and everyday co
Key facts
- Multi-family duplex
- Full basement
- Updated roof
Tags
Property features AI
Finance
- Other: Lot approximately 0.08 acres (30 x 120); Subdivision: RANNEYS BLVD SUB; Directions: West of Woodward; North of Chicago; Cross street: Hamilton/W Chicago
Exterior
- Parking: No garage
- Security: Owned security system; Closed-circuit camera(s)
- Utilities: Public water; Public sewer
- Home design: Single-family residence; Two levels; Entry located at lower level with steps; Brick exterior
- Construction: Block foundation
- Exterior features: Balcony; Porch; Paved road access
Interior
- Bedrooms: Total of 10 rooms (bedroom count not specified)
- Bathrooms: 2 full bathrooms
- Heating & cooling: Forced air heating with natural gas; No central cooling
- Interior features: Security system owned with closed-circuit cameras; Unfinished basement
Neighborhood map
What this means for you Summary
Snapshot
- This is a 4-bed/2.0-bath single-family listed at $142k.
Deal economics
- At list price, monthly cash flow is $551 ($7k/yr) — positive.
- The deal already cash-flows at list — no discount required.
- Meets the 1% rule at list price ($2k rent vs $142k).
Location & tenants
- Location reads 73/100 on livability (#218 in MI) — a middle-class / working-renter tenant base. Strengths: amenities A+, commute A+, cost of living A+; Watch: schools F, crime F, employment F.
- Detroit Public Schools Community District (urban): math 10% / reading 24% proficiency, ranked #499 of 540 in MI (top 92%) — low school quality limits family demand, transient renter base, plan for 1-2y turnover; 90% free/reduced lunch — lower-income household profile, screen leases tightly.
- Market conditions: Rents falling (-5.1%/yr); 257 active listings in the ZIP; 38 comparable units currently listed for rent nearby; rentals at typical pace (median 17d on market — plan ~3-4 weeks tenant-placement turnaround); lower-income renter base — watch delinquency; 2,639 units permitted in Wayne County in 2024 (1,216 in 5+ unit buildings).
- At $1,954/mo this rent would consume 54% of the median local household income ($44k/yr) (locally 1258% of renters already pay >50% of income on rent) — very limited rent-growth headroom before tenants either downsize or default.
Forward outlook
- Local home prices are declining (-3.0%/yr); year-one equity from $981 of loan paydown is wiped out by about $4k of value loss. Plan a longer hold.
- Wayne County population projected at -17% by 2050 — secular population decline; favor cash flow + early exit over multi-decade hold.
Negotiation context
- Only 1 days on market — expect competitive offers; lowballing is unlikely to land.
- 6 sale attempts with the ask held roughly flat each time — persistent listings suggest the price (not the market) is what's stuck; bring a comps-based counter.
- Current owner paid $17k; list at $142k implies a 735% gain — meaningful room to come down on a strong offer.
Risks & watch-outs
- Watch-outs: built in 1922 — expect roof / HVAC / electrical / plumbing capex.
Questions for the listing agent
- Built in 1922 — when were the roof, HVAC, electrical panel, plumbing, and water heater last replaced?
- Is there a deadline driving the sale (1031 exchange, divorce, estate, relocation)? That informs how much negotiation room exists.
- Schools are F-rated, which usually means shorter tenancies and higher turnover. Who's the typical renter profile here, and what's been the actual vacancy rate?
- Crime grade is F in this area — have there been break-ins, vandalism, or insurance claims at this property in the last 3 years? What carrier currently insures it and at what premium?
- What's the average days-on-market for RENTAL listings here right now (not sales)? A rising rental-DOM trend means longer vacancies and softer asking-rent achievability than the comps imply.
- What's the recent tenant-quality profile in this submarket — average credit score on applications, eviction rate, late-payment / NSF rate, and stable-employment percentage? A property-management company in the area should have these aggregated.
- How much new for-sale + rental construction is in the pipeline within 1–3 miles? Heavy new supply typically softens prices + rents 12–24 months out; constrained supply supports both.
Investment metrics
- 1% rule
- 1.38% ✓
- Cap rate
- 10.96%
- Cash-on-cash
- 16.65%
- DSCR
- 1.74
- GRM
- 6.1
CMA / ARV
- ARV (median comp)
- $97,040
- List price
- $141,900
- Delta
- 46.23%
- Verdict
- OVERPRICED
- Comps
- 20 within 1.0 mi
Show comp detail 12 sales within ~0.75 mi
| Address | Dist | Beds/Ba | Sqft | Sold | Price | $/sf | Match |
|---|---|---|---|---|---|---|---|
| 693 Calvert St | 0.34mi | 4/1.5 | 1,914 (-5%) | 4mo | $109,000 | $57 | 71 |
| 80 Glynn Ct | 0.53mi | 4/2.0 | 2,058 (+2%) | 0mo | $365,000 | $177 | 71 |
| 936 Glynn Ct | 0.17mi | 4/3.0 | 1,874 (-7%) | 10mo | $285,000 | $152 | 68 |
| 1423 Longfellow St | 0.41mi | 3/2.5 (-1) | 1,915 (-5%) | 5mo | $135,000 | $70 | 61 |
| 1485 Longfellow St | 0.43mi | 4/2.5 | 2,215 (+10%) | 5mo | $195,000 | $88 | 57 |
| 2011 Atkinson St | 0.75mi | 4/2.0 | 2,084 (+4%) | 3mo | $245,000 | $118 | 56 |
| 2016 Atkinson St | 0.73mi | 5/2.5 (+1) | 2,001 (-0%) | 3mo | $130,000 | $65 | 56 |
| 719 Webb St | 0.34mi | 5/3.0 (+1) | 2,225 (+11%) | 10mo | $314,000 | $141 | 49 |
| 1129 Atkinson St | 0.54mi | 4/2.5 | 2,288 (+14%) | 4mo | $15,000 | $7 | 47 |
| 2220 Webb St | 0.61mi | 4/2.5 | 1,848 (-8%) | 12mo | $130,000 | $70 | 46 |
| 1419 Atkinson St | 0.54mi | 5/2.5 (+1) | 2,274 (+13%) | 1mo | $225,000 | $99 | 45 |
| 81 Richton St | 0.59mi | 5/1.5 (+1) | 1,776 (-12%) | 3mo | $48,000 | $27 | 44 |
Match score weights: distance 35% · size 25% · config 20% · recency 20%. Top-matched comps best support the ARV.
Projected returns pro-forma
-3.0% appreciation · 0.0% rent growth · sell at horizon
- IRR
- 4.3%
- Equity multiple
- 1.16×
- Total profit
- $6,437
- Equity at exit
- $21,158
- IRR
- 10.8%
- Equity multiple
- 1.73×
- Total profit
- $28,851
- Equity at exit
- $12,269
Cash invested: $39,732 (down + closing). Projections, not guarantees.
Landlord ↔ Tenant lean methodology
- Overall (STATE)
- 62 Landlord-Friendly
- State Michigan
- 62 Landlord-Friendly · EVEN
- County
- — inherits STATE
- City
- — inherits STATE
ZIP-level market 48202
- Rents YoY
- -5.1%
- Active inventory
- 257
- Price-to-rent
- 6.1×
Monthly cashflow live
- Estimated rent
- $1,954 high interval (Pro) →
- Mortgage (P&I)
- −$744
- Tax from tax record
- −$189 /mo · $2,263/yr
- Insurance
- −$59
- HOA
- −$0
- Vacancy / Maint / Mgmt
- −$410
- Net cashflow
- $551
Break-even live
UW: 25.0% down · 7.5% · 30yr · 1.5% tax · 5.0% vac · 8.0% maint · 8.0% mgmt
Financing live
Cash to close
- Down payment
- $35,475
- Closing costs
- $4,257
- Reserves months
- —
- Total cash needed
- —
Loan-product check · same deal, 3 products live
Conventional
25% down · 7.5% · 30yr
- Down + closing
- —
- Monthly P&I
- —
- Monthly cashflow
- —
- DSCR
- —
- Eligible?
- —
Personal DTI + credit; lowest rate.
DSCR
20% down · 8.5% · 30yr
- Down + closing
- —
- Monthly P&I
- —
- Monthly cashflow
- —
- DSCR
- —
- Eligible?
- —
No personal income docs; deal must DSCR.
Hard money
10% down · 12.0% · 12mo
- Down + closing
- —
- Monthly P&I
- —
- Monthly cashflow
- —
- DSCR
- —
- Eligible?
- —
Short-term bridge; refi at stabilization.
Rent comps 38 comps
| Address | Beds | Baths | Sqft | Rent | $/sqft | DOM | Units | Dist |
|---|---|---|---|---|---|---|---|---|
| 1699 Glynn Ct Detroit, MI | 5.0 | 3.5 | 2542 | $2,500 | $0.98 | 22d | 1 | 0.41mi |
| 1929 Calvert Ave Unit 2 Detroit, MI | 3.0 | 1.0 | 1414 | $1,199 | $0.85 | 15d | 1 | 0.49mi |
| 41 Richton St Highland Park, MI | 5.0 | 2.0 | 1871 | $1,800 | $0.96 | 2d | 1 | 0.62mi |
| 41 Richton St Highland Park, MI | 5.0 | 2.0 | 1871 | $1,800 | $0.96 | 15d | 1 | 0.62mi |
| 634 Atkinson St Detroit, MI | 3.0 | 3.5 | 3000 | $6,500 | $2.17 | 10d | 1 | 0.63mi |
| 64 Glendale St Highland Park, MI | 4.0 | 1.0 | 1464 | $1,500 | $1.02 | 10d | 1 | 0.82mi |
| 2028 Gladstone St Unit 1 Detroit, MI | 5.0 | 2.0 | 2500 | $2,850 | $1.14 | 3d | 1 | 0.96mi |
| 101 Colorado St Unit NA Highland Park, MI | 4.0 | 1.5 | 1695 | $1,500 | $0.88 | 24d | 1 | 0.97mi |
| 330 Westminster St Detroit, MI | 3.0 | 1.0 | 1995 | $1,900 | $0.95 | 24d | 1 | 0.98mi |
| 330 Westminster St Unit NA Detroit, MI | 3.0 | 1.0 | 1995 | $1,900 | $0.95 | 44d | 1 | 0.98mi |
| 2080 Gladstone St #1 Detroit, MI | 4.0 | 2.0 | 2426 | $3,000 | $1.24 | 2d | 1 | 0.99mi |
| 505 Westminster St Detroit, MI | 3.0 | 1.0 | 1700 | $1,400 | $0.82 | 17d | 1 | 1.00mi |
| 2655 Collingwood St Detroit, MI | 4.0 | 1.5 | 1881 | $2,700 | $1.44 | 2d | 1 | 1.01mi |
| 2302 Hazelwood St Unit 1 Detroit, MI | 3.0 | 1.0 | 1550 | $1,273 | $0.82 | 24d | 1 | 1.02mi |
| 165 Rhode Island St Highland Park, MI | 4.0 | 1.5 | 1639 | $1,200 | $0.73 | 17d | 1 | 1.03mi |
| 1418 W Euclid St Detroit, MI | 3.0 | 1.0 | 2264 | $1,200 | $0.53 | 44d | 1 | 1.04mi |
| 216 Holbrook Unit Na Detroit, MI | 4.0 | 2.0 | 2000 | $2,200 | $1.10 | 2d | 1 | 1.04mi |
| 216 Holbrook St Detroit, MI | 4.0 | 2.0 | 2000 | $2,000 | $1.00 | 22d | 1 | 1.04mi |
| 2474 Fullerton St Detroit, MI | 3.0 | 1.0 | 1400 | $1,300 | $0.93 | 15d | 1 | 1.04mi |
| 8951 La Salle Blvd Detroit, MI | 5.0 | 2.5 | 2440 | $2,500 | $1.02 | 15d | 1 | 1.05mi |
| 8951 La Salle Blvd Detroit, MI | 4.0 | 2.5 | 2440 | $2,500 | $1.02 | 2d | 1 | 1.05mi |
| 8951 La Salle Blvd Unit NA Detroit, MI | 4.0 | 2.5 | 2440 | $2,500 | $1.02 | 10d | 1 | 1.05mi |
| 1441 W Euclid St Detroit, MI | 3.0 | 1.0 | 2380 | $2,600 | $1.09 | 24d | 1 | 1.07mi |
| 2925 Calvert St Detroit, MI | 3.0 | 1.0 | 1400 | $1,300 | $0.93 | 17d | 1 | 1.14mi |
| 419 King St Detroit, MI | 3.0 | 1.0 | 1668 | $2,300 | $1.38 | 10d | 1 | 1.16mi |
| 2509 Gladstone St Unit 1 Detroit, MI | 3.0 | 2.0 | 3000 | $2,650 | $0.88 | 2d | 1 | 1.21mi |
| 3031 Lawrence St Detroit, MI | 4.0 | 1.0 | 1700 | $1,600 | $0.94 | 17d | 1 | 1.24mi |
| 2986 Richton St Detroit, MI | 3.0 | 1.0 | 2600 | $1,200 | $0.46 | 17d | 1 | 1.27mi |
| 168 Beresford St Highland Park, MI | 4.0 | 1.0 | 1541 | $1,475 | $0.96 | 17d | 1 | 1.28mi |
| 3241 Lawrence St Detroit, MI | 4.0 | 2.0 | 2636 | $1,800 | $0.68 | 17d | 1 | 1.31mi |
| 2047 Seward St Detroit, MI | 3.0 | 1.0 | 1421 | $1,523 | $1.07 | 5d | 1 | 1.32mi |
| 2504 W Euclid St Unit 2506 Detroit, MI | 3.0 | 1.0 | 1475 | $1,675 | $1.14 | 44d | 1 | 1.36mi |
| 2506 W Euclid St Detroit, MI | 3.0 | 1.0 | 1475 | $1,675 | $1.14 | 44d | 1 | 1.36mi |
| 2504 W Euclid St Unit 2504 Detroit, MI | 3.0 | 1.0 | 1475 | $1,650 | $1.12 | 44d | 1 | 1.36mi |
| 528 E Philadelphia St Detroit, MI | 3.0 | 1.0 | 1625 | $2,400 | $1.48 | 2d | 1 | 1.37mi |
| 3322 Webb St Unit 1 Detroit, MI | 3.0 | 1.0 | 1656 | $1,350 | $0.82 | 44d | 1 | 1.40mi |
| 3322 Webb St Unit 2 Detroit, MI | 3.0 | 1.0 | 1656 | $1,350 | $0.82 | 44d | 1 | 1.40mi |
| 3322 Webb St Detroit, MI | 3.0 | 1.0 | 1600 | $1,250 | $0.78 | 17d | 1 | 1.40mi |
Listing history 11 events
-
2026-06-07statusdays on market $141,900 Pending 1 DOM
-
2026-06-04days on market $141,900 Active 27 DOM
-
2026-06-03days on market $141,900 Active 26 DOM
-
2026-06-02days on market $141,900 Active 25 DOM
-
2026-06-01days on market $141,900 Active 24 DOM
-
2026-05-31days on market $141,900 Active 23 DOM
-
2026-05-09$141,900 Active 1091-char remark
-
2026-05-09$141,900 Active 1097-char remark
-
2026-05-08historical $141,900 1091-char remark
-
2002-03-11soldstatus $17,000
-
1995-12-06soldstatus $17,000
ⓘ Source: listings_history table (triggers on properties + properties_extension) + one-shot
backfill from property_details.listing_events for pre-trigger history.
Tax reassessment forecast MI · Partial reset (capped growth)
- Current annual tax
- $2,263 · $189/mo
- Projected year-2 tax
- $2,263 · $189/mo
- Expected delta
- $0/yr ($0/mo · 0.0%)
ⓘ Screening estimate from a state-policy table — verify with the county assessor before closing.
Climate risk First Street
- Flood 1/10 Low FEMA zone X (unshaded) · 0% chance over 30 yrs
- Wildfire 1/10 Low
- Heat 3/10 Moderate 7 d/yr ≥96°F today · 14 d/yr by 30 yrs out
- Wind 2/10 Low
- Air quality 4/10 Moderate 4 unhealthy d/yr today · 6 by 30 yrs out
Nearby sold comps map
Loading sold comps map…
Walkable amenities ~0.75 mi
Loading nearby amenities…
Taxation est. · year 1
- Rental income
- $23,442
- − Mortgage interest
- −$7,949
- − Property taxes
- −$2,263
- − Insurance
- −$710
- − Repairs & maintenance
- −$1,875
- − Management
- −$1,875
- − Depreciation
- −$4,128
- Taxable income
- $4,642
- Est. tax owed @ 24.0%
- −$1,114
- After-tax cash flow
- $5,503/yr
For passive investors: Depreciation is non-cash, so a rental often shows a tax loss while cash-flowing — sheltering income. Rental losses are passive: they offset passive income freely, and up to $25,000/yr can offset ordinary (W-2) income if you actively participate and your MAGI is under $100k (phasing out to $0 by $150k); unused losses carry forward. On sale, claimed depreciation is recaptured at up to 25%, and gains may owe capital-gains tax (a 1031 exchange can defer both). Figures are a year-1 estimate at your 24.0% rate — not tax advice; consult a CPA.
Schools (NCES district)
- District
- Detroit Public Schools Community District
- NCES district ID
- 2601103
- Math proficiency
- 10% ▼ -2.00%
- Reading proficiency
- 24% ▲ 6.00%
- Median HH income
- $25,815
- Composite
- 13.06/100
- National rank
- #9564
- State rank
- #499 of 540 in MI
Livability — Detroit
- Score
- 73/100
- State rank
- #218
- US rank
- #5427
Category grades
Schools grade is shown separately in the Schools card above.
Census & demographics
- Census place
- Detroit, MI
- County
- Wayne County · 1,562,939 people
- City population
- 572,865
- Metro
- Detroit-Warren-Dearborn, MI
- Population (ZIP)
- 15,780
- Household income
- $43,627
- Rent vs Own
- Severe rent burden
- 1258.0
Population outlook (Wayne County) Hauer SSP2
- Today (2025)
- 1,675,273 people
- By 2030
- 1,620,300 · -3.3%
- By 2040
- 1,502,341 · -10.3%
- By 2050
- 1,384,039 · -17.4%
- By 2075
- 1,124,592 · -32.9%
- By 2100
- 881,193 · -47.4%
Race, ethnicity, and origin ACS 2023
- Neighborhood character
- Diverse neighborhood (Simpson 0.57)
- Race & ethnicity
- Black 60% White 26% Asian 6% Two or more races 4% Hispanic / Latino 3%
- Common ancestry
- Romanian 3% Slovak 1% Lithuanian 1%
- Foreign-born
- 8% · Canada, Vietnam
- Languages at home
- 90% English-only · Other Indo-European 3% Arabic 2% Spanish 2%
Political lean MEDSL · Wayne
- 2024 margin
- Strong D (+29.0) · D 62.7% · R 33.7% · Other 3.6%
- 2008→2024 swing
- -20.5pp toward R · 2008: 49.5pp · 2024: 29.0pp
- All cycles
- 2024: D+29.0 2020: D+38.1 2016: D+37.3 2012: D+46.9 2008: D+49.5
Not yet ingested
- Civics
- —
Market trends
- HPI YoY
- ▼ -239.24%
- Current HPI
- 145.5509
- Rent YoY
- ▼ -5.13%
- Metro
- Detroit-Warren-Dearborn, MI
- State GDP YoY
- ▲ 1.37%
- F500 in state
- 28
Industry mix (Fortune 500 HQ in MI)
| Industry | F500 HQs | Revenue |
|---|---|---|
| Automotive Parts | 3 | $48B |
|
||
| Automotive | 2 | $372B |
|
||
| Chemicals | 1 | $45B |
|
||
| Automotive Retail | 1 | $29B |
|
||
| Healthcare / Medical Devices | 1 | $23B |
|
||
| Automotive Technology | 1 | $20B |
|
||
Price history
+734.7% since first listed17 events — show timeline
- 2026-06-10 Relisted — MiRealSource-MiMLS
- 2026-06-10 Relisted — REALCOMP
- 2026-06-10 Contingent — MiRealSource-MiMLS
- 2026-06-10 Contingent — REALCOMP
- 2026-06-10 Listing Removed — MiRealSource-MiMLS
- 2026-06-06 Pending — MiRealSource-MiMLS
- 2026-06-06 Pending — REALCOMP
- 2026-06-06 Listing Removed — REALCOMP
- 2026-06-05 Listing Removed — REALCOMP
- 2026-06-05 Listing Removed — MiRealSource-MiMLS
- 2026-06-05 Listed $141,900 REALCOMP
- 2026-06-05 Listed $141,900 MiRealSource-MiMLS
- 2026-05-09 Listed $141,900 MiRealSource-MiMLS
- 2026-05-09 Listed $141,900 REALCOMP
- 2026-05-08 Coming Soon — MiRealSource-MiMLS
- 2002-03-11 Sold (Public Records) $17,000 Public Records
- 1995-12-06 Sold (Public Records) $17,000 Public Records
Property tax history
+18.8%/yrLatest (2025): $2,263 · +0.3% YoY. Source: county tax records.
Cash-flow waterfall
monthlySold comps — $/sqft
last 12 mo · ≤1 miLoading sold comps…