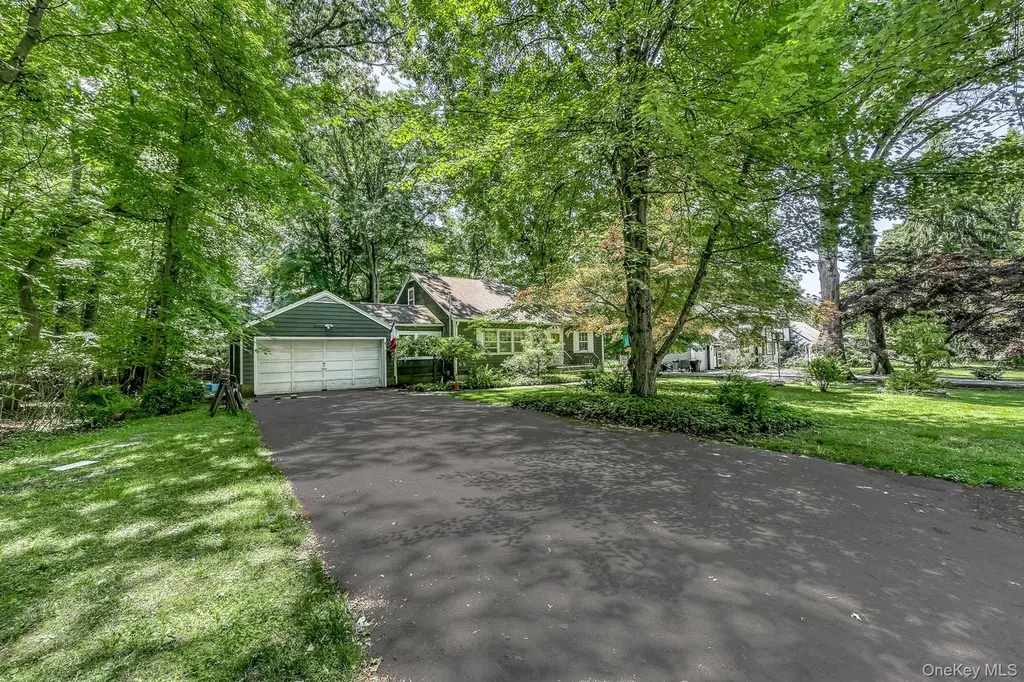
3 Woodland Pl · Airmont, NY
Flood risk 1/10 · Minimal
- FEMA flood zone
- X (unshaded)
- Chance of flooding over 30 yrs
- 0.0%
- Est. flood insurance / yr
- $473 – $860
Fire risk 1/10 · Minimal
- Est. fire insurance / yr
- $691 – $1,283
Heat risk 5/10 · Moderate
- Hot days now (above 97°F)
- 7 days/yr
- Hot days in 30 yrs
- 14 days/yr
Wind risk 5/10 · Moderate
- Chance of severe wind over 30 yrs
- 26.0%
Air-quality risk 3/10 · Minor
- Unhealthy air days now
- 2 days/yr
- Unhealthy air days in 30 yrs
- 4 days/yr
Risk factors via First Street. Map © Google.
Why this score? — see what drove the F grade
The composite is a weighted blend of 9 inputs, each scored 0–100. Each bar is that input's sub-score; the figure is the points it added to the 100-point composite (weight × sub-score).
- ARV discount +15.0/15.0
- Schools +5.1/10.0
- Livability +3.2/5.0
- Rent growth +2.5/5.0
- Condition / age +2.5/5.0
- Cash flow +0.4/30.0
- 1% rule +0.0/10.0
- DSCR +0.0/10.0
- Appreciation +0.0/10.0
$789,000
🖨 Deal sheet 📄 Offer letter ✓ Due diligence
Listing remarks
AIRMONT! Must see this Cape Cod-style home situated on stunning, flat, park-like property. Welcome home to a bright and inviting living room/dining room, spacious family room, and eat-in kitchen perfect for everyday living. The main level features two bedrooms and a full bathroom. Upstairs offers two additional bedrooms and another full bathroom. The basement has loads of potential. All this set on beautiful property with plenty of room to enjoy. A WONDERFUL OPPORTUNITY THAT WILL NOT LAST!
Key facts
- 0.57 acre lot
- 2 garage spots
- Built 1949
Property features AI
Exterior
- Parking: Garage; 2-car garage
- Utilities: Public sewer; Orange & Rockland electric service; Sewer available
- Home design: Single family residence; Three or more stories/levels; Living area reported from public records
- Construction: Frame construction
- Exterior features: Level lot; Not waterfront
Interior
- Kitchen: Eat-in kitchen; Oven; Refrigerator
- Bedrooms: Bedroom on the first floor
- Bathrooms: 2 full bathrooms
- Heating & cooling: Central air conditioning; Forced air heating; 1 fireplace
- Interior features: First-floor bedroom; First-floor full bathroom; Eat-in kitchen; Entrance foyer; Storage; Unfinished basement with Bilco doors; 9 total rooms; Three or more levels
- Laundry & utility: Washer; Dryer
Neighborhood map
What this means for you Summary
Snapshot
- This is a 3-bed/1.0-bath single-family listed at $789k.
Deal economics
- At list price, monthly cash flow is $-3k ($-42k/yr) — negative.
- To cash-flow at today's rent, offer at most $316k (60.0% below list).
- To meet the 1% rule (rent ≥ 1% of price), the offer needs to be $290k (63.2% below list).
- Recommended offer: $290k (63.2% below list) — sets the bar for 1% rule.
- Cap rate 1.0% vs local median 1.8% in Airmont — below-typical yield; the buyer is paying a premium for something (appreciation thesis, condition, location) that the cap rate doesn't capture.
Location & tenants
- Location reads 64/100 on livability (#753 in NY) — a middle-class / working-renter tenant base. Strengths: employment A+, crime A, housing B+; Watch: amenities F, commute F, cost of living F.
- Suffern Central School District (suburban): math 53% / reading 59% proficiency, ranked #242 of 590 in NY (top 41%) — acceptable for families but not a draw, mixed tenant base, ~2y average lease; only 18% free/reduced lunch — higher-income household profile.
- Zoned schools: Cherry Lane Elementary School (math 57% / reading 52%, grade C, #908 of 2,108 statewide, top 46%, 256 students, 36% FRL); Suffern Middle School (math 30% / reading 56%, grade D-, #370 of 729 statewide, top 51%, 836 students, 38% FRL); Suffern Senior High School (math 96% / reading 95%, grade A+, #76 of 1,100 statewide, top 7%, 1,486 students, 31% FRL) — zoned schools average 35% FRL vs 18% district-wide (17 pts higher); higher-poverty schools than district average — tighter screening recommended.
- Market conditions: 153 active listings in the ZIP; 429 units permitted in Rockland County in 2024 (231 in 5+ unit buildings).
Forward outlook
- Local home prices are declining (-3.0%/yr); year-one equity from $5k of loan paydown is wiped out by about $24k of value loss. Plan a longer hold.
- Rockland County population projected at +7% by 2050 — modest demand growth; plan on rents tracking national, not racing it.
Negotiation context
- Only 5 days on market — expect competitive offers; lowballing is unlikely to land.
Risks & watch-outs
- Watch-outs: built in 1949 — expect roof / HVAC / electrical / plumbing capex.
- Climate carrying-cost: moderate wind risk, 26% chance of damaging wind over 30y; extreme-heat days projected 7→14/yr by 2055 (HVAC capex compounding) — expect insurance premiums to compound above CPI over the hold.
Questions for the listing agent
- What do current leases actually rent for vs. the listed asking? Can we see a recent rent roll and the last 12 months of T-12 income?
- Built in 1949 — when were the roof, HVAC, electrical panel, plumbing, and water heater last replaced?
- Is there a deadline driving the sale (1031 exchange, divorce, estate, relocation)? That informs how much negotiation room exists.
- Schools are B-rated — typically a magnet for longer-tenancy family renters. What's the average tenant stay here, and is there a school-zone premium baked into asking?
- The area grade is low — what's the realistic commute time and amenity access for the typical tenant pool here? Any planned neighborhood developments (good or bad) we should know about?
- What's the average days-on-market for RENTAL listings here right now (not sales)? A rising rental-DOM trend means longer vacancies and softer asking-rent achievability than the comps imply.
- What's the recent tenant-quality profile in this submarket — average credit score on applications, eviction rate, late-payment / NSF rate, and stable-employment percentage? A property-management company in the area should have these aggregated.
- How much new for-sale + rental construction is in the pipeline within 1–3 miles? Heavy new supply typically softens prices + rents 12–24 months out; constrained supply supports both.
Investment metrics
- 1% rule
- 0.37% ✗
- Cap rate
- 0.99%
- Cash-on-cash
- -18.94%
- DSCR
- 0.16
- GRM
- 22.6
CMA / ARV
- ARV (on-the-fly)
- $1,030,671
- Comps found
- 12
Show comp detail 12 sales within ~0.75 mi
| Address | Dist | Beds/Ba | Sqft | Sold | Price | $/sf | Match |
|---|---|---|---|---|---|---|---|
| 48 Laura Dr | 0.26mi | 4/1.5 (+1) | 1,836 (-5%) | 5mo | $975,000 | $531 | 68 |
| 4 Laura Dr | 0.13mi | 4/2.5 (+1) | 1,788 (-8%) | 2mo | $999,000 | $559 | 68 |
| 13 Thomsen Dr | 0.33mi | 4/1.5 (+1) | 1,836 (-5%) | 5mo | $770,000 | $419 | 64 |
| 21 Besen Pkwy | 0.41mi | 4/2.0 (+1) | 1,836 (-5%) | 2mo | $925,000 | $504 | 61 |
| 34 College Rd | 0.51mi | 4/2.0 (+1) | 1,898 (-2%) | 11mo | $1,130,000 | $595 | 55 |
| 72 Laura Dr | 0.51mi | 4/1.5 (+1) | 1,896 (-2%) | 17mo | $954,000 | $503 | 51 |
| 62 Laura Dr | 0.43mi | 4/1.5 (+1) | 2,132 (+10%) | 8mo | $999,000 | $469 | 50 |
| 6 Dunn Rd | 0.47mi | 3/1.5 | 1,836 (-5%) | 21mo | $700,000 | $381 | 50 |
| 19 Dolson Rd | 0.66mi | 4/2.0 (+1) | 1,847 (-5%) | 10mo | $1,260,000 | $682 | 44 |
| 30 Dolson Rd | 0.60mi | 4/1.5 (+1) | 2,091 (+8%) | 14mo | $1,200,000 | $574 | 41 |
| 16 Highview Ave | 0.62mi | 4/1.5 (+1) | 2,210 (+14%) | 3mo | $784,500 | $355 | 39 |
| 7 Fawn Hill Dr | 0.68mi | 3/1.5 | 1,698 (-12%) | 12mo | $960,000 | $565 | 36 |
Match score weights: distance 35% · size 25% · config 20% · recency 20%. Top-matched comps best support the ARV.
Projected returns pro-forma
-3.0% appreciation · 3.0% rent growth · sell at horizon
- IRR
- -54.8%
- Equity multiple
- -0.58×
- Total profit
- $-349,727
- Equity at exit
- $117,642
- IRR
- —
- Equity multiple
- -1.67×
- Total profit
- $-589,551
- Equity at exit
- $68,218
Cash invested: $220,920 (down + closing). Projections, not guarantees.
Landlord ↔ Tenant lean methodology
- Overall (STATE)
- 15 Strongly Tenant-Friendly
- State New York
- 15 Strongly Tenant-Friendly · D+10
- County
- — inherits STATE
- City
- — inherits STATE
ZIP-level market 10952
- Active inventory
- 153
- Price-to-rent
- 22.6×
Monthly cashflow live
- Estimated rent
- $2,905 medium interval (Pro) →
- Mortgage (P&I)
- −$4,138
- Tax from tax record
- −$1,316 /mo · $15,792/yr
- Insurance
- −$329
- HOA
- −$0
- Vacancy / Maint / Mgmt
- −$610
- Net cashflow
- $-3,488
Break-even live
UW: 25.0% down · 7.5% · 30yr · 1.5% tax · 5.0% vac · 8.0% maint · 8.0% mgmt
Financing live
Cash to close
- Down payment
- $197,250
- Closing costs
- $23,670
- Reserves months
- —
- Total cash needed
- —
Loan-product check · same deal, 3 products live
Conventional
25% down · 7.5% · 30yr
- Down + closing
- —
- Monthly P&I
- —
- Monthly cashflow
- —
- DSCR
- —
- Eligible?
- —
Personal DTI + credit; lowest rate.
DSCR
20% down · 8.5% · 30yr
- Down + closing
- —
- Monthly P&I
- —
- Monthly cashflow
- —
- DSCR
- —
- Eligible?
- —
No personal income docs; deal must DSCR.
Hard money
10% down · 12.0% · 12mo
- Down + closing
- —
- Monthly P&I
- —
- Monthly cashflow
- —
- DSCR
- —
- Eligible?
- —
Short-term bridge; refi at stabilization.
Listing history 4 events
-
2026-06-09days on market $789,000 Active 5 DOM
-
2026-06-08days on market $789,000 Active 4 DOM
-
2026-06-07remarks 494-char remark
-
2026-06-07$789,000 Active 3 DOM
ⓘ Source: listings_history table (triggers on properties + properties_extension) + one-shot
backfill from property_details.listing_events for pre-trigger history.
Tax reassessment forecast NY · Partial reset (capped growth)
- Current annual tax
- $15,792 · $1,316/mo
- Projected year-2 tax
- $15,792 · $1,316/mo
- Expected delta
- $0/yr ($0/mo · 0.0%)
ⓘ Screening estimate from a state-policy table — verify with the county assessor before closing.
Climate risk First Street
- Flood 1/10 Low FEMA zone X (unshaded) · 0% chance over 30 yrs
- Wildfire 1/10 Low
- Heat 5/10 Major 7 d/yr ≥97°F today · 14 d/yr by 30 yrs out
- Wind 5/10 Major 26% chance of damaging wind over 30 yrs
- Air quality 3/10 Moderate 2 unhealthy d/yr today · 4 by 30 yrs out
Nearby sold comps map
Loading sold comps map…
Walkable amenities ~0.75 mi
Loading nearby amenities…
Taxation est. · year 1
- Rental income
- $34,859
- − Mortgage interest
- −$44,196
- − Property taxes
- −$15,792
- − Insurance
- −$3,945
- − Repairs & maintenance
- −$2,789
- − Management
- −$2,789
- − Depreciation
- −$22,953
- Taxable loss
- −$57,605
- Est. tax savings @ 24.0%
- +$13,825
- After-tax cash flow
- $-28,025/yr
For passive investors: Depreciation is non-cash, so a rental often shows a tax loss while cash-flowing — sheltering income. Rental losses are passive: they offset passive income freely, and up to $25,000/yr can offset ordinary (W-2) income if you actively participate and your MAGI is under $100k (phasing out to $0 by $150k); unused losses carry forward. On sale, claimed depreciation is recaptured at up to 25%, and gains may owe capital-gains tax (a 1031 exchange can defer both). Figures are a year-1 estimate at your 24.0% rate — not tax advice; consult a CPA.
Schools (NCES district)
- District
- Suffern Central School District
- NCES district ID
- 3628320
- Math proficiency
- 53% ▼ -17.00%
- Reading proficiency
- 59% ▼ -4.00%
- Median HH income
- $85,871
- Composite
- 51.17/100
- National rank
- #1758
- State rank
- #242 of 590 in NY
Livability — Airmont
- Score
- 64/100
- State rank
- #753
- US rank
- #14423
Category grades
Schools grade is shown separately in the Schools card above.
Census & demographics
- Census place
- Airmont, NY
- Population (ZIP)
- 47,169
Population outlook (Rockland County) Hauer SSP2
- Today (2025)
- 339,642 people
- By 2030
- 345,987 · +1.9%
- By 2040
- 357,178 · +5.2%
- By 2050
- 362,456 · +6.7%
- By 2075
- 367,281 · +8.1%
- By 2100
- 328,211 · -3.4%
Race, ethnicity, and origin ACS 2023
- Neighborhood character
- Predominantly White (88%)
- Race & ethnicity
- White 88% Black 6% Hispanic / Latino 4% Two or more races 3%
- Common ancestry
- Romanian 7% Italian 5% Hispanic 5%
- Foreign-born
- 12% · Canada
- Languages at home
- 34% English-only · German/W. Germanic 55% French/Haitian/Cajun 5% Spanish 2%
Political lean MEDSL · Rockland
- 2024 margin
- R (+11.8) · D 44.1% · R 55.9%
- 2008→2024 swing
- -17.7pp toward R · 2008: 5.9pp · 2024: -11.8pp
- All cycles
- 2024: R+11.8 2020: D+1.7 2016: D+5.1 2012: D+6.6 2008: D+5.9
Not yet ingested
- Civics
- —
Market trends
- HPI YoY
- ▼ -671.35%
- Current HPI
- 399.2068
- Rent YoY
- —
- Metro
- —
- State GDP YoY
- ▲ 2.60%
- F500 in state
- 92
Industry mix (Fortune 500 HQ in NY)
| Industry | F500 HQs | Revenue |
|---|---|---|
| Financial Services | 10 | $950B |
|
||
| Consumer Goods | 9 | $162B |
|
||
| Insurance | 4 | $225B |
|
||
| Telecommunications | 2 | $144B |
|
||
| Pharmaceuticals | 2 | $112B |
|
||
| Media / Entertainment | 2 | $69B |
|
||
Price history
1 event — show timeline
- 2026-06-04 Listed $789,000 OneKey® MLS as Distributed by MLS Grid
Property tax history
+13.4%/yrLatest (2025): $15,792 · +2.8% YoY. Source: county tax records.
Cash-flow waterfall
monthlySold comps — $/sqft
last 12 mo · ≤1 miLoading sold comps…