 Multi-family
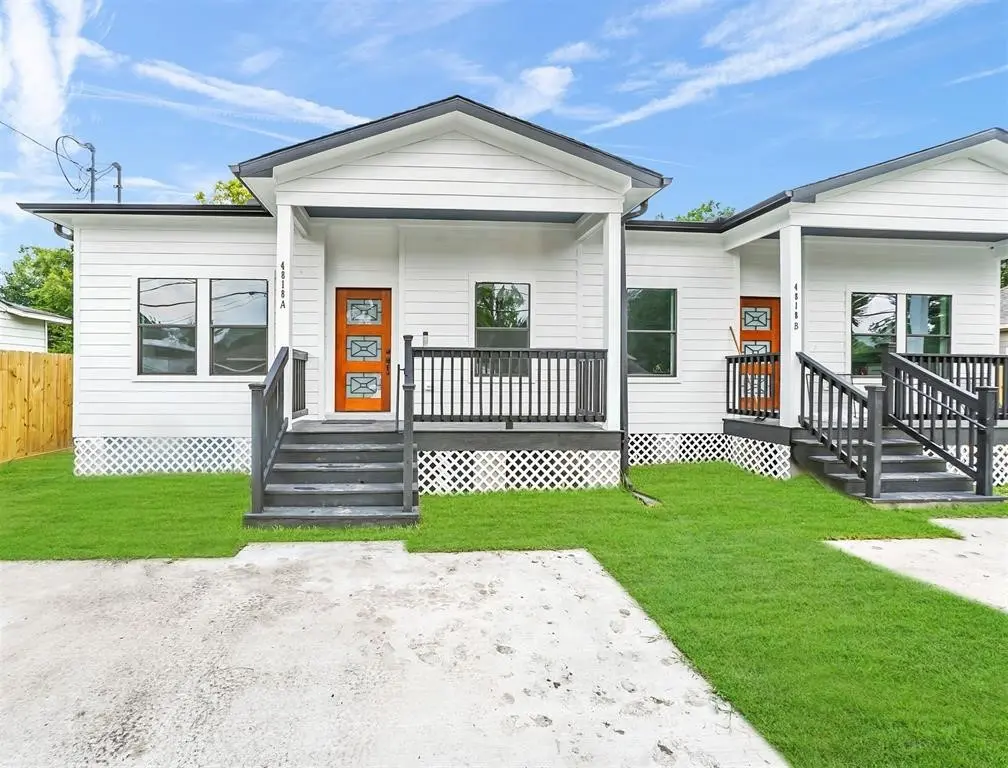
4818 Paula St · Houston, TX
Flood risk 3/10 · Minor
- FEMA flood zone
- X (shaded)
- Chance of flooding over 30 yrs
- 0.1%
- Est. flood insurance / yr
- $507 – $1,088
Fire risk 1/10 · Minimal
- Est. fire insurance / yr
- $1,222 – $2,270
Heat risk 9/10 · Severe
- Hot days now (above 109°F)
- 7 days/yr
- Hot days in 30 yrs
- 23 days/yr
Wind risk 9/10 · Severe
- Chance of severe wind over 30 yrs
- 99.0%
Air-quality risk 2/10 · Minimal
- Unhealthy air days now
- 2 days/yr
- Unhealthy air days in 30 yrs
- 2 days/yr
Risk factors via First Street. Map © Google.
Why this score? — see what drove the C- grade
The composite is a weighted blend of 9 inputs, each scored 0–100. Each bar is that input's sub-score; the figure is the points it added to the 100-point composite (weight × sub-score).
- ARV discount +15.0/15.0
- Cash flow +13.3/30.0
- Condition / age +4.8/5.0
- DSCR +4.0/10.0
- Rent growth +3.9/5.0
- 1% rule +3.8/10.0
- Livability +3.7/5.0
- Schools +2.7/10.0
- Appreciation +0.0/10.0
$414,000
🖨 Deal sheet 📄 Offer letter ✓ Due diligence
Multi-family units
County records classify this as Multi-Family (2-4 Unit). Listing-text estimate: 1 unit. estimate disagrees with records
Listing remarks MLS
Are you ready to start investing in the future? Here's a great place to start and get landlord experience. Two 3-bedrooms, 2-baths units that feature modern comforts including separate tubs and showers in Primary Baths, open living/dining/kitchen areas, self-closing kitchen cabinets, high ceilings, recessed lighting. and more. Traditional front porch/deck for that early morning cup of coffee. Short commute times to Medical Center, downtown, Pearland or Clear Lake. Private backyard for entertaining. Unit A is vacant. Unit B was leased May 11, 2026, for one year at $1,650.00 per month.
Key facts
- 7,068 sq ft lot
- Built 2021
- Listed 80 days
Neighborhood map
What this means for you Summary
Snapshot
- This is a 3-bed/2.0-bath multifamily listed at $414k. Condition is rated excellent.
Deal economics
- At list price, monthly cash flow is $2 ($23/yr) — positive.
- The deal already cash-flows at list — no discount required.
- To meet the 1% rule (rent ≥ 1% of price), the offer needs to be $362k (12.5% below list).
- Recommended offer: $362k (12.5% below list) — sets the bar for 1% rule.
- Cap rate 6.3% vs local median 3.2% in Houston — top-decile yield for the area; either an underpriced asset or a hidden risk that comps aren't pricing in. Stress-test before assuming the spread holds.
Location & tenants
- Location reads 74/100 on livability (#184 in TX, #4,771 nationally) — a middle-class / working-renter tenant base. Strengths: amenities A+, cost of living A+, housing A+; Watch: schools D, crime F.
- Houston ISD (urban): math 27% / reading 35% proficiency, ranked #593 of 826 in TX (top 72%) — families likely to look elsewhere, expect single-tenant / working-renter base with shorter leases; 71% free/reduced lunch — lower-income household profile, screen leases tightly.
- Market conditions: Rents rising fast (+5.5%/yr); 338 active listings in the ZIP; 16 comparable units currently listed for rent nearby; rentals lingering (median 44d on market — plan ~5-8 weeks vacancy on turnover, expect pricing pressure); 50% of comp listings sitting > 30 days — soft ceiling on asking rent; lower-income renter base — watch delinquency; 29,883 units permitted in Harris County in 2024 (8,621 in 5+ unit buildings).
- At $3,624/mo this rent would consume 114% of the median local household income ($38k/yr) (locally 1728% of renters already pay >50% of income on rent) — very limited rent-growth headroom before tenants either downsize or default.
Forward outlook
- Local home prices are declining (-3.0%/yr); year-one equity from $3k of loan paydown is wiped out by about $12k of value loss. Plan a longer hold.
- Harris County population projected at +47% by 2050 — long-run rental-demand tailwind backs the buy-and-hold thesis.
Negotiation context
- It's been on market 81 days — a 6% lower offer ($389k) is reasonable based on typical stale-listing flexibility.
- 2 sale attempts since 6y ago with the ask held roughly flat each time — persistent listings suggest the price (not the market) is what's stuck; bring a comps-based counter.
Risks & watch-outs
- Climate carrying-cost: severe wind risk, 99% chance of damaging wind over 30y; extreme-heat days projected 7→23/yr by 2055 (HVAC capex compounding) — expect insurance premiums to compound above CPI over the hold.
Questions for the listing agent
- It's been on market 81 days. Have you received any prior offers? Is the seller open to a 12% concession, seller financing, or rate buy-down credit?
- Why hasn't it sold? Are there any deal-killer items the seller is aware of (foundation, flood, title, zoning, code violations)?
- Is there a deadline driving the sale (1031 exchange, divorce, estate, relocation)? That informs how much negotiation room exists.
- Schools are D-rated, which usually means shorter tenancies and higher turnover. Who's the typical renter profile here, and what's been the actual vacancy rate?
- Crime grade is F in this area — have there been break-ins, vandalism, or insurance claims at this property in the last 3 years? What carrier currently insures it and at what premium?
- What's the average days-on-market for RENTAL listings here right now (not sales)? A rising rental-DOM trend means longer vacancies and softer asking-rent achievability than the comps imply.
- What's the recent tenant-quality profile in this submarket — average credit score on applications, eviction rate, late-payment / NSF rate, and stable-employment percentage? A property-management company in the area should have these aggregated.
- How much new apartment / multifamily construction is in the pipeline within 1–3 miles? Heavy new supply (>2% of stock underway) typically softens rents 12–24 months out; light construction supports rent growth.
Investment metrics
- 1% rule
- 0.88% ✗
- Cap rate
- 6.30%
- Cash-on-cash
- 0.02%
- DSCR
- 1.00
- GRM
- 9.5
CMA / ARV
- ARV (median comp)
- $496,147
- List price
- $414,000
- Delta
- -16.56%
- Verdict
- UNDERPRICED
- Comps
- 20 within 1.0 mi
Show comp detail 12 sales within ~0.75 mi
| Address | Dist | Beds/Ba | Sqft | Sold | Price | $/sf | Match |
|---|---|---|---|---|---|---|---|
| 4902 Higgins St Unit A and B | 0.08mi | 3/2.0 | 2,559 (+4%) | 10mo | $514,900 | $201 | 81 |
| 4834 Higgins St Unit A and B | 0.06mi | 3/4.0 | 2,559 (+4%) | 10mo | $514,900 | $201 | 74 |
| 4606 Mallow St | 0.52mi | 3/2.0 | 2,442 (-1%) | 1mo | $429,000 | $176 | 73 |
| 4533 Larkspur St Unit A/B | 0.64mi | 3/2.0 | 2,450 (-0%) | 6mo | $500,000 | $204 | 65 |
| 4754 Sunbeam St Unit A/B | 0.36mi | 3/2.0 | 2,600 (+6%) | 11mo | $470,000 | $181 | 64 |
| 4739 Reed Rd | 0.29mi | 2/3.0 (-1) | 2,604 (+6%) | 5mo | $513,000 | $197 | 64 |
| 9032 Jutland Rd | 0.43mi | 4/2.0 (+1) | 2,616 (+6%) | 5mo | $355,000 | $136 | 60 |
| 4710 Mallow St Unit A/B | 0.37mi | 2/2.0 (-1) | 2,102 (-14%) | 1mo | $450,000 | $214 | 52 |
| 5009 Mallow St Unit A/B | 0.41mi | 4/4.0 (+1) | 2,584 (+5%) | 10mo | $285,000 | $110 | 51 |
| 4710 Mallow St Unit E/F | 0.37mi | 2/2.0 (-1) | 2,102 (-14%) | 4mo | $440,000 | $209 | 50 |
| 4710 Mallow St Unit C/D | 0.37mi | 2/2.0 (-1) | 2,102 (-14%) | 7mo | $425,500 | $202 | 48 |
| 4358 Clover St | 0.73mi | 3/2.0 | 2,663 (+8%) | 10mo | $479,900 | $180 | 44 |
Match score weights: distance 35% · size 25% · config 20% · recency 20%. Top-matched comps best support the ARV.
Projected returns pro-forma
-3.0% appreciation · 5.45% rent growth · sell at horizon
- IRR
- -13.6%
- Equity multiple
- 0.50×
- Total profit
- $-57,758
- Equity at exit
- $61,729
- IRR
- -1.2%
- Equity multiple
- 0.91×
- Total profit
- $-10,428
- Equity at exit
- $35,795
Cash invested: $115,920 (down + closing). Projections, not guarantees.
Landlord ↔ Tenant lean methodology
- Overall (STATE)
- 87 Strongly Landlord-Friendly
- State Texas
- 87 Strongly Landlord-Friendly · R+5
- County
- — inherits STATE
- City
- — inherits STATE
ZIP-level market 77033
- Home prices YoY
- -16.3%
- Rents YoY
- 5.5%
- Active inventory
- 338
- Price-to-rent
- 19.0×
Monthly cashflow live
- Estimated rent
- $3,624 high interval (Pro) →
- Mortgage (P&I)
- −$2,171
- Tax est. 1.5%
- −$518 /mo · $6,210/yr
- Insurance
- −$172
- HOA
- −$0
- Vacancy / Maint / Mgmt
- −$761
- Net cashflow
- $2
Break-even live
2-unit breakdown (identical units grouped — click to expand)
| Units | Beds | Baths | Est. rent |
|---|---|---|---|
| 2× units | 3 | 1 | $3,624 |
| #1 | 3 | 1 | $1,812 |
| #2 | 3 | 1 | $1,812 |
| Total (2 units) | $3,624 | ||
UW: 25.0% down · 7.5% · 30yr · 1.5% tax · 5.0% vac · 8.0% maint · 8.0% mgmt
Financing live
Cash to close
- Down payment
- $103,500
- Closing costs
- $12,420
- Reserves months
- —
- Total cash needed
- —
Loan-product check · same deal, 3 products live
Conventional
25% down · 7.5% · 30yr
- Down + closing
- —
- Monthly P&I
- —
- Monthly cashflow
- —
- DSCR
- —
- Eligible?
- —
Personal DTI + credit; lowest rate.
DSCR
20% down · 8.5% · 30yr
- Down + closing
- —
- Monthly P&I
- —
- Monthly cashflow
- —
- DSCR
- —
- Eligible?
- —
No personal income docs; deal must DSCR.
Hard money
10% down · 12.0% · 12mo
- Down + closing
- —
- Monthly P&I
- —
- Monthly cashflow
- —
- DSCR
- —
- Eligible?
- —
Short-term bridge; refi at stabilization.
Rent comps 16 comps
| Address | Beds | Baths | Sqft | Rent | $/sqft | DOM | Units | Dist |
|---|---|---|---|---|---|---|---|---|
| 4921a Pederson St Unit A Houston, TX | 3.0 | 2.0 | 1765 | $2,150 | $1.22 | 13d | 1 | 0.17mi |
| 5012 Higgins St Unit B Houston, TX | 3.0 | 2.5 | 1611 | $1,650 | $1.02 | 24d | 1 | 0.25mi |
| 4538 Clover St Houston, TX | 4.0 | 2.0 | 1768 | $1,595 | $0.90 | 44d | 1 | 0.55mi |
| 10217 Teneha Dr Houston, TX | 4.0 | 3.0 | 3292 | $2,100 | $0.64 | 44d | 1 | 0.71mi |
| 4514 Galesburg St Unit B Houston, TX | 3.0 | 2.5 | 1680 | $3,500 | $2.08 | 24d | 1 | 0.87mi |
| 3710 Rockingham St Houston, TX | 3.0 | 2.0 | 1890 | $1,700 | $0.90 | 44d | 1 | 1.04mi |
| 4835 Sunflower St Unit 1546466P Houston, TX | 3.0 | 2.0 | 1883 | $4,516 | $2.40 | 15d | 1 | 1.04mi |
| 4406 Sterling St Houston, TX | 3.0 | 2.5 | 1840 | $1,999 | $1.09 | 17d | 1 | 1.10mi |
| 5726 Waterford Dr Houston, TX | 3.0 | 2.0 | 2000 | $1,850 | $0.93 | 11d | 1 | 1.14mi |
| 4601 White Rock St Unit A Houston, TX | 3.0 | 2.5 | 1700 | $2,500 | $1.47 | 44d | 1 | 1.18mi |
| 5458 Osprey Dr Houston, TX | 3.0 | 2.0 | 1614 | $1,595 | $0.99 | 21d | 1 | 1.21mi |
| 9606 Ashville Dr Unit B Houston, TX | 3.0 | 2.0 | 1610 | $1,570 | $0.98 | 44d | 1 | 1.23mi |
| 4613 Bricker St Unit B Houston, TX | 3.0 | 2.5 | 1600 | $2,300 | $1.44 | 44d | 1 | 1.25mi |
| 5201 Kenilwood Dr Unit B Houston, TX | 3.0 | 2.0 | 2442 | $1,725 | $0.71 | 14d | 1 | 1.33mi |
| 7710 Darnay Dr Houston, TX | 3.0 | 3.0 | 1635 | $2,095 | $1.28 | 44d | 1 | 1.33mi |
| 5314 Longmeadow St Houston, TX | 3.0 | 3.0 | 1646 | $1,900 | $1.15 | 44d | 1 | 1.41mi |
Listing history 13 events
-
2026-06-18days on market $414,000 Active 81 DOM
-
2026-06-18days on market $414,000 Active 80 DOM
-
2026-06-13days on market $414,000 Active 79 DOM
-
2026-06-10days on market $414,000 Active 75 DOM
-
2026-06-08days on market $414,000 Active 74 DOM
-
2026-06-07days on market $414,000 Active 73 DOM
-
2026-06-04days on market $414,000 Active 70 DOM
-
2026-06-01remarks 641-char remark
-
2026-06-01pricedays on market $414,000 Active 67 DOM
-
2026-05-31days on market $415,000 Active 66 DOM
-
2026-03-26$415,000 Active 597-char remark
Show marketing remark (597 chars)
Are you ready to start investing in the future? Here's a great place to start and get landlord experience. Two 3-bedrooms, 2-baths units that feature modern comforts including separate tubs and showers in Primary Baths, open living/dining/kitchen areas, self-closing kitchen cabinets, high ceilings, recessed lighting. and more. Traditional front porch/deck for that early morning cup of coffee. Short commute times to Medical Center, downtown, Pearland or Clear Lake. Private backyard for entertaining. Unit A is vacant. Unit B was leased May 11, 2026, for one year at $1,650.00 per month.
-
2020-07-18historical
-
2020-03-21$45,000 Active
ⓘ Source: listings_history table (triggers on properties + properties_extension) + one-shot
backfill from property_details.listing_events for pre-trigger history.
Climate risk First Street
- Flood 3/10 Moderate FEMA zone X (shaded) · 10% chance over 30 yrs
- Wildfire 1/10 Low
- Heat 9/10 Extreme 7 d/yr ≥109°F today · 23 d/yr by 30 yrs out
- Wind 9/10 Extreme 99% chance of damaging wind over 30 yrs
- Air quality 2/10 Low 2 unhealthy d/yr today · 2 by 30 yrs out
Nearby sold comps map
Loading sold comps map…
Walkable amenities ~0.75 mi
Loading nearby amenities…
Taxation est. · year 1
- Rental income
- $43,488
- − Mortgage interest
- −$23,190
- − Property taxes
- −$6,210
- − Insurance
- −$2,070
- − Repairs & maintenance
- −$3,479
- − Management
- −$3,479
- − Depreciation
- −$12,044
- Taxable loss
- −$6,984
- Est. tax savings @ 24.0%
- +$1,676
- After-tax cash flow
- $1,699/yr
For passive investors: Depreciation is non-cash, so a rental often shows a tax loss while cash-flowing — sheltering income. Rental losses are passive: they offset passive income freely, and up to $25,000/yr can offset ordinary (W-2) income if you actively participate and your MAGI is under $100k (phasing out to $0 by $150k); unused losses carry forward. On sale, claimed depreciation is recaptured at up to 25%, and gains may owe capital-gains tax (a 1031 exchange can defer both). Figures are a year-1 estimate at your 24.0% rate — not tax advice; consult a CPA.
Condition & rehab AI · 14 photos
This multi-family property is in excellent condition with modern amenities and a well-maintained exterior. Minor updates to the exterior and interior paint could further enhance its appeal.
Value-add opportunities
- Both Painting the exterior and interior walls — Fresh paint can enhance curb appeal and interior aesthetics, attracting more potential buyers or renters.
- Both Landscaping improvements — Well-maintained landscaping can improve the home's curb appeal and add value for both resale and rental.
Renovation cost estimate screening
Value-add ROI direction
- Both Painting the exterior and interior walls — Fresh paint can enhance curb appeal and interior aesthetics, attracting more potential buyers or renters. ↑
- Both Landscaping improvements — Well-maintained landscaping can improve the home's curb appeal and add value for both resale and rental. ↑
ⓘ Cost ranges are severity-bucket heuristics (US national rule-of-thumb). Get contractor quotes + a written scope before underwriting a rehab budget.
Schools (NCES district)
- District
- Houston ISD
- NCES district ID
- 4823640
- Math proficiency
- 27% ▼ -18.00%
- Reading proficiency
- 35% ▼ -6.00%
- Median HH income
- $46,054
- Composite
- 26.63/100
- National rank
- #7173
- State rank
- #593 of 826 in TX
Livability — Houston
- Score
- 74/100
- State rank
- #184
- US rank
- #4771
Category grades
Schools grade is shown separately in the Schools card above.
Census & demographics
- Census place
- Houston, TX
- County
- Harris County · 4,702,590 people
- City population
- 3,226,434
- Metro
- Houston-The Woodlands-Sugar Land, TX
- Population (ZIP)
- 29,154
- Household income
- $38,071
- Rent vs Own
- Severe rent burden
- 1728.0
Population outlook (Harris County) Hauer SSP2
- Today (2025)
- 5,571,493 people
- By 2030
- 6,089,821 · +9.3%
- By 2040
- 7,142,806 · +28.2%
- By 2050
- 8,185,864 · +46.9%
- By 2075
- 10,574,329 · +89.8%
- By 2100
- 12,109,958 · +117.4%
Race, ethnicity, and origin ACS 2023
- Neighborhood character
- Majority Black (55%)
- Race & ethnicity
- Black 55% Hispanic / Latino 43% Two or more races 17% Native American 1%
- Hispanic origin (detail)
- Mexican 35%
- Common ancestry
- Lithuanian 1%
- Foreign-born
- 18% · Canada
- Languages at home
- 61% English-only · Spanish 39%
Political lean MEDSL · Harris
- 2024 margin
- Lean D (+5.5) · D 52.0% · R 46.4% · Other 1.6%
- 2008→2024 swing
- +3.9pp toward D · 2008: 1.6pp · 2024: 5.5pp
- All cycles
- 2024: D+5.5 2020: D+13.3 2016: D+12.4 2012: D+0.1 2008: D+1.6
Not yet ingested
- Civics
- —
Market trends
- HPI YoY
- ▼ -41.49%
- Current HPI
- 212.6472
- Rent YoY
- ▲ 5.45%
- Metro
- Houston-The Woodlands-Sugar Land, TX
- State GDP YoY
- ▲ 3.95%
- F500 in state
- 110
Industry mix (Fortune 500 HQ in TX)
| Industry | F500 HQs | Revenue |
|---|---|---|
| Energy | 16 | $1,198B |
|
||
| Technology | 5 | $198B |
|
||
| Engineering / Construction | 4 | $72B |
|
||
| Energy Services | 3 | $60B |
|
||
| Utilities | 3 | $41B |
|
||
| Healthcare | 2 | $330B |
|
||
Price history
+822.2% since first listed3 events — show timeline
- 2026-03-26 Listed $415,000 HARMLS
- 2020-07-18 Listing Removed — HARMLS
- 2020-03-21 Listed $45,000 HARMLS
Cash-flow waterfall
monthlySold comps — $/sqft
last 12 mo · ≤1 miLoading sold comps…