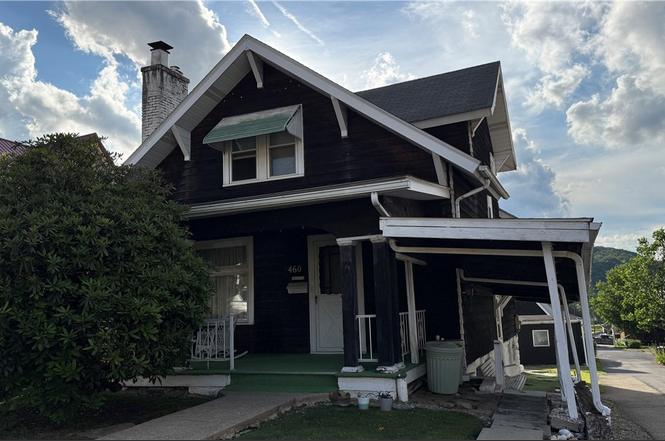
460 Morris St · Clymer, PA
Flood risk 1/10 · Minimal
- FEMA flood zone
- X (unshaded)
- Chance of flooding over 30 yrs
- 0.0%
- Est. flood insurance / yr
- $507 – $1,088
Fire risk 2/10 · Minimal
- Est. fire insurance / yr
- $511 – $949
Heat risk 4/10 · Minor
- Hot days now (above 94°F)
- 7 days/yr
- Hot days in 30 yrs
- 19 days/yr
Wind risk 2/10 · Minimal
- Chance of severe wind over 30 yrs
- —
Air-quality risk 3/10 · Minor
- Unhealthy air days now
- 2 days/yr
- Unhealthy air days in 30 yrs
- 4 days/yr
Risk factors via First Street. Map © Google.
Why this score? — see what drove the C grade
The composite is a weighted blend of 9 inputs, each scored 0–100. Each bar is that input's sub-score; the figure is the points it added to the 100-point composite (weight × sub-score).
- Cash flow +20.3/30.0
- ARV discount +7.5/15.0
- Appreciation +7.3/10.0
- DSCR +6.4/10.0
- 1% rule +6.2/10.0
- Livability +3.4/5.0
- Schools +3.0/10.0
- Rent growth +2.5/5.0
- Condition / age +2.5/5.0
$119,000
🖨 Deal sheet (PDF) 📄 Offer letter ✓ Due diligence
Listing remarks
Welcome to this spacious 3 bedroom, 1.5 bath home situated on an oversized corner lot that stretches from one street to the next, offering plenty of space to hang out. This well built home features original hardwood floors even under much of the carpeting thru-out, ready to be restored to their full glory. Step inside to find a warm and inviting living room highlighted by a cozy wood burning fireplace for relaxing on chilly evenings. The main level also offers a family room, dining room, kitchen and a versatile office or den that can easily serve as a home workspace, playroom or additional sitting area. Upstairs, you'll find 3 comfortable bedrooms and a full bath. The partially finished bas
Key facts
- Oversized corner lot
- 7,405 sq ft lot
- Garage
Tags
Property features AI
Exterior
- Parking: Detached garage; Total of 2 parking spaces
- Utilities: Public water; Public sewer
- Home design: Resale property
- Construction: Composition roof
- Exterior features: Private in-ground pool; 49 x 150 lot
Interior
- Kitchen: Refrigerator; Stove; Some gas appliances
- Bedrooms: Upper level bedrooms (two listed) plus an additional bedroom on the upper level
- Flooring: Carpet; Hardwood; Vinyl
- Bathrooms: 1 full bathroom; 1 half bathroom
- Heating & cooling: Gas hot water heating
- Interior features: Partially finished basement; Wood-burning fireplace
- Laundry & utility: Main basement laundry room
Neighborhood map
What this means for you Summary
Snapshot
- This is a 3-bed/1.0-bath single-family listed at $119k.
Deal economics
- At list price, monthly cash flow is $152 ($2k/yr) — positive.
- The deal already cash-flows at list — no discount required.
- Meets the 1% rule at list price ($1k rent vs $119k).
Location & tenants
- Location reads 67/100 on livability (#966 in PA) — a middle-class / working-renter tenant base. Strengths: crime A+, cost of living A+, housing A+; Watch: amenities F, commute F, employment F.
- Penns Manor Area SD (rural): math 24% / reading 47% proficiency, ranked #410 of 539 in PA (top 76%) — families likely to look elsewhere, expect single-tenant / working-renter base with shorter leases.
- Zoned schools: Penns Manor Area El Sch (math 27% / reading 57%, grade F, #883 of 1,518 statewide, top 61%, 332 students, 59% FRL); Penns Manor Area Jshs (math 24% / reading 42%, grade F, #329 of 437 statewide, top 75%, 391 students, 51% FRL) — zoned schools average 55% FRL vs 40% district-wide (15 pts higher); higher-poverty schools than district average — tighter screening recommended.
- Market conditions: 13 active listings in the ZIP; 44 units permitted in Indiana County in 2024 (0 in 5+ unit buildings).
Forward outlook
- In year one you build about $6k of equity ($823 loan paydown + $6k appreciation (4.7% local appreciation)).
- Indiana County population projected at -18% by 2050 — secular population decline; favor cash flow + early exit over multi-decade hold.
- At projected returns (4.7% appreciation + 3.0% rent growth), your $33k cash investment doubles in ~4 years — after that, you're playing with house money.
- By year 6, paydown + projected appreciation supports a ~$34k cash-out refi (75% LTV) — recoverable capital for the next deal without selling this one.
Negotiation context
- Only 5 days on market — expect competitive offers; lowballing is unlikely to land.
Risks & watch-outs
- Watch-outs: built in 1930 — expect roof / HVAC / electrical / plumbing capex.
Questions for the listing agent
- Built in 1930 — when were the roof, HVAC, electrical panel, plumbing, and water heater last replaced?
- Is there a deadline driving the sale (1031 exchange, divorce, estate, relocation)? That informs how much negotiation room exists.
- Schools are D-rated, which usually means shorter tenancies and higher turnover. Who's the typical renter profile here, and what's been the actual vacancy rate?
- What's the average days-on-market for RENTAL listings here right now (not sales)? A rising rental-DOM trend means longer vacancies and softer asking-rent achievability than the comps imply.
- What's the recent tenant-quality profile in this submarket — average credit score on applications, eviction rate, late-payment / NSF rate, and stable-employment percentage? A property-management company in the area should have these aggregated.
- How much new for-sale + rental construction is in the pipeline within 1–3 miles? Heavy new supply typically softens prices + rents 12–24 months out; constrained supply supports both.
Investment metrics
- 1% rule
- 1.12% ✓
- Cap rate
- 7.82%
- Cash-on-cash
- 5.47%
- DSCR
- 1.24
- GRM
- 7.4
CMA / ARV
- ARV (on-the-fly)
- $247,940
- Comps found
- 2
Show comp detail 2 sales within ~0.75 mi
| Address | Dist | Beds/Ba | Sqft | Sold | Price | $/sf | Match |
|---|---|---|---|---|---|---|---|
| 570 Hancock St | 0.11mi | 3/2.5 | 2,230 (-12%) | 5mo | $217,500 | $98 | 65 |
| 330 Walcott St | 0.19mi | 3/3.0 | 2,424 (-4%) | 24mo | $220,950 | $91 | 57 |
Match score weights: distance 35% · size 25% · config 20% · recency 20%. Top-matched comps best support the ARV.
Projected returns pro-forma
4.69% appreciation · 3.0% rent growth · sell at horizon
- IRR
- 16.8%
- Equity multiple
- 2.05×
- Total profit
- $35,068
- Equity at exit
- $65,205
- IRR
- 17.3%
- Equity multiple
- 3.97×
- Total profit
- $98,840
- Equity at exit
- $110,732
Cash invested: $33,320 (down + closing). Projections, not guarantees.
Landlord ↔ Tenant lean methodology
- Overall (STATE)
- 62 Landlord-Friendly
- State Pennsylvania
- 62 Landlord-Friendly · EVEN
- County
- — inherits STATE
- City
- — inherits STATE
ZIP-level market 15728
- Home prices YoY
- 3.6%
- Active inventory
- 13
- Price-to-rent
- 7.4×
Monthly cashflow live
- Estimated rent
- $1,337 medium interval (Pro) →
- Mortgage (P&I)
- −$624
- Tax from tax record
- −$231 /mo · $2,773/yr
- Insurance
- −$50
- HOA
- −$0
- Vacancy / Maint / Mgmt
- −$281
- Net cashflow
- $152
Break-even live
Sensitivity live
| Price | -10% $219 | -5% $185 | +0% $152 | +5% $118 | +10% $84 |
|---|---|---|---|---|---|
| Rent | -10% $46 | -5% $99 | +0% $152 | +5% $205 | +10% $257 |
| Rate | -1.0pp $212 | -0.5pp $182 | base $152 | +0.5pp $121 | +1.0pp $90 |
UW: 25.0% down · 7.5% · 30yr · 1.5% tax · 5.0% vac · 8.0% maint · 8.0% mgmt
Financing live
Cash to close
- Down payment
- $29,750
- Closing costs
- $3,570
- Reserves months
- —
- Total cash needed
- —
Loan-product check · same deal, 3 products live
Conventional
25% down · 7.5% · 30yr
- Down + closing
- —
- Monthly P&I
- —
- Monthly cashflow
- —
- DSCR
- —
- Eligible?
- —
Personal DTI + credit; lowest rate.
DSCR
20% down · 8.5% · 30yr
- Down + closing
- —
- Monthly P&I
- —
- Monthly cashflow
- —
- DSCR
- —
- Eligible?
- —
No personal income docs; deal must DSCR.
Hard money
10% down · 12.0% · 12mo
- Down + closing
- —
- Monthly P&I
- —
- Monthly cashflow
- —
- DSCR
- —
- Eligible?
- —
Short-term bridge; refi at stabilization.
Listing history 6 events
-
2026-06-19days on market $119,000 Active 5 DOM
-
2026-06-18days on market $119,000 Active 4 DOM
-
2026-06-17days on market $119,000 Active 3 DOM
-
2026-06-16days on market $119,000 Active 2 DOM
-
2026-06-15remarks 699-char remark
-
2026-06-15$119,000 Active 1 DOM
ⓘ Source: listings_history table (triggers on properties + properties_extension) + one-shot
backfill from property_details.listing_events for pre-trigger history.
Tax reassessment forecast PA · Partial reset (capped growth)
- Current annual tax
- $2,773 · $231/mo
- Projected year-2 tax
- $2,773 · $231/mo
- Expected delta
- $0/yr ($0/mo · 0.0%)
ⓘ Screening estimate from a state-policy table — verify with the county assessor before closing.
Climate risk First Street
- Flood 1/10 Low FEMA zone X (unshaded) · 0% chance over 30 yrs
- Wildfire 2/10 Low
- Heat 4/10 Moderate 7 d/yr ≥94°F today · 19 d/yr by 30 yrs out
- Wind 2/10 Low
- Air quality 3/10 Moderate 2 unhealthy d/yr today · 4 by 30 yrs out
Nearby sold comps map
Loading sold comps map…
Walkable amenities ~0.75 mi
Loading nearby amenities…
Taxation est. · year 1
- Rental income
- $16,048
- − Mortgage interest
- −$6,666
- − Property taxes
- −$2,773
- − Insurance
- −$595
- − Repairs & maintenance
- −$1,284
- − Management
- −$1,284
- − Depreciation
- −$3,462
- Taxable loss
- −$15
- Est. tax savings @ 24.0%
- +$4
- After-tax cash flow
- $1,825/yr
For passive investors: Depreciation is non-cash, so a rental often shows a tax loss while cash-flowing — sheltering income. Rental losses are passive: they offset passive income freely, and up to $25,000/yr can offset ordinary (W-2) income if you actively participate and your MAGI is under $100k (phasing out to $0 by $150k); unused losses carry forward. On sale, claimed depreciation is recaptured at up to 25%, and gains may owe capital-gains tax (a 1031 exchange can defer both). Figures are a year-1 estimate at your 24.0% rate — not tax advice; consult a CPA.
Schools (NCES district)
- District
- Penns Manor Area SD
- NCES district ID
- 4218780
- Math proficiency
- 24% ▼ -16.00%
- Reading proficiency
- 47% ▼ -9.00%
- Median HH income
- $46,434
- Composite
- 30.33/100
- National rank
- #6271
- State rank
- #410 of 539 in PA
Livability — Clymer
- Score
- 67/100
- State rank
- #966
- US rank
- #10555
Category grades
Schools grade is shown separately in the Schools card above.
Census & demographics
- Census place
- Clymer, PA
- Population (ZIP)
- 3,468
Population outlook (Indiana County) Hauer SSP2
- Today (2025)
- 84,294 people
- By 2030
- 81,773 · -3.0%
- By 2040
- 75,213 · -10.8%
- By 2050
- 69,348 · -17.7%
- By 2075
- 57,951 · -31.3%
- By 2100
- 47,313 · -43.9%
Race, ethnicity, and origin ACS 2023
- Neighborhood character
- Predominantly White (96%)
- Race & ethnicity
- White 96% Two or more races 3%
- Common ancestry
- Polish 5% Romanian 3% Iranian 2%
- Foreign-born
- 1% · Canada
- Languages at home
- 96% English-only · German/W. Germanic 3% Spanish 1%
Political lean MEDSL · Indiana
- 2024 margin
- Solid R (+39.1) · D 30.1% · R 69.2%
- 2008→2024 swing
- -32.0pp toward R · 2008: -7.1pp · 2024: -39.1pp
- All cycles
- 2024: R+39.1 2020: R+37.5 2016: R+35.6 2012: R+18.8 2008: R+7.1
Not yet ingested
- Civics
- —
Market trends
- HPI YoY
- ▲ 4.69%
- Current HPI
- 133.5535
- Rent YoY
- —
- Metro
- —
- State GDP YoY
- ▲ 1.68%
- F500 in state
- 34
Industry mix (Fortune 500 HQ in PA)
| Industry | F500 HQs | Revenue |
|---|---|---|
| Healthcare | 2 | $309B |
|
||
| Insurance | 2 | $27B |
|
||
| Telecommunications / Media | 1 | $124B |
|
||
| Industrial Distribution | 1 | $22B |
|
||
| Financial Services | 1 | $20B |
|
||
| Chemicals / Materials | 1 | $18B |
|
||
Price history
1 event — show timeline
- 2026-06-12 Listed $119,000 West Penn MLS
Property tax history
+3.2%/yrLatest (2026): $2,773 · +3.4% YoY. Source: county tax records.
Cash-flow waterfall
monthlySold comps — $/sqft
last 12 mo · ≤1 miLoading sold comps…