 Duplex
1119 Comstock Ave · Columbia, TN
Flood risk 1/10 · Minimal
- FEMA flood zone
- X (unshaded)
- Chance of flooding over 30 yrs
- 0.0%
- Est. flood insurance / yr
- $507 – $1,088
Fire risk 3/10 · Minor
- Est. fire insurance / yr
- $949 – $1,763
Heat risk 6/10 · Moderate
- Hot days now (above 106°F)
- 7 days/yr
- Hot days in 30 yrs
- 19 days/yr
Wind risk 4/10 · Minor
- Chance of severe wind over 30 yrs
- 14.0%
Air-quality risk 1/10 · Minimal
- Unhealthy air days now
- 0 days/yr
- Unhealthy air days in 30 yrs
- 0 days/yr
Risk factors via First Street. Map © Google.
Why this score? — see what drove the B- grade
The composite is a weighted blend of 9 inputs, each scored 0–100. Each bar is that input's sub-score; the figure is the points it added to the 100-point composite (weight × sub-score).
- Cash flow +30.0/30.0
- DSCR +10.0/10.0
- 1% rule +9.6/10.0
- ARV discount +8.0/15.0
- Rent growth +3.7/5.0
- Livability +3.2/5.0
- Condition / age +2.5/5.0
- Schools +1.8/10.0
- Appreciation +0.0/10.0
$166,000
🖨 Deal sheet 📄 Offer letter ✓ Due diligence
Multi-family units
County records classify this as Multi-Family (2-4 Unit). Listing-text estimate: 2 units. confirmed
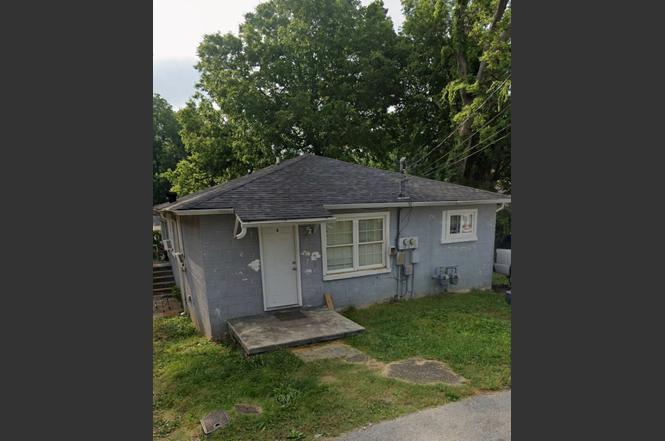
Listing remarks
Great investment opportunity! Property is a Duplex 3 bed, 1 bath, and a 2 bed, 1 bath. 1119A and 1119B to be sold together. Window units : 2 in front unit and 1 in back unit. Plumbing has pvc pipes and there have been no issues. The roof was replaced in 2025 with a metal roof. Electrical was replaced several years ago. Has 2 separate breakers;
Key facts
- Separate breakers
- Window units
- Metal roof
Tags
Property features AI
Finance
- Other: Property type: Residential income; Zoning: Commercial; Total units: 2; Total living area reported: 1,512 (assessor)
- Financial info: Gross income reported: $2,100; Net operating income reported: $1,500; Owner pays: Other; Tenant pays: Other; Annual tax amount: $885
Exterior
- Parking: No covered spaces reported; No designated parking total reported
- Security: Smoke detector(s)
- Utilities: Public water; Public sewer
- Home design: Duplex (attached property); One story
- Construction: Frame construction; Metal roof
- Exterior features: Lot dimensions approximately 50 x 100; Water available
Interior
- Bedrooms: One 3-bedroom unit; One 2-bedroom unit
- Flooring: Laminate
- Bathrooms: Each unit has 1 bathroom
- Heating & cooling: Wall furnace; Wall/window unit(s) for cooling
- Interior features: Laminate flooring; Wall furnace heating; Wall/window air conditioning units; Smoke detector(s)
Neighborhood map
What this means for you Summary
Snapshot
- This is a 2 × 2-bed/1.0-bath units multifamily listed at $166k.
Deal economics
- At list price, monthly cash flow is $904 ($11k/yr) — positive. Per door: $452/mo.
- The deal already cash-flows at list — no discount required.
- Meets the 1% rule at list price ($2k rent vs $166k).
- Cap rate 12.8% vs local median 2.8% in Columbia — top-decile yield for the area; either an underpriced asset or a hidden risk that comps aren't pricing in. Stress-test before assuming the spread holds.
Location & tenants
- Location reads 63/100 on livability (#207 in TN) — a middle-class / working-renter tenant base. Strengths: cost of living A+, housing A+; Watch: employment C-, health & safety C-, crime F.
- Maury County (town): math 19% / reading 21% proficiency, ranked #108 of 139 in TN (top 78%) — low school quality limits family demand, transient renter base, plan for 1-2y turnover.
- Zoned schools: J. Brown Elementary (math 17% / reading 12%, grade F, #753 of 952 statewide, top 81%, 335 students, 0% FRL); Columbia Central High School (math 7% / reading 27%, grade F, #225 of 332 statewide, top 69%, 1,474 students, 0% FRL) — zoned schools average 0% FRL vs 48% district-wide (48 pts lower); this property's tenant base skews higher-income than the district average.
- Market conditions: Rents rising fast (+5.0%/yr); 1118 active listings in the ZIP; 12 comparable units currently listed for rent nearby; rentals lingering (median 44d on market — plan ~5-8 weeks vacancy on turnover, expect pricing pressure); 50% of comp listings sitting > 30 days — soft ceiling on asking rent; 1,650 units permitted in Maury County in 2024 (60 in 5+ unit buildings).
- This rent runs 43% of the median local income ($68k/yr) — at the standard rent-burdened threshold; future hikes will face affordability resistance.
Forward outlook
- Local home prices are declining (-3.0%/yr); year-one equity from $1k of loan paydown is wiped out by about $5k of value loss. Plan a longer hold.
- Maury County population projected at +34% by 2050 — long-run rental-demand tailwind backs the buy-and-hold thesis.
- At projected returns (-3.0% appreciation + 5.0% rent growth), your $46k cash investment doubles in ~5 years — after that, you're playing with house money.
Negotiation context
- Only 1 days on market — expect competitive offers; lowballing is unlikely to land.
- Current owner paid $40k; list at $166k implies a 315% gain — meaningful room to come down on a strong offer.
Risks & watch-outs
- Watch-outs: built in 1955 — expect roof / HVAC / electrical / plumbing capex.
- Climate carrying-cost: extreme-heat days projected 7→19/yr by 2055 (HVAC capex compounding) — expect insurance premiums to compound above CPI over the hold.
Questions for the listing agent
- Can we see the unit-by-unit rent roll, current vacancy, and any below-market leases? What's the average tenancy length?
- What capital expenditures (roof, boiler, parking lot, exteriors) have been made in the last 5 years, and what's planned in the next 2?
- Built in 1955 — when were the roof, HVAC, electrical panel, plumbing, and water heater last replaced?
- Is there a deadline driving the sale (1031 exchange, divorce, estate, relocation)? That informs how much negotiation room exists.
- Schools are F-rated, which usually means shorter tenancies and higher turnover. Who's the typical renter profile here, and what's been the actual vacancy rate?
- Crime grade is F in this area — have there been break-ins, vandalism, or insurance claims at this property in the last 3 years? What carrier currently insures it and at what premium?
- What's the average days-on-market for RENTAL listings here right now (not sales)? A rising rental-DOM trend means longer vacancies and softer asking-rent achievability than the comps imply.
- What's the recent tenant-quality profile in this submarket — average credit score on applications, eviction rate, late-payment / NSF rate, and stable-employment percentage? A property-management company in the area should have these aggregated.
- How much new apartment / multifamily construction is in the pipeline within 1–3 miles? Heavy new supply (>2% of stock underway) typically softens rents 12–24 months out; light construction supports rent growth.
Investment metrics
- 1% rule
- 1.46% ✓
- Cap rate
- 12.83%
- Cash-on-cash
- 23.34%
- DSCR
- 2.04
- GRM
- 5.7
CMA / ARV
- ARV (on-the-fly)
- $167,832
- Comps found
- 1
Show comp detail 1 sale within ~0.75 mi
| Address | Dist | Beds/Ba | Sqft | Sold | Price | $/sf | Match |
|---|---|---|---|---|---|---|---|
| 913 S High St | 0.51mi | 3/3.0 (-1) | 1,701 (+12%) | 3mo | $189,000 | $111 | 44 |
Match score weights: distance 35% · size 25% · config 20% · recency 20%. Top-matched comps best support the ARV.
Projected returns pro-forma
-3.0% appreciation · 4.97% rent growth · sell at horizon
- IRR
- 18.4%
- Equity multiple
- 1.76×
- Total profit
- $35,530
- Equity at exit
- $24,751
- IRR
- 28.1%
- Equity multiple
- 3.71×
- Total profit
- $125,838
- Equity at exit
- $14,353
Cash invested: $46,480 (down + closing). Projections, not guarantees.
Landlord ↔ Tenant lean methodology
- Overall (STATE)
- 87 Strongly Landlord-Friendly
- State Tennessee
- 87 Strongly Landlord-Friendly · R+13
- County
- — inherits STATE
- City
- — inherits STATE
ZIP-level market 38401
- Home prices YoY
- -22.7%
- Rents YoY
- 5.0%
- Active inventory
- 1118
- Price-to-rent
- 11.4×
Monthly cashflow live
- Estimated rent
- $2,427 high interval (Pro) →
- Mortgage (P&I)
- −$871
- Tax from tax record
- −$74 /mo · $885/yr
- Insurance
- −$69
- HOA
- −$0
- Vacancy / Maint / Mgmt
- −$510
- Net cashflow
- $904
Break-even live
2-unit breakdown (identical units grouped — click to expand)
| Units | Beds | Baths | Est. rent |
|---|---|---|---|
| 2× units | 2 | 1 | $2,428 |
| #1 | 2 | 1 | $1,214 |
| #2 | 2 | 1 | $1,214 |
| Total (2 units) | $2,427 | ||
UW: 25.0% down · 7.5% · 30yr · 1.5% tax · 5.0% vac · 8.0% maint · 8.0% mgmt
Financing live
Cash to close
- Down payment
- $41,500
- Closing costs
- $4,980
- Reserves months
- —
- Total cash needed
- —
Loan-product check · same deal, 3 products live
Conventional
25% down · 7.5% · 30yr
- Down + closing
- —
- Monthly P&I
- —
- Monthly cashflow
- —
- DSCR
- —
- Eligible?
- —
Personal DTI + credit; lowest rate.
DSCR
20% down · 8.5% · 30yr
- Down + closing
- —
- Monthly P&I
- —
- Monthly cashflow
- —
- DSCR
- —
- Eligible?
- —
No personal income docs; deal must DSCR.
Hard money
10% down · 12.0% · 12mo
- Down + closing
- —
- Monthly P&I
- —
- Monthly cashflow
- —
- DSCR
- —
- Eligible?
- —
Short-term bridge; refi at stabilization.
Rent comps 12 comps
| Address | Beds | Baths | Sqft | Rent | $/sqft | DOM | Units | Dist |
|---|---|---|---|---|---|---|---|---|
| 505 Washington St Columbia, TN | 3.0 | 2.0 | 1241 | $1,950 | $1.57 | 44d | 1 | 0.18mi |
| 107 E 9th St Unit D-7 Columbia, TN | 3.0 | 3.5 | 2060 | $2,550 | $1.24 | 17d | 1 | 0.32mi |
| 915 Mapleash Ave Columbia, TN | 4.0 | 2.0 | 1308 | $1,995 | $1.53 | 44d | 1 | 0.37mi |
| 908 Mapleash Ave Columbia, TN | 3.0 | 2.0 | 1112 | $1,750 | $1.57 | 17d | 1 | 0.39mi |
| 329 E 18th St Columbia, TN | 3.0 | 3.0 | 1720 | $1,795 | $1.04 | 44d | 1 | 0.61mi |
| 615 N High St Unit B Columbia, TN | 3.0 | 2.5 | 1200 | $1,300 | $1.08 | 24d | 1 | 0.73mi |
| 100 Stonebridge Way Columbia, TN | 2.0–3.0 | 2.0 | 1067 | $1,485 | $1.39 | 2d | 4 | 0.83mi |
| 202 3rd Ave Columbia, TN | 3.0 | 1.5 | 1600 | $2,000 | $1.25 | 3d | 1 | 0.92mi |
| 405 Fleming St Columbia, TN | 3.0 | 2.0 | 1470 | $1,700 | $1.16 | 44d | 1 | 1.15mi |
| 1923 Woodmont Dr Columbia, TN | 3.0 | 1.0 | 1222 | $1,700 | $1.39 | 24d | 1 | 1.27mi |
| 600 Hallmark Dr Columbia, TN | 3.0 | 2.0 | 1138 | $1,479 | $1.30 | 44d | 3 | 1.28mi |
| 326 Seaton Way Columbia, TN | 3.0 | 2.5 | 1601 | $1,800 | $1.12 | 44d | 1 | 1.49mi |
Listing history 2 events
-
2026-06-18remarks 345-char remark
-
2026-06-18$166,000 Active 1 DOM
ⓘ Source: listings_history table (triggers on properties + properties_extension) + one-shot
backfill from property_details.listing_events for pre-trigger history.
Tax reassessment forecast TN · Resets to sale price
- Current annual tax
- $885 · $74/mo
- Projected year-2 tax
- $1,179 · $98/mo
- Expected delta
- +$294/yr (+$24/mo · 33.2%)
ⓘ Screening estimate from a state-policy table — verify with the county assessor before closing.
Climate risk First Street
- Flood 1/10 Low FEMA zone X (unshaded) · 0% chance over 30 yrs
- Wildfire 3/10 Moderate
- Heat 6/10 Major 7 d/yr ≥106°F today · 19 d/yr by 30 yrs out
- Wind 4/10 Moderate 14% chance of damaging wind over 30 yrs
- Air quality 1/10 Low 0 unhealthy d/yr today · 0 by 30 yrs out
Nearby sold comps map
Loading sold comps map…
Walkable amenities ~0.75 mi
Loading nearby amenities…
Taxation est. · year 1
- Rental income
- $29,124
- − Mortgage interest
- −$9,299
- − Property taxes
- −$885
- − Insurance
- −$830
- − Repairs & maintenance
- −$2,330
- − Management
- −$2,330
- − Depreciation
- −$4,829
- Taxable income
- $8,621
- Est. tax owed @ 24.0%
- −$2,069
- After-tax cash flow
- $8,778/yr
For passive investors: Depreciation is non-cash, so a rental often shows a tax loss while cash-flowing — sheltering income. Rental losses are passive: they offset passive income freely, and up to $25,000/yr can offset ordinary (W-2) income if you actively participate and your MAGI is under $100k (phasing out to $0 by $150k); unused losses carry forward. On sale, claimed depreciation is recaptured at up to 25%, and gains may owe capital-gains tax (a 1031 exchange can defer both). Figures are a year-1 estimate at your 24.0% rate — not tax advice; consult a CPA.
Schools (NCES district)
- District
- Maury County
- NCES district ID
- 4702760
- Math proficiency
- 19% ▼ -5.00%
- Reading proficiency
- 21% ▼ -4.00%
- Median HH income
- $47,668
- Composite
- 17.69/100
- National rank
- #9024
- State rank
- #108 of 139 in TN
Livability — Columbia
- Score
- 63/100
- State rank
- #207
- US rank
- #16090
Category grades
Schools grade is shown separately in the Schools card above.
Census & demographics
- Census place
- Columbia, TN
- County
- Maury County · 121,382 people
- City population
- 67,482
- Metro
- Nashville-Davidson--Murfreesboro--Franklin, TN
- Population (ZIP)
- 67,482
- Household income
- $68,475
- Rent vs Own
- Severe rent burden
- 2026.0
Population outlook (Maury County) Hauer SSP2
- Today (2025)
- 102,894 people
- By 2030
- 110,269 · +7.2%
- By 2040
- 124,426 · +20.9%
- By 2050
- 137,543 · +33.7%
- By 2075
- 167,438 · +62.7%
- By 2100
- 184,489 · +79.3%
Race, ethnicity, and origin ACS 2023
- Neighborhood character
- Predominantly White (74%)
- Race & ethnicity
- White 74% Black 12% Hispanic / Latino 9% Two or more races 7%
- Hispanic origin (detail)
- Mexican 7%
- Common ancestry
- Slovak 1% Serbian 1% Romanian 1%
- Foreign-born
- 4% · Canada
- Languages at home
- 94% English-only · Spanish 5%
Political lean MEDSL · Maury
- 2024 margin
- Solid R (+44.6) · D 27.1% · R 71.8% · Other 1.1%
- 2008→2024 swing
- -6.2pp toward R · 2008: -38.4pp · 2024: -44.6pp
- All cycles
- 2024: R+44.6 2020: R+36.5 2016: R+39.2 2012: R+26.9 2008: R+38.4
Not yet ingested
- Civics
- —
Market trends
- HPI YoY
- ▼ -100.75%
- Current HPI
- 343.0362
- Rent YoY
- ▲ 4.97%
- Metro
- Nashville-Davidson--Murfreesboro--Franklin, TN
- State GDP YoY
- ▲ 2.78%
- F500 in state
- 22
Industry mix (Fortune 500 HQ in TN)
| Industry | F500 HQs | Revenue |
|---|---|---|
| Healthcare | 3 | $91B |
|
||
| Retail | 3 | $72B |
|
||
| Transportation / Logistics | 1 | $88B |
|
||
| Paper / Packaging | 1 | $19B |
|
||
| Insurance | 1 | $13B |
|
||
| Energy | 1 | $12B |
|
||
Price history
+315.0% since first listed3 events — show timeline
- 2026-06-18 Listed $166,000 REALTRACS as Distributed by MLS Grid
- 2026-06-18 Coming Soon $166,000 REALTRACS as Distributed by MLS Grid
- 2016-03-23 Sold (Public Records) $40,000 Public Records
Property tax history
+6.9%/yrLatest (2025): $885 · +0.0% YoY. Source: county tax records.
Cash-flow waterfall
monthlySold comps — $/sqft
last 12 mo · ≤1 miLoading sold comps…