750 Sixflags Rd #394 · South Fulton, GA
Flood risk 1/10 · Minimal
- FEMA flood zone
- X (unshaded)
- Chance of flooding over 30 yrs
- 0.0%
- Est. flood insurance / yr
- $507 – $1,088
Fire risk 3/10 · Minor
- Est. fire insurance / yr
- $963 – $1,789
Heat risk 5/10 · Moderate
- Hot days now (above 103°F)
- 7 days/yr
- Hot days in 30 yrs
- 18 days/yr
Wind risk 4/10 · Minor
- Chance of severe wind over 30 yrs
- 23.0%
Air-quality risk 4/10 · Minor
- Unhealthy air days now
- 4 days/yr
- Unhealthy air days in 30 yrs
- 5 days/yr
Risk factors via First Street. Map © Google.
Why this score? — see what drove the B- grade
The composite is a weighted blend of 9 inputs, each scored 0–100. Each bar is that input's sub-score; the figure is the points it added to the 100-point composite (weight × sub-score).
- Cash flow +30.0/30.0
- 1% rule +10.0/10.0
- DSCR +10.0/10.0
- ARV discount +7.5/15.0
- Schools +3.8/10.0
- Condition / age +2.8/5.0
- Rent growth +2.7/5.0
- Livability +2.5/5.0
- Appreciation +0.0/10.0
$53,400
🖨 Deal sheet (PDF) 📄 Offer letter ✓ Due diligence
Listing remarks MLS
* THIS IS A RESALE LISTING * You'll love living in this 3 bedroom, 2 bathroom home within a wonderful family-friendly community. Check out the awesome amenities your community has to offer such as a clubhouse, a soccer field, a basketball court, and more! This home won't be on the market long, so call us today for more information or to schedule a tour. Deposits & Fees are subject to change.
Key facts
- Clubhouse
- Soccer field
- Basketball court
Tags
Neighborhood map
What this means for you Summary
Snapshot
- This is a 3-bed/2.0-bath manufactured listed at $53k. Condition is rated average.
Deal economics
- At list price, monthly cash flow is $1k ($15k/yr) — positive.
- The deal already cash-flows at list — no discount required.
- Meets the 1% rule at list price ($2k rent vs $53k).
- Recommended offer: $50k (6.0% below list) — sets the bar for market timing.
- Cap rate 34.5% vs local median 4.6% in South Fulton — top-decile yield for the area; either an underpriced asset or a hidden risk that comps aren't pricing in. Stress-test before assuming the spread holds.
Location & tenants
- Location reads: area grade B — affects rentability + tenant quality, not the cash-flow math above.
- Cobb County (suburban): math 39% / reading 45% proficiency, ranked #25 of 174 in GA (top 14%) — families likely to look elsewhere, expect single-tenant / working-renter base with shorter leases.
- Zoned schools: City View Elementary School (math 10% / reading 13%, grade F, #1,069 of 1,228 statewide, top 87%, 883 students, 91% FRL); Lindley Middle School (math 15% / reading 22%, grade F, #372 of 470 statewide, top 80%, 1,096 students, 82% FRL); Pebblebrook High School (math 23% / reading 30%, grade F, #171 of 424 statewide, top 41%, 2,511 students, 70% FRL) — zoned schools average 81% FRL vs 39% district-wide (42 pts higher); higher-poverty schools than district average — tighter screening recommended.
- Zoned-school proficiency averages 19% at this address vs 42% district-wide (-23 pts) — the specific schools serving this property underperform the Cobb County average; the district grade overstates school quality for this exact location.
- Market conditions: Rents flat; 131 active listings in the ZIP; 1,625 units permitted in Cobb County in 2024 (389 in 5+ unit buildings).
- This rent runs 39% of the median local income ($64k/yr) — at the standard rent-burdened threshold; future hikes will face affordability resistance.
Forward outlook
- Local home prices are declining (-3.0%/yr); year-one equity from $369 of loan paydown is wiped out by about $2k of value loss. Plan a longer hold.
- Cobb County population projected at +33% by 2050 — long-run rental-demand tailwind backs the buy-and-hold thesis.
- At projected returns (-3.0% appreciation + 0.8% rent growth), your $15k cash investment doubles in ~2 years — after that, you're playing with house money.
Negotiation context
- It's been on market 69 days — a 6% lower offer ($50k) is reasonable based on typical stale-listing flexibility.
Risks & watch-outs
- Climate carrying-cost: extreme-heat days projected 7→18/yr by 2055 (HVAC capex compounding) — expect insurance premiums to compound above CPI over the hold.
Questions for the listing agent
- It's been on market 69 days. Have you received any prior offers? Is the seller open to a 6% concession, seller financing, or rate buy-down credit?
- Why hasn't it sold? Are there any deal-killer items the seller is aware of (foundation, flood, title, zoning, code violations)?
- Is there a deadline driving the sale (1031 exchange, divorce, estate, relocation)? That informs how much negotiation room exists.
- What's the average days-on-market for RENTAL listings here right now (not sales)? A rising rental-DOM trend means longer vacancies and softer asking-rent achievability than the comps imply.
- What's the recent tenant-quality profile in this submarket — average credit score on applications, eviction rate, late-payment / NSF rate, and stable-employment percentage? A property-management company in the area should have these aggregated.
- How much new for-sale + rental construction is in the pipeline within 1–3 miles? Heavy new supply typically softens prices + rents 12–24 months out; constrained supply supports both.
Investment metrics
- 1% rule
- 3.85% ✓
- Cap rate
- 34.52%
- Cash-on-cash
- 100.82%
- DSCR
- 5.49
- GRM
- 2.2
CMA / ARV
No comps found within radius.
Projected returns pro-forma
-3.0% appreciation · 0.77% rent growth · sell at horizon
- IRR
- 99.4%
- Equity multiple
- 5.47×
- Total profit
- $66,869
- Equity at exit
- $7,962
- IRR
- —
- Equity multiple
- 10.61×
- Total profit
- $143,657
- Equity at exit
- $4,617
Cash invested: $14,952 (down + closing). Projections, not guarantees.
Landlord ↔ Tenant lean methodology
- Overall (STATE)
- 90 Strongly Landlord-Friendly
- State Georgia
- 90 Strongly Landlord-Friendly · R+3
- County
- — inherits STATE
- City
- — inherits STATE
ZIP-level market 30168
- Home prices YoY
- -25.5%
- Rents YoY
- 0.8%
- Active inventory
- 131
- Price-to-rent
- 2.2×
Monthly cashflow live
- Estimated rent
- $2,057 medium interval (Pro) →
- Mortgage (P&I)
- −$280
- Tax est. 1.5%
- −$67 /mo · $801/yr
- Insurance
- −$22
- HOA
- −$0
- Vacancy / Maint / Mgmt
- −$432
- Net cashflow
- $1,256
Break-even live
Sensitivity live
| Price | -10% $1,293 | -5% $1,275 | +0% $1,256 | +5% $1,238 | +10% $1,219 |
|---|---|---|---|---|---|
| Rent | -10% $1,094 | -5% $1,175 | +0% $1,256 | +5% $1,337 | +10% $1,419 |
| Rate | -1.0pp $1,283 | -0.5pp $1,270 | base $1,256 | +0.5pp $1,242 | +1.0pp $1,228 |
UW: 25.0% down · 7.5% · 30yr · 1.5% tax · 5.0% vac · 8.0% maint · 8.0% mgmt
Financing live
Cash to close
- Down payment
- $13,350
- Closing costs
- $1,602
- Reserves months
- —
- Total cash needed
- —
Loan-product check · same deal, 3 products live
Conventional
25% down · 7.5% · 30yr
- Down + closing
- —
- Monthly P&I
- —
- Monthly cashflow
- —
- DSCR
- —
- Eligible?
- —
Personal DTI + credit; lowest rate.
DSCR
20% down · 8.5% · 30yr
- Down + closing
- —
- Monthly P&I
- —
- Monthly cashflow
- —
- DSCR
- —
- Eligible?
- —
No personal income docs; deal must DSCR.
Hard money
10% down · 12.0% · 12mo
- Down + closing
- —
- Monthly P&I
- —
- Monthly cashflow
- —
- DSCR
- —
- Eligible?
- —
Short-term bridge; refi at stabilization.
Listing history 16 events
-
2026-06-21days on market $53,400 Active 69 DOM
-
2026-06-18days on market $53,400 Active 66 DOM
-
2026-06-17days on market $53,400 Active 65 DOM
-
2026-06-16days on market $53,400 Active 64 DOM
-
2026-06-15days on market $53,400 Active 63 DOM
-
2026-06-13days on market $53,400 Active 61 DOM
-
2026-06-13days on market $53,400 Active 60 DOM
-
2026-06-09days on market $53,400 Active 57 DOM
-
2026-06-08days on market $53,400 Active 56 DOM
-
2026-06-07days on market $53,400 Active 55 DOM
-
2026-06-04days on market $53,400 Active 52 DOM
-
2026-06-03days on market $53,400 Active 51 DOM
-
2026-06-02days on market $53,400 Active 50 DOM
-
2026-06-01pricedays on market $53,400 Active 49 DOM
-
2026-05-31days on market $52,900 Active 48 DOM
-
2026-04-13$52,900 Active 403-char remark
Show marketing remark (403 chars)
* THIS IS A RESALE LISTING * You'll love living in this 3 bedroom, 2 bathroom home within a wonderful family-friendly community. Check out the awesome amenities your community has to offer such as a clubhouse, a soccer field, a basketball court, and more! This home won't be on the market long, so call us today for more information or to schedule a tour. Deposits & Fees are subject to change.
ⓘ Source: listings_history table (triggers on properties + properties_extension) + one-shot
backfill from property_details.listing_events for pre-trigger history.
Climate risk First Street
- Flood 1/10 Low FEMA zone X (unshaded) · 0% chance over 30 yrs
- Wildfire 3/10 Moderate
- Heat 5/10 Major 7 d/yr ≥103°F today · 18 d/yr by 30 yrs out
- Wind 4/10 Moderate 23% chance of damaging wind over 30 yrs
- Air quality 4/10 Moderate 4 unhealthy d/yr today · 5 by 30 yrs out
Nearby sold comps map
Loading sold comps map…
Walkable amenities ~0.75 mi
Loading nearby amenities…
Taxation est. · year 1
- Rental income
- $24,687
- − Mortgage interest
- −$2,991
- − Property taxes
- −$801
- − Insurance
- −$267
- − Repairs & maintenance
- −$1,975
- − Management
- −$1,975
- − Depreciation
- −$1,553
- Taxable income
- $15,124
- Est. tax owed @ 24.0%
- −$3,630
- After-tax cash flow
- $11,444/yr
For passive investors: Depreciation is non-cash, so a rental often shows a tax loss while cash-flowing — sheltering income. Rental losses are passive: they offset passive income freely, and up to $25,000/yr can offset ordinary (W-2) income if you actively participate and your MAGI is under $100k (phasing out to $0 by $150k); unused losses carry forward. On sale, claimed depreciation is recaptured at up to 25%, and gains may owe capital-gains tax (a 1031 exchange can defer both). Figures are a year-1 estimate at your 24.0% rate — not tax advice; consult a CPA.
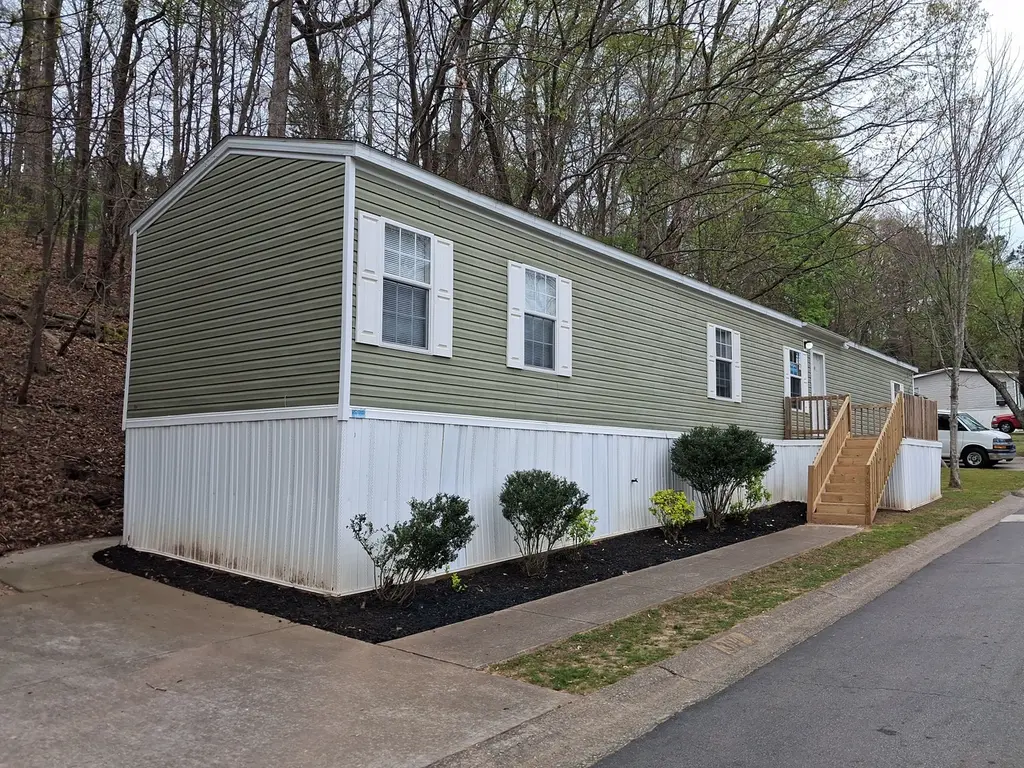
Condition & rehab AI · 1 photo
This 3-bedroom, 2-bathroom manufactured home is in average condition with some minor repairs needed. It has a good exterior and roof, and the interior could benefit from a fresh coat of paint. Landscaping could be trimmed for better curb appeal. The home is located in a family-friendly community with amenities, making it a good investment.
Repairs flagged
- Minor interior walls/paint — Some minor wear and tear on the interior walls and paint that could be touched up.
- Minor landscaping — Some minor overgrowth in the landscaping that could be trimmed and maintained.
Value-add opportunities
- Resale Paint the interior walls — Fresh paint can make the interior look new and appealing to potential buyers.
- Rental Trim the landscaping — Well-maintained landscaping can attract more renters and improve curb appeal.
Renovation cost estimate screening
| Repair item | Severity | Est. cost |
|---|---|---|
| interior walls/paint · Some minor wear and tear on the interior walls and paint that could be touched up. | Minor | $500–3,000 |
| landscaping · Some minor overgrowth in the landscaping that could be trimmed and maintained. | Minor | $500–3,000 |
| Total estimated repair cost · 2 items | $1,000–6,000 |
Value-add ROI direction
- Resale Paint the interior walls — Fresh paint can make the interior look new and appealing to potential buyers. ↑
- Rental Trim the landscaping — Well-maintained landscaping can attract more renters and improve curb appeal. ↑
ⓘ Cost ranges are severity-bucket heuristics (US national rule-of-thumb). Get contractor quotes + a written scope before underwriting a rehab budget.
Schools (NCES district)
- District
- Cobb County
- NCES district ID
- 1301290
- Math proficiency
- 39% ▼ -15.00%
- Reading proficiency
- 45% ▼ -10.00%
- Median HH income
- $68,845
- Composite
- 37.93/100
- National rank
- #4308
- State rank
- #25 of 174 in GA
Livability — South Fulton
No livability data for this city. (Only ~50 U.S. cities are tracked.)
Census & demographics
- County
- Cobb County · 777,758 people
- City population
- 127,674
- Metro
- Atlanta-Sandy Springs-Alpharetta, GA
- Population (ZIP)
- 26,612
- Household income
- $64,059
- Rent vs Own
- Severe rent burden
- 993.0
Population outlook (Cobb County) Hauer SSP2
- Today (2025)
- 868,385 people
- By 2030
- 929,614 · +7.1%
- By 2040
- 1,047,533 · +20.6%
- By 2050
- 1,155,537 · +33.1%
- By 2075
- 1,405,030 · +61.8%
- By 2100
- 1,555,058 · +79.1%
Race, ethnicity, and origin ACS 2023
- Neighborhood character
- Diverse neighborhood (Simpson 0.55)
- Race & ethnicity
- Black 63% Hispanic / Latino 21% White 10% Two or more races 9% Asian 1%
- Hispanic origin (detail)
- Mexican 13%
- Common ancestry
- Italian 4% Hispanic 1%
- Foreign-born
- 19% · Canada
- Languages at home
- 74% English-only · Spanish 20% French/Haitian/Cajun 1% Other Indo-European 1%
Political lean MEDSL · Cobb
- 2024 margin
- D (+14.9) · D 56.9% · R 42.0% · Other 1.1%
- 2008→2024 swing
- +24.3pp toward D · 2008: -9.4pp · 2024: 14.9pp
- All cycles
- 2024: D+14.9 2020: D+14.3 2016: D+2.1 2012: R+12.6 2008: R+9.4
Not yet ingested
- Civics
- —
Market trends
- HPI YoY
- ▼ -84.55%
- Current HPI
- 246.7995
- Rent YoY
- ▲ 0.77%
- Metro
- Atlanta-Sandy Springs-Alpharetta, GA
- State GDP YoY
- ▲ 2.66%
- F500 in state
- 28
Industry mix (Fortune 500 HQ in GA)
| Industry | F500 HQs | Revenue |
|---|---|---|
| Paper / Packaging | 2 | $29B |
|
||
| Retail | 1 | $160B |
|
||
| Transportation / Logistics | 1 | $91B |
|
||
| Airlines | 1 | $62B |
|
||
| Consumer Goods | 1 | $47B |
|
||
| Utilities | 1 | $25B |
|
||
Price history
1 event — show timeline
- 2026-04-13 Listed $52,900 Zillow
Cash-flow waterfall
monthlySold comps — $/sqft
last 12 mo · ≤1 miLoading sold comps…