 Triplex
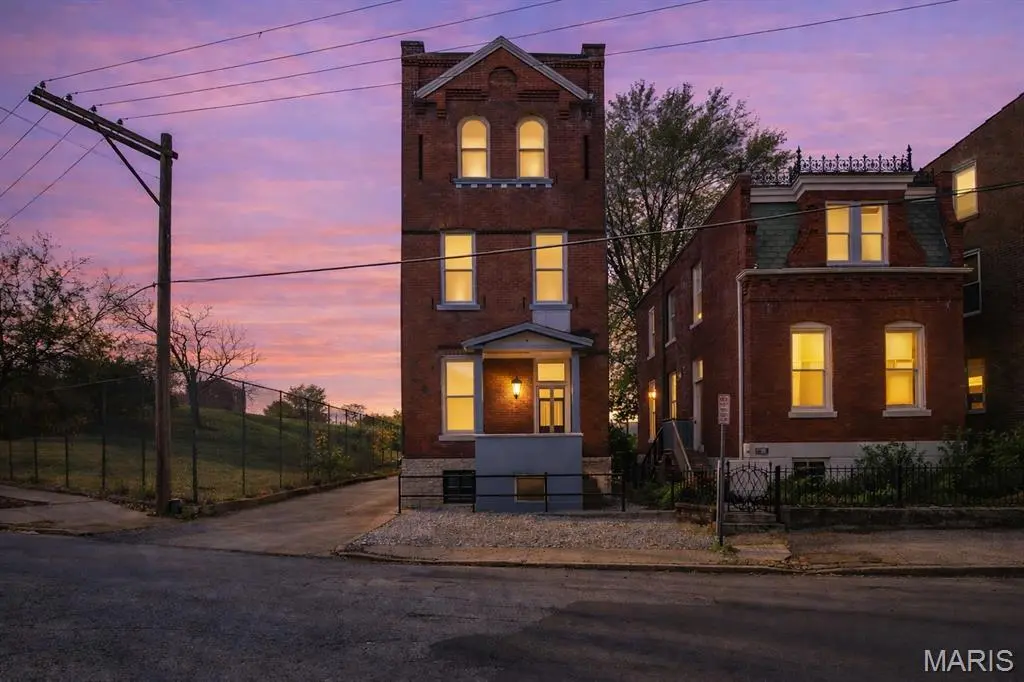
2519 S 9th St · St. Louis, MO
Flood risk 1/10 · Minimal
- FEMA flood zone
- X (unshaded)
- Chance of flooding over 30 yrs
- 0.0%
- Est. flood insurance / yr
- $473 – $860
Fire risk 1/10 · Minimal
- Est. fire insurance / yr
- $1,054 – $1,958
Heat risk 6/10 · Moderate
- Hot days now (above 109°F)
- 7 days/yr
- Hot days in 30 yrs
- 21 days/yr
Wind risk 2/10 · Minimal
- Chance of severe wind over 30 yrs
- 1.0%
Air-quality risk 3/10 · Minor
- Unhealthy air days now
- 3 days/yr
- Unhealthy air days in 30 yrs
- 4 days/yr
Risk factors via First Street. Map © Google.
Why this score? — see what drove the C+ grade
The composite is a weighted blend of 9 inputs, each scored 0–100. Each bar is that input's sub-score; the figure is the points it added to the 100-point composite (weight × sub-score).
- Cash flow +30.0/30.0
- 1% rule +10.0/10.0
- DSCR +10.0/10.0
- Rent growth +4.4/5.0
- Livability +2.5/5.0
- Condition / age +2.5/5.0
- Schools +1.2/10.0
- ARV discount +0.0/15.0
- Appreciation +0.0/10.0
$375,000
🖨 Deal sheet 📄 Offer letter ✓ Due diligence
Multi-family units
County records classify this as Multi-Family (2-4 Unit). Listing-text estimate: 3 units. confirmed
Listing remarks MLS
Well maintained 3 family in Historic Soulard. Central heat and air in all units. All units have tenants this is an income producing building. There are 2 off street parking spaces and one tenant parks on the street. The basement is only accessible from the exterior and the tenants do not have use of basement. Electric boxes are in each unit as well as the systems. Solid building with solid tenants. Great location in the Soulard with long term tenants. Each unit is 3 rooms with a bathroom, a laundry room not pictured. Non of the tenants have washer or dryers. All three rooms have ceiling fans. All bathrooms have a linen closet. Please check out all of the virtual tours with the elctronic floor plans and the 3D virtual tour you can see all aspects of the units.
Key facts
- 1,999 sq ft lot
- Built 1890
- Listed 8 days
Neighborhood map
What this means for you Summary
Snapshot
- This is a 3 × 3-bed/1.5-bath units multifamily listed at $375k.
Deal economics
- At list price, monthly cash flow is $2k ($26k/yr) — positive. Per door: $720/mo.
- The deal already cash-flows at list — no discount required.
- Meets the 1% rule at list price ($6k rent vs $375k).
- Cap rate 13.2% vs local median 5.0% in St. Louis — top-decile yield for the area; either an underpriced asset or a hidden risk that comps aren't pricing in. Stress-test before assuming the spread holds.
Location & tenants
- Location reads: area grade C — affects rentability + tenant quality, not the cash-flow math above.
- St. Louis City (urban): math 10% / reading 18% proficiency, ranked #312 of 324 in MO (top 96%) — low school quality limits family demand, transient renter base, plan for 1-2y turnover; 80% free/reduced lunch — lower-income household profile, screen leases tightly.
- Zoned schools: Sigel Elem. Comm. Ed. Ctr. (math 2% / reading 2%, grade F, #1,099 of 1,115 statewide, top 100%, 219 students, 99% FRL); Roosevelt High (math 2% / reading 8%, grade F, #517 of 521 statewide, top 100%, 460 students, 99% FRL) — zoned schools average 99% FRL vs 80% district-wide (18 pts higher); higher-poverty schools than district average — tighter screening recommended.
- Market conditions: Rents rising fast (+7.5%/yr); 165 active listings in the ZIP; 40 comparable units currently listed for rent nearby; rentals at typical pace (median 19d on market — plan ~3-4 weeks tenant-placement turnaround); 294 units permitted in St. Louis city in 2024 (227 in 5+ unit buildings).
- At $5,719/mo this rent would consume 100% of the median local household income ($69k/yr) (locally 1429% of renters already pay >50% of income on rent) — very limited rent-growth headroom before tenants either downsize or default.
Forward outlook
- Local home prices are declining (-3.0%/yr); year-one equity from $3k of loan paydown is wiped out by about $11k of value loss. Plan a longer hold.
- St. Louis County population projected to shrink 6% by 2050 — rents likely to lag national; underwrite the cash flow, not the appreciation.
- At projected returns (-3.0% appreciation + 7.5% rent growth), your $105k cash investment doubles in ~5 years — after that, you're playing with house money.
Negotiation context
- Only 8 days on market — expect competitive offers; lowballing is unlikely to land.
- 2 sale attempts since 5y ago with the ask held roughly flat each time — persistent listings suggest the price (not the market) is what's stuck; bring a comps-based counter.
- Current owner paid $92k; list at $375k implies a 308% gain — meaningful room to come down on a strong offer.
Risks & watch-outs
- Watch-outs: built in 1890 — expect roof / HVAC / electrical / plumbing capex.
- Climate carrying-cost: extreme-heat days projected 7→21/yr by 2055 (HVAC capex compounding) — expect insurance premiums to compound above CPI over the hold.
Questions for the listing agent
- Can we see the unit-by-unit rent roll, current vacancy, and any below-market leases? What's the average tenancy length?
- What capital expenditures (roof, boiler, parking lot, exteriors) have been made in the last 5 years, and what's planned in the next 2?
- Built in 1890 — when were the roof, HVAC, electrical panel, plumbing, and water heater last replaced?
- Is there a deadline driving the sale (1031 exchange, divorce, estate, relocation)? That informs how much negotiation room exists.
- What's the average days-on-market for RENTAL listings here right now (not sales)? A rising rental-DOM trend means longer vacancies and softer asking-rent achievability than the comps imply.
- What's the recent tenant-quality profile in this submarket — average credit score on applications, eviction rate, late-payment / NSF rate, and stable-employment percentage? A property-management company in the area should have these aggregated.
- How much new apartment / multifamily construction is in the pipeline within 1–3 miles? Heavy new supply (>2% of stock underway) typically softens rents 12–24 months out; light construction supports rent growth.
Investment metrics
- 1% rule
- 1.53% ✓
- Cap rate
- 13.20%
- Cash-on-cash
- 24.69%
- DSCR
- 2.10
- GRM
- 5.5
CMA / ARV
- ARV (on-the-fly)
- $279,072
- Comps found
- 9
Show comp detail 9 sales within ~0.75 mi
| Address | Dist | Beds/Ba | Sqft | Sold | Price | $/sf | Match |
|---|---|---|---|---|---|---|---|
| 2519 S 9th St | 0.00mi | —/— | 1,632 (0%) | 0mo | $375,000 | $230 | 100 |
| 1619 S 9th St | 0.73mi | 3/3.0 | 1,632 (0%) | 3mo | $284,900 | $175 | 59 |
| 2121 Victor St | 0.65mi | 4/4.0 | 1,656 (+2%) | 8mo | $219,900 | $133 | 52 |
| 2307 S 10th St | 0.23mi | 6/6.0 | 1,825 (+12%) | 2mo | $515,000 | $282 | 52 |
| 811 Russell Blvd | 0.40mi | 2/1.0 | 1,786 (+9%) | 14mo | $189,900 | $106 | 50 |
| 1953 Lynch St | 0.53mi | —/— | 1,696 (+4%) | 24mo | $250,000 | $147 | 49 |
| 2209 Menard St | 0.30mi | 6/6.0 | 1,448 (-11%) | 4mo | $270,000 | $186 | 48 |
| 2822 Lemp Ave | 0.47mi | 6/2.0 | 1,842 (+13%) | 15mo | $315,000 | $171 | 44 |
| 2619 Missouri Ave | 0.69mi | 4/4.0 | 1,856 (+14%) | 10mo | $149,900 | $81 | 28 |
Match score weights: distance 35% · size 25% · config 20% · recency 20%. Top-matched comps best support the ARV.
Projected returns pro-forma
-3.0% appreciation · 7.52% rent growth · sell at horizon
- IRR
- 22.9%
- Equity multiple
- 1.99×
- Total profit
- $103,939
- Equity at exit
- $55,914
- IRR
- 33.5%
- Equity multiple
- 4.71×
- Total profit
- $389,940
- Equity at exit
- $32,423
Cash invested: $105,000 (down + closing). Projections, not guarantees.
Landlord ↔ Tenant lean methodology
- Overall (STATE)
- 81 Strongly Landlord-Friendly
- State Missouri
- 81 Strongly Landlord-Friendly · R+10
- County
- — inherits STATE
- City
- — inherits STATE
ZIP-level market 63104
- Rents YoY
- 7.5%
- Active inventory
- 165
- Price-to-rent
- 16.4×
Monthly cashflow live
- Estimated rent
- $5,719 high interval (Pro) →
- Mortgage (P&I)
- −$1,967
- Tax from tax record
- −$235 /mo · $2,823/yr
- Insurance
- −$156
- HOA
- −$0
- Vacancy / Maint / Mgmt
- −$1,201
- Net cashflow
- $2,160
Break-even live
3-unit breakdown (identical units grouped — click to expand)
| Units | Beds | Baths | Est. rent |
|---|---|---|---|
| 3× units | 3 | 1.5 | $5,718 |
| #1 | 3 | 1.5 | $1,906 |
| #2 | 3 | 1.5 | $1,906 |
| #3 | 3 | 1.5 | $1,906 |
| Total (3 units) | $5,719 | ||
UW: 25.0% down · 7.5% · 30yr · 1.5% tax · 5.0% vac · 8.0% maint · 8.0% mgmt
Financing live
Cash to close
- Down payment
- $93,750
- Closing costs
- $11,250
- Reserves months
- —
- Total cash needed
- —
Loan-product check · same deal, 3 products live
Conventional
25% down · 7.5% · 30yr
- Down + closing
- —
- Monthly P&I
- —
- Monthly cashflow
- —
- DSCR
- —
- Eligible?
- —
Personal DTI + credit; lowest rate.
DSCR
20% down · 8.5% · 30yr
- Down + closing
- —
- Monthly P&I
- —
- Monthly cashflow
- —
- DSCR
- —
- Eligible?
- —
No personal income docs; deal must DSCR.
Hard money
10% down · 12.0% · 12mo
- Down + closing
- —
- Monthly P&I
- —
- Monthly cashflow
- —
- DSCR
- —
- Eligible?
- —
Short-term bridge; refi at stabilization.
Rent comps 40 comps
| Address | Beds | Baths | Sqft | Rent | $/sqft | DOM | Units | Dist |
|---|---|---|---|---|---|---|---|---|
| 2406 S 10th St Saint Louis, MO | 3.0 | 2.0 | 2000 | $1,950 | $0.97 | 23d | 1 | 0.05mi |
| 2424 S 9th St St. Louis, MO | 1.0–2.0 | 1.0–2.0 | 796 | $2,019 | $2.54 | 1d | 19 | 0.08mi |
| 713 Barton St Unit 1031874P St. Louis, MO | 3.0 | 2.0 | 1593 | $3,856 | $2.42 | 7d | 1 | 0.11mi |
| 2300 S 9th St Unit 23002-N St. Louis, MO | 3.0 | 2.0 | 1300 | $1,600 | $1.23 | 43d | 1 | 0.20mi |
| 2416 S 13th St St. Louis, MO | 2.0 | 1.0 | 1071 | $1,995 | $1.86 | 16d | 1 | 0.28mi |
| 1003 Ann Ave St. Louis, MO | 2.0 | 2.0 | 1785 | $1,950 | $1.09 | 17d | 1 | 0.29mi |
| 1233 Sidney St Saint Louis, MO | 2.0 | 2.5 | 1200 | $1,395 | $1.16 | 43d | 1 | 0.29mi |
| 900 Allen Ave Saint Louis, MO | 3.0 | 2.0 | 1676 | $2,399 | $1.43 | 17d | 1 | 0.40mi |
| 919 Allen Ave Unit R Saint Louis, MO | 3.0 | 1.5 | 1708 | $2,100 | $1.23 | 20d | 1 | 0.42mi |
| 2018 Ann Ave Unit 1F St. Louis, MO | 3.0 | 1.0 | 1300 | $1,450 | $1.12 | 43d | 1 | 0.61mi |
| 1708 S 8th St Unit 2nd St. Louis, MO | 2.0 | 1.5 | 1450 | $1,590 | $1.10 | 7d | 1 | 0.63mi |
| 1708 S 8th St Saint Louis, MO | 2.0 | 1.5 | 1450 | $1,590 | $1.10 | 7d | 1 | 0.63mi |
| 1917 Arsenal St Saint Louis, MO | 2.0 | 1.0 | 1239 | $1,250 | $1.01 | 19d | 1 | 0.64mi |
| 2005 Russell Blvd Saint Louis, MO | 2.0 | 1.0 | 1300 | $1,400 | $1.08 | 14d | 1 | 0.65mi |
| 1705A S 9th St St. Louis, MO | 2.0 | 1.5 | 1600 | $2,300 | $1.44 | 43d | 1 | 0.66mi |
| 1707a S 9th St St. Louis, MO | 2.0 | 1.5 | 1800 | $2,350 | $1.31 | 43d | 1 | 0.66mi |
| 1703A S 9th St St. Louis, MO | 2.0 | 1.5 | 1800 | $2,400 | $1.33 | 43d | 1 | 0.66mi |
| 2027 Russell Blvd Saint Louis, MO | 3.0 | 2.5 | 1687 | $2,100 | $1.24 | 19d | 1 | 0.69mi |
| 2027 Russell Blvd Saint Louis, MO | 3.0 | 2.5 | 1687 | $2,100 | $1.24 | 11d | 1 | 0.69mi |
| 2029 Russell Blvd Saint Louis, MO | 3.0 | 3.0 | 1500 | $1,900 | $1.27 | 43d | 1 | 0.69mi |
| 2219 McNair Ave Saint Louis, MO | 2.0 | 1.0 | 1336 | $1,335 | $1.00 | 43d | 1 | 0.70mi |
| 1708 S Tucker Blvd Apt C St. Louis, MO | 2.0 | 1.5 | 1400 | $1,195 | $0.85 | 11d | 1 | 0.72mi |
| 2209-2211 Jules St St. Louis, MO | 1.0 | 1.0 | 1050 | $900 | $0.86 | 23d | 1 | 0.76mi |
| 3319 S 18th St Saint Louis, MO | 2.0 | 1.5 | 1368 | $1,600 | $1.17 | 43d | 1 | 0.78mi |
| 1515 Lafayette Ave Saint Louis, MO | 2.0 | 2.0 | 1071 | $1,595 | $1.49 | 43d | 1 | 0.81mi |
| 1500 Menard St Saint Louis, MO | 1.0–2.0 | 1.0 | 1000 | $1,420 | $1.42 | 2d | 5 | 0.82mi |
| 2267 Indiana Ave Saint Louis, MO | 2.0 | 1.5 | 1900 | $2,195 | $1.16 | 2d | 1 | 0.83mi |
| 2263 Indiana Ave Unit A Saint Louis, MO | 2.0 | 1.0 | 1100 | $1,495 | $1.36 | 4d | 1 | 0.84mi |
| 2327 Texas Ave Apt 205 St. Louis, MO | 3.0 | 2.0 | 1375 | $2,095 | $1.52 | 17d | 1 | 0.94mi |
| 2327 Texas Ave Unit 211 St. Louis, MO | 3.0 | 2.0 | 1075 | $1,945 | $1.81 | 43d | 1 | 0.94mi |
| 2500 Ohio Ave St. Louis, MO | 1.0–2.0 | 1.0–2.0 | 845 | $1,895 | $2.24 | 1d | 19 | 0.96mi |
| 2636 Arsenal St St. Louis, MO | 2.0 | 1.0 | 1500 | $1,400 | $0.93 | 23d | 1 | 0.99mi |
| 2634 Arsenal St St. Louis, MO | 2.0 | 1.0 | 1500 | $1,400 | $0.93 | 23d | 1 | 0.99mi |
| 3450 Wisconsin Ave Saint Louis, MO | 1.0–3.0 | 1.0–2.0 | 1219 | $1,788 | $1.47 | 1d | 15 | 1.00mi |
| 2164 Lafayette Ave Saint Louis, MO | 2.0 | 2.0 | 1618 | $2,350 | $1.45 | 14d | 1 | 1.03mi |
| 2340 Lafayette Ave St. Louis, MO | 2.0 | 2.0 | 1275 | $1,710 | $1.34 | 1d | 1 | 1.10mi |
| 2239 California Ave Saint Louis, MO | 2.0 | 2.0 | 1182 | $1,750 | $1.48 | 17d | 1 | 1.14mi |
| 2664 Nebraska Ave Unit 2F Saint Louis, MO | 3.0 | 1.0 | 1350 | $1,150 | $0.85 | 23d | 1 | 1.20mi |
| 2826 Nebraska Ave Saint Louis, MO | 1.0 | 1.0 | 1235 | $1,045 | $0.85 | 7d | 1 | 1.20mi |
| 1720 Chouteau Ave #404 Saint Louis, MO | 2.0 | 2.0 | 1089 | $1,495 | $1.37 | 23d | 1 | 1.23mi |
Listing history 10 events
-
2026-04-10status Pending
-
2026-04-03$375,000 Active
-
2026-03-31historical $375,000
-
2021-07-30soldstatus Closed 781-char remark
Show marketing remark (781 chars)
Well maintained 3 family in Historic Soulard. Central heat and air in all units. All units have tenants this is an income producing building. There are 2 off street parking spaces and one tenant parks on the street. The basement is only accessible from the exterior and the tenants do not have use of basement. Electric boxes are in each unit as well as the systems. Solid building with solid tenants. Great location in the Soulard with long term tenants. Each unit is 3 rooms with a bathroom, a laundry room not pictured. Non of the tenants have washer or dryers. All three rooms have ceiling fans. All bathrooms have a linen closet. Please check out all of the virtual tours with the elctronic floor plans and the 3D virtual tour you can see all aspects of the units.
-
2021-07-15status Pending 781-char remark
Show marketing remark (781 chars)
Well maintained 3 family in Historic Soulard. Central heat and air in all units. All units have tenants this is an income producing building. There are 2 off street parking spaces and one tenant parks on the street. The basement is only accessible from the exterior and the tenants do not have use of basement. Electric boxes are in each unit as well as the systems. Solid building with solid tenants. Great location in the Soulard with long term tenants. Each unit is 3 rooms with a bathroom, a laundry room not pictured. Non of the tenants have washer or dryers. All three rooms have ceiling fans. All bathrooms have a linen closet. Please check out all of the virtual tours with the elctronic floor plans and the 3D virtual tour you can see all aspects of the units.
-
2021-07-09$250,000 Active 781-char remark
Show marketing remark (781 chars)
Well maintained 3 family in Historic Soulard. Central heat and air in all units. All units have tenants this is an income producing building. There are 2 off street parking spaces and one tenant parks on the street. The basement is only accessible from the exterior and the tenants do not have use of basement. Electric boxes are in each unit as well as the systems. Solid building with solid tenants. Great location in the Soulard with long term tenants. Each unit is 3 rooms with a bathroom, a laundry room not pictured. Non of the tenants have washer or dryers. All three rooms have ceiling fans. All bathrooms have a linen closet. Please check out all of the virtual tours with the elctronic floor plans and the 3D virtual tour you can see all aspects of the units.
-
2021-07-09historical $250,000 781-char remark
Show marketing remark (781 chars)
Well maintained 3 family in Historic Soulard. Central heat and air in all units. All units have tenants this is an income producing building. There are 2 off street parking spaces and one tenant parks on the street. The basement is only accessible from the exterior and the tenants do not have use of basement. Electric boxes are in each unit as well as the systems. Solid building with solid tenants. Great location in the Soulard with long term tenants. Each unit is 3 rooms with a bathroom, a laundry room not pictured. Non of the tenants have washer or dryers. All three rooms have ceiling fans. All bathrooms have a linen closet. Please check out all of the virtual tours with the elctronic floor plans and the 3D virtual tour you can see all aspects of the units.
-
2001-04-10soldstatus $92,000
-
1998-03-02soldstatus
-
1991-03-12soldstatus $10,000
ⓘ Source: listings_history table (triggers on properties + properties_extension) + one-shot
backfill from property_details.listing_events for pre-trigger history.
Tax reassessment forecast MO · Resets to sale price
- Current annual tax
- $2,823 · $235/mo
- Projected year-2 tax
- $3,638 · $303/mo
- Expected delta
- +$814/yr (+$68/mo · 28.9%)
ⓘ Screening estimate from a state-policy table — verify with the county assessor before closing.
Climate risk First Street
- Flood 1/10 Low FEMA zone X (unshaded) · 0% chance over 30 yrs
- Wildfire 1/10 Low
- Heat 6/10 Major 7 d/yr ≥109°F today · 21 d/yr by 30 yrs out
- Wind 2/10 Low 100% chance of damaging wind over 30 yrs
- Air quality 3/10 Moderate 3 unhealthy d/yr today · 4 by 30 yrs out
Nearby sold comps map
Loading sold comps map…
Walkable amenities ~0.75 mi
Loading nearby amenities…
Taxation est. · year 1
- Rental income
- $68,628
- − Mortgage interest
- −$21,006
- − Property taxes
- −$2,823
- − Insurance
- −$1,875
- − Repairs & maintenance
- −$5,490
- − Management
- −$5,490
- − Depreciation
- −$10,909
- Taxable income
- $21,035
- Est. tax owed @ 24.0%
- −$5,048
- After-tax cash flow
- $20,871/yr
For passive investors: Depreciation is non-cash, so a rental often shows a tax loss while cash-flowing — sheltering income. Rental losses are passive: they offset passive income freely, and up to $25,000/yr can offset ordinary (W-2) income if you actively participate and your MAGI is under $100k (phasing out to $0 by $150k); unused losses carry forward. On sale, claimed depreciation is recaptured at up to 25%, and gains may owe capital-gains tax (a 1031 exchange can defer both). Figures are a year-1 estimate at your 24.0% rate — not tax advice; consult a CPA.
Schools (NCES district)
- District
- St. Louis City
- NCES district ID
- 2929280
- Math proficiency
- 10% ▼ -6.00%
- Reading proficiency
- 18% ▼ -3.00%
- Median HH income
- $35,685
- Composite
- 11.54/100
- National rank
- #9699
- State rank
- #312 of 324 in MO
Livability — St. Louis
No livability data for this city. (Only ~50 U.S. cities are tracked.)
Census & demographics
- Census place
- St. Louis, MO
- County
- Saint Louis City · 254,015 people
- City population
- 283,259
- Metro
- St. Louis, MO-IL
- Population (ZIP)
- 19,007
- Household income
- $68,764
- Rent vs Own
- Severe rent burden
- 1429.0
Population outlook (St. Louis County) Hauer SSP2
- Today (2025)
- 315,737 people
- By 2030
- 313,865 · -0.6%
- By 2040
- 305,439 · -3.3%
- By 2050
- 296,529 · -6.1%
- By 2075
- 271,028 · -14.2%
- By 2100
- 255,359 · -19.1%
Race, ethnicity, and origin ACS 2023
- Neighborhood character
- Diverse neighborhood (Simpson 0.60)
- Race & ethnicity
- White 51% Black 37% Two or more races 6% Hispanic / Latino 4% Asian 2%
- Common ancestry
- Romanian 3% Lithuanian 3% Slovak 2%
- Foreign-born
- 5% · Canada
- Languages at home
- 93% English-only · Other Indo-European 2% Spanish 1% German/W. Germanic 1%
Political lean MEDSL · St. Louis
- 2024 margin
- Solid D (+64.7) · D 81.4% · R 16.7% · Other 2.0%
- 2008→2024 swing
- -3.5pp toward R · 2008: 68.2pp · 2024: 64.7pp
- All cycles
- 2024: D+64.7 2020: D+66.2 2016: D+63.7 2012: D+66.6 2008: D+68.2
Not yet ingested
- Civics
- —
Market trends
- HPI YoY
- ▼ -159.69%
- Current HPI
- 252.3452
- Rent YoY
- ▲ 7.52%
- Metro
- St. Louis, MO-IL
- State GDP YoY
- ▲ 1.84%
- F500 in state
- 20
Industry mix (Fortune 500 HQ in MO)
| Industry | F500 HQs | Revenue |
|---|---|---|
| Healthcare | 1 | $163B |
|
||
| Insurance | 1 | $21B |
|
||
| Industrial Technology | 1 | $17B |
|
||
| Retail | 1 | $16B |
|
||
| Industrial Distribution | 1 | $10B |
|
||
| Utilities | 1 | $9B |
|
||
Price history
+3650.0% since first listed10 events — show timeline
- 2026-04-10 Pending — MARIS as Distributed by MLS Grid
- 2026-04-03 Listed $375,000 MARIS as Distributed by MLS Grid
- 2026-03-31 Coming Soon $375,000 MARIS as Distributed by MLS Grid
- 2021-07-30 Sold (MLS) — MARIS as Distributed by MLS Grid
- 2021-07-15 Pending — MARIS as Distributed by MLS Grid
- 2021-07-09 Listed $250,000 MARIS as Distributed by MLS Grid
- 2021-07-09 Coming Soon $250,000 MARIS as Distributed by MLS Grid
- 2001-04-10 Sold (Public Records) $92,000 Public Records
- 1998-03-02 Sold (Public Records) — Public Records
- 1991-03-12 Sold (Public Records) $10,000 Public Records
Property tax history
+4.7%/yrLatest (2024): $2,823 · +5.1% YoY. Source: county tax records.
Cash-flow waterfall
monthlySold comps — $/sqft
last 12 mo · ≤1 miLoading sold comps…