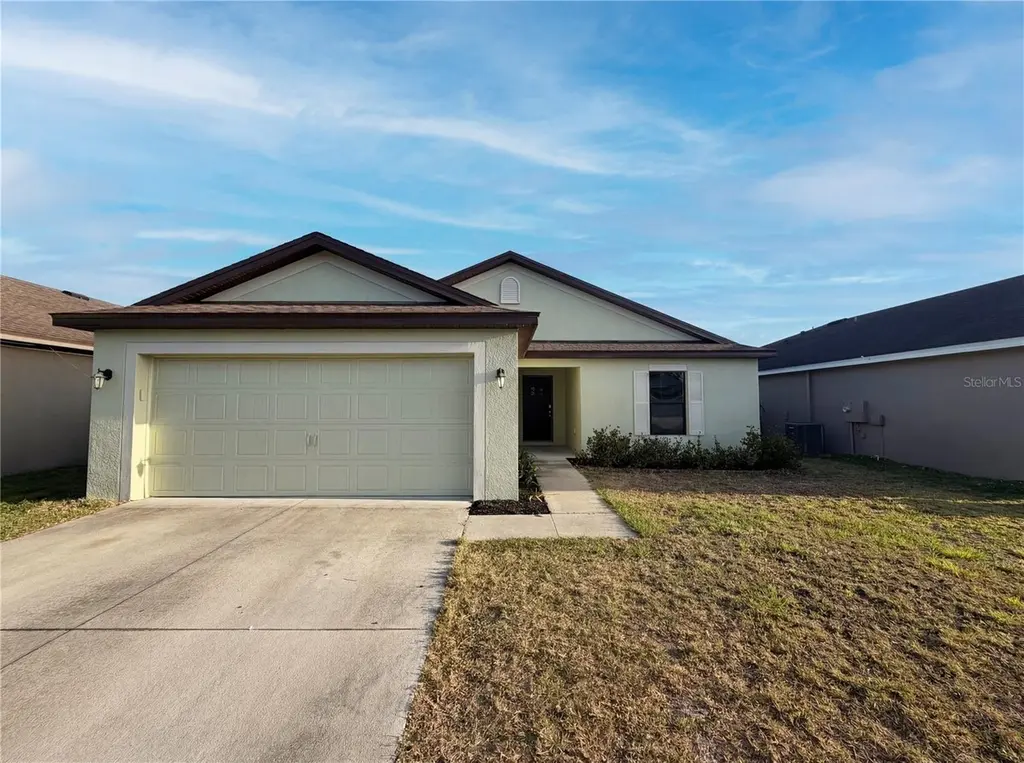
2359 Bexley Dr · Tavares, FL
Flood risk 1/10 · Minimal
- FEMA flood zone
- X (unshaded)
- Chance of flooding over 30 yrs
- 0.0%
- Est. flood insurance / yr
- $507 – $1,088
Fire risk 1/10 · Minimal
- Est. fire insurance / yr
- $947 – $1,759
Heat risk 9/10 · Severe
- Hot days now (above 108°F)
- 7 days/yr
- Hot days in 30 yrs
- 23 days/yr
Wind risk 9/10 · Severe
- Chance of severe wind over 30 yrs
- 99.0%
Air-quality risk 2/10 · Minimal
- Unhealthy air days now
- 1 days/yr
- Unhealthy air days in 30 yrs
- 1 days/yr
Risk factors via First Street. Map © Google.
Why this score? — see what drove the D+ grade
The composite is a weighted blend of 9 inputs, each scored 0–100. Each bar is that input's sub-score; the figure is the points it added to the 100-point composite (weight × sub-score).
- ARV discount +15.0/15.0
- Cash flow +11.5/30.0
- Schools +4.2/10.0
- Livability +3.8/5.0
- Rent growth +3.5/5.0
- DSCR +3.4/10.0
- 1% rule +2.9/10.0
- Condition / age +2.5/5.0
- Appreciation +0.0/10.0
$283,000
🖨 Deal sheet (PDF) 📄 Offer letter ✓ Due diligence
Listing remarks MLS
Under construction. The Bokeelia floor plan by LGI Homes is located in the beautiful community of Chelsea Oaks South. This spacious one-story home features 3 bedrooms, 2 baths, and is 1,540 square feet with a 2 car garage. Included in this beautiful new home, are new energy efficient appliances, custom cabinets, a landscaped front yard and a homeowner Warranty. Chelsea Oaks South offers a small town atmosphere, surrounded by conservation areas and lakes, all within a short distance from downtown Orlando. This perfect location, combined with countless recreational activities within the community, makes it a family-friendly and exciting place to support an active and healthy lifestyle.
Key facts
- 5,500 sq ft lot
- 2 garage spots
- Built 2017
Property features AI
Finance
- Financial info: Lease restrictions apply
- HOA & community: Has HOA (Leland Management, Inc.); HOA fee $475 annually (approx. $39.58/month); Association approval required; Pets allowed
Exterior
- Parking: Driveway; Attached 2-car garage
- Security: Owned security system
- Utilities: Public water; Public sewer; Electricity available; Water service available
- Home design: Single-family residence; One story; Faces south
- Construction: Block and stucco construction; Shingle roof; Slab foundation; Built on 0.13-acre lot
- Exterior features: Other exterior features; Asphalt road access
Interior
- Kitchen: Dishwasher; Microwave; Electric water heater; Other appliances
- Bedrooms: 3 bedrooms
- Flooring: Carpet; Vinyl
- Bathrooms: 2 full bathrooms
- Heating & cooling: Central heating; Central air conditioning
- Interior features: Eat-in kitchen; Security system (owned)
- Laundry & utility: Dedicated laundry room
Neighborhood map
What this means for you Summary
Snapshot
- This is a 3-bed/2.0-bath single-family listed at $283k.
Deal economics
- At list price, monthly cash flow is $-94 ($-1k/yr) — negative.
- To cash-flow at today's rent, offer at most $266k (5.9% below list).
- To meet the 1% rule (rent ≥ 1% of price), the offer needs to be $225k (20.7% below list).
- Recommended offer: $225k (20.7% below list) — sets the bar for 1% rule.
- Cap rate 5.9% vs local median 4.5% in Tavares — top-decile yield for the area; either an underpriced asset or a hidden risk that comps aren't pricing in. Stress-test before assuming the spread holds.
Location & tenants
- Location reads 76/100 on livability (#220 in FL, #3,464 nationally) — a middle-class / working-renter tenant base. Strengths: crime A+, cost of living A+, housing A+; Watch: employment D, amenities F, commute F.
- Lake (suburban): math 49% / reading 50% proficiency, ranked #37 of 73 in FL (top 51%) — families likely to look elsewhere, expect single-tenant / working-renter base with shorter leases.
- Zoned schools: Tavares Elementary School (math 49% / reading 45%, grade D-, #1,191 of 2,144 statewide, top 57%, 875 students, 61% FRL); Tavares Middle School (math 43% / reading 40%, grade F, #348 of 571 statewide, top 62%, 1,070 students, 58% FRL); Tavares High School (math 32% / reading 40%, grade F, #359 of 667 statewide, top 55%, 1,507 students, 45% FRL).
- Market conditions: Rents rising fast (+4.0%/yr); 507 active listings in the ZIP; 21 comparable units currently listed for rent nearby; rentals at typical pace (median 18d on market — plan ~3-4 weeks tenant-placement turnaround); 4,799 units permitted in Lake County in 2024 (814 in 5+ unit buildings).
- This rent runs 42% of the median local income ($63k/yr) — at the standard rent-burdened threshold; future hikes will face affordability resistance.
Forward outlook
- Local home prices are declining (-3.0%/yr); year-one equity from $2k of loan paydown is wiped out by about $8k of value loss. Plan a longer hold.
- Lake County population projected at +37% by 2050 — long-run rental-demand tailwind backs the buy-and-hold thesis.
Negotiation context
- It's been on market 77 days — a 6% lower offer ($266k) is reasonable based on typical stale-listing flexibility.
- 3 sale attempts since 9y ago; this cycle's ask has dropped $20k (7%) from the opening price — seller is motivated, your offer sets the floor, not the list.
- Current owner paid $189k; 50% above their basis — modest negotiation headroom, anchor on the comps not their cost.
Risks & watch-outs
- Climate carrying-cost: severe wind risk, 99% chance of damaging wind over 30y; extreme-heat days projected 7→23/yr by 2055 (HVAC capex compounding) — expect insurance premiums to compound above CPI over the hold.
Questions for the listing agent
- What do current leases actually rent for vs. the listed asking? Can we see a recent rent roll and the last 12 months of T-12 income?
- It's been on market 77 days. Have you received any prior offers? Is the seller open to a 21% concession, seller financing, or rate buy-down credit?
- What does the HOA fee cover, when was the last increase, and are there any pending special assessments or reserve-fund shortfalls?
- Why hasn't it sold? Are there any deal-killer items the seller is aware of (foundation, flood, title, zoning, code violations)?
- Is there a deadline driving the sale (1031 exchange, divorce, estate, relocation)? That informs how much negotiation room exists.
- The area grade is low — what's the realistic commute time and amenity access for the typical tenant pool here? Any planned neighborhood developments (good or bad) we should know about?
- What's the average days-on-market for RENTAL listings here right now (not sales)? A rising rental-DOM trend means longer vacancies and softer asking-rent achievability than the comps imply.
- What's the recent tenant-quality profile in this submarket — average credit score on applications, eviction rate, late-payment / NSF rate, and stable-employment percentage? A property-management company in the area should have these aggregated.
- How much new for-sale + rental construction is in the pipeline within 1–3 miles? Heavy new supply typically softens prices + rents 12–24 months out; constrained supply supports both.
Investment metrics
- 1% rule
- 0.79% ✗
- Cap rate
- 5.89%
- Cash-on-cash
- -1.43%
- DSCR
- 0.94
- GRM
- 10.5
CMA / ARV
- ARV (on-the-fly)
- $348,718
- Comps found
- 5
Show comp detail 5 sales within ~0.75 mi
| Address | Dist | Beds/Ba | Sqft | Sold | Price | $/sf | Match |
|---|---|---|---|---|---|---|---|
| 2395 Bracknell Forest Trl | 0.16mi | 3/2.0 | 1,543 (0%) | 1mo | $295,000 | $191 | 92 |
| 2191 Bexley Dr | 0.20mi | 3/2.0 | 1,596 (+3%) | 19mo | $325,000 | $204 | 70 |
| 32580 Lakeshore Dr | 0.64mi | 3/2.0 | 1,548 (+0%) | 14mo | $350,000 | $226 | 58 |
| 1200 Kellogg Dr | 0.62mi | 4/2.0 (+1) | 1,617 (+5%) | 14mo | $370,000 | $229 | 46 |
| 422 Oak View Dr | 0.66mi | 3/2.0 | 1,644 (+6%) | 18mo | $389,000 | $237 | 43 |
Match score weights: distance 35% · size 25% · config 20% · recency 20%. Top-matched comps best support the ARV.
Projected returns pro-forma
-3.0% appreciation · 4.05% rent growth · sell at horizon
- IRR
- -17.6%
- Equity multiple
- 0.38×
- Total profit
- $-49,491
- Equity at exit
- $42,196
- IRR
- -7.9%
- Equity multiple
- 0.48×
- Total profit
- $-40,867
- Equity at exit
- $24,469
Cash invested: $79,240 (down + closing). Projections, not guarantees.
Landlord ↔ Tenant lean methodology
- Overall (STATE)
- 87 Strongly Landlord-Friendly
- State Florida
- 87 Strongly Landlord-Friendly · R+3
- County
- — inherits STATE
- City
- — inherits STATE
ZIP-level market 32778
- Home prices YoY
- -23.4%
- Rents YoY
- 4.0%
- Active inventory
- 507
- Price-to-rent
- 10.5×
Monthly cashflow live
- Estimated rent
- $2,245 high interval (Pro) →
- Mortgage (P&I)
- −$1,484
- Tax from tax record
- −$227 /mo · $2,726/yr
- Insurance
- −$118
- HOA
- −$39
- Vacancy / Maint / Mgmt
- −$472
- Net cashflow
- $-94
Break-even live
Sensitivity live
| Price | -10% $66 | -5% $-14 | +0% $-94 | +5% $-174 | +10% $-255 |
|---|---|---|---|---|---|
| Rent | -10% $-272 | -5% $-183 | +0% $-94 | +5% $-6 | +10% $83 |
| Rate | -1.0pp $48 | -0.5pp $-22 | base $-94 | +0.5pp $-168 | +1.0pp $-242 |
UW: 25.0% down · 7.5% · 30yr · 1.5% tax · 5.0% vac · 8.0% maint · 8.0% mgmt
Financing live
Cash to close
- Down payment
- $70,750
- Closing costs
- $8,490
- Reserves months
- —
- Total cash needed
- —
Loan-product check · same deal, 3 products live
Conventional
25% down · 7.5% · 30yr
- Down + closing
- —
- Monthly P&I
- —
- Monthly cashflow
- —
- DSCR
- —
- Eligible?
- —
Personal DTI + credit; lowest rate.
DSCR
20% down · 8.5% · 30yr
- Down + closing
- —
- Monthly P&I
- —
- Monthly cashflow
- —
- DSCR
- —
- Eligible?
- —
No personal income docs; deal must DSCR.
Hard money
10% down · 12.0% · 12mo
- Down + closing
- —
- Monthly P&I
- —
- Monthly cashflow
- —
- DSCR
- —
- Eligible?
- —
Short-term bridge; refi at stabilization.
Rent comps 21 comps
| Address | Beds | Baths | Sqft | Rent | $/sqft | DOM | Units | Dist |
|---|---|---|---|---|---|---|---|---|
| 2551 Bracknell Forest Trl Tavares, FL | 3.0 | 2.0 | 1483 | $2,081 | $1.40 | 18d | 1 | 0.07mi |
| 2533 Bracknell Forest Trl Tavares, FL | 3.0 | 2.0 | 1483 | $2,100 | $1.42 | 4d | 1 | 0.08mi |
| 2741 Grand Central Ave Tavares, FL | 3.0 | 2.0 | 1690 | $2,201 | $1.30 | 0d | 1 | 0.17mi |
| 2296 Bracknell Forest Trl Tavares, FL | 3.0 | 2.0 | 1900 | $2,220 | $1.17 | 0d | 1 | 0.29mi |
| 2213 Merry Rd Tavares, FL | 3.0 | 2.0 | 1596 | $1,990 | $1.25 | 5d | 1 | 0.54mi |
| 1792 Henin Cir Tavares, FL | 4.0 | 2.0 | 1828 | $2,100 | $1.15 | 25d | 1 | 0.54mi |
| 1108 Longville Cir Tavares, FL | 3.0 | 2.0 | 1585 | $2,150 | $1.36 | 6d | 1 | 0.64mi |
| 1224 Kellogg Dr Tavares, FL | 4.0 | 2.0 | 2129 | $2,345 | $1.10 | 25d | 1 | 0.70mi |
| 4255 Wee St Unit 4255 Mt Dora, FL | 3.0 | 1.0 | 1828 | $1,800 | $0.98 | 16d | 1 | 0.88mi |
| 1147 E Caroline St Tavares, FL | 3.0 | 2.5 | 2139 | $2,345 | $1.10 | 25d | 3 | 1.01mi |
| 1129 E Caroline St Tavares, FL | 3.0 | 2.5 | 2139 | $2,295 | $1.07 | 25d | 1 | 1.02mi |
| 1111 E Caroline St Tavares, FL | 3.0 | 2.5 | 2139 | $2,295 | $1.07 | 25d | 1 | 1.03mi |
| 1075 E Caroline St Tavares, FL | 3.0 | 2.5 | 2139 | $2,395 | $1.12 | 25d | 1 | 1.06mi |
| 1057 E Caroline St Unit 31 Tavares, FL | 3.0 | 2.5 | 2139 | $2,295 | $1.07 | 25d | 1 | 1.07mi |
| 1019 E Caroline St Tavares, FL | 3.0 | 2.5 | 2139 | $2,395 | $1.12 | 25d | 1 | 1.10mi |
| 1003 Dora Ave Tavares, FL | 3.0 | 3.5 | 1680 | $2,400 | $1.43 | 16d | 1 | 1.14mi |
| 1003 Dora Ave Unit A Tavares, FL | 3.0 | 3.5 | 1788 | $2,400 | $1.34 | 25d | 1 | 1.14mi |
| 807 McLain Ct Tavares, FL | 2.0 | 2.0 | 1104 | $1,700 | $1.54 | 18d | 1 | 1.24mi |
| 1090 Emerald Dr Mount Dora, FL | 3.0 | 2.0 | 1320 | $1,625 | $1.23 | 23d | 1 | 1.32mi |
| 3550 Lake Center Dr Mount Dora, FL | 1.0–3.0 | 1.0–2.0 | 1026 | $1,899 | $1.85 | 4d | 26 | 1.35mi |
| 4021 Lake Saunders Dr Mount Dora, FL | 2.0 | 1.0 | 1100 | $1,450 | $1.32 | 0d | 1 | 1.44mi |
HOA detail
- Monthly dues
- $39 · $468/yr
Listing history 23 events
-
2026-06-16status $283,000 Pending 77 DOM
-
2026-06-15days on market $283,000 Active 77 DOM
-
2026-06-13days on market $283,000 Active 75 DOM
-
2026-06-09days on market $283,000 Active 71 DOM
-
2026-06-08days on market $283,000 Active 70 DOM
-
2026-06-07days on market $283,000 Active 69 DOM
-
2026-06-04pricedays on market $283,000 Active 66 DOM
-
2026-06-03days on market $288,000 Active 65 DOM
-
2026-06-02days on market $288,000 Active 64 DOM
-
2026-06-01days on market $288,000 Active 63 DOM
-
2026-05-31days on market $288,000 Active 62 DOM
-
2026-04-30price $288,000
-
2026-04-16price $294,000
-
2026-03-30$303,000 Active
-
2017-12-29soldstatus $188,900 Sold 692-char remark
Show marketing remark (692 chars)
Under construction. The Bokeelia floor plan by LGI Homes is located in the beautiful community of Chelsea Oaks South. This spacious one-story home features 3 bedrooms, 2 baths, and is 1,540 square feet with a 2 car garage. Included in this beautiful new home, are new energy efficient appliances, custom cabinets, a landscaped front yard and a homeowner Warranty. Chelsea Oaks South offers a small town atmosphere, surrounded by conservation areas and lakes, all within a short distance from downtown Orlando. This perfect location, combined with countless recreational activities within the community, makes it a family-friendly and exciting place to support an active and healthy lifestyle.
-
2017-12-20status Pending 692-char remark
Show marketing remark (692 chars)
Under construction. The Bokeelia floor plan by LGI Homes is located in the beautiful community of Chelsea Oaks South. This spacious one-story home features 3 bedrooms, 2 baths, and is 1,540 square feet with a 2 car garage. Included in this beautiful new home, are new energy efficient appliances, custom cabinets, a landscaped front yard and a homeowner Warranty. Chelsea Oaks South offers a small town atmosphere, surrounded by conservation areas and lakes, all within a short distance from downtown Orlando. This perfect location, combined with countless recreational activities within the community, makes it a family-friendly and exciting place to support an active and healthy lifestyle.
-
2017-12-20$188,900 Active 692-char remark
Show marketing remark (692 chars)
Under construction. The Bokeelia floor plan by LGI Homes is located in the beautiful community of Chelsea Oaks South. This spacious one-story home features 3 bedrooms, 2 baths, and is 1,540 square feet with a 2 car garage. Included in this beautiful new home, are new energy efficient appliances, custom cabinets, a landscaped front yard and a homeowner Warranty. Chelsea Oaks South offers a small town atmosphere, surrounded by conservation areas and lakes, all within a short distance from downtown Orlando. This perfect location, combined with countless recreational activities within the community, makes it a family-friendly and exciting place to support an active and healthy lifestyle.
-
2017-11-06status Pending
-
2017-11-04historical
-
2017-11-02$188,900 Active
-
2016-04-04soldstatus $575,600
-
2014-08-11soldstatus $2,580,600
-
2009-01-29soldstatus $1,190,700
ⓘ Source: listings_history table (triggers on properties + properties_extension) + one-shot
backfill from property_details.listing_events for pre-trigger history.
Tax reassessment forecast FL · Resets to sale price
- Current annual tax
- $2,726 · $227/mo
- Projected year-2 tax
- $2,726 · $227/mo
- Expected delta
- $0/yr ($0/mo · 0.0%)
ⓘ Screening estimate from a state-policy table — verify with the county assessor before closing.
Climate risk First Street
- Flood 1/10 Low FEMA zone X (unshaded) · 0% chance over 30 yrs
- Wildfire 1/10 Low
- Heat 9/10 Extreme 7 d/yr ≥108°F today · 23 d/yr by 30 yrs out
- Wind 9/10 Extreme 99% chance of damaging wind over 30 yrs
- Air quality 2/10 Low 1 unhealthy d/yr today · 1 by 30 yrs out
Nearby sold comps map
Loading sold comps map…
Walkable amenities ~0.75 mi
Loading nearby amenities…
Taxation est. · year 1
- Rental income
- $26,944
- − Mortgage interest
- −$15,852
- − Property taxes
- −$2,726
- − Insurance
- −$1,415
- − Repairs & maintenance
- −$2,155
- − Management
- −$2,155
- − HOA
- −$468
- − Depreciation
- −$8,233
- Taxable loss
- −$6,061
- Est. tax savings @ 24.0%
- +$1,455
- After-tax cash flow
- $322/yr
For passive investors: Depreciation is non-cash, so a rental often shows a tax loss while cash-flowing — sheltering income. Rental losses are passive: they offset passive income freely, and up to $25,000/yr can offset ordinary (W-2) income if you actively participate and your MAGI is under $100k (phasing out to $0 by $150k); unused losses carry forward. On sale, claimed depreciation is recaptured at up to 25%, and gains may owe capital-gains tax (a 1031 exchange can defer both). Figures are a year-1 estimate at your 24.0% rate — not tax advice; consult a CPA.
Schools (NCES district)
- District
- Lake
- NCES district ID
- 1201050
- Math proficiency
- 49% ▼ -7.00%
- Reading proficiency
- 50% ▼ -4.00%
- Median HH income
- $46,632
- Composite
- 42.05/100
- National rank
- #3327
- State rank
- #37 of 73 in FL
Livability — Tavares
- Score
- 76/100
- State rank
- #220
- US rank
- #3464
Category grades
Schools grade is shown separately in the Schools card above.
Census & demographics
- Census place
- Tavares, FL
- County
- Lake County · 364,602 people
- City population
- 25,042
- Metro
- Orlando-Kissimmee-Sanford, FL
- Population (ZIP)
- 25,042
- Household income
- $63,472
- Rent vs Own
- Severe rent burden
- 586.0
Population outlook (Lake County) Hauer SSP2
- Today (2025)
- 386,640 people
- By 2030
- 417,107 · +7.9%
- By 2040
- 476,676 · +23.3%
- By 2050
- 531,296 · +37.4%
- By 2075
- 648,303 · +67.7%
- By 2100
- 698,530 · +80.7%
Race, ethnicity, and origin ACS 2023
- Neighborhood character
- Predominantly White (72%)
- Race & ethnicity
- White 72% Hispanic / Latino 14% Two or more races 8% Black 8% Asian 2%
- Hispanic origin (detail)
- Mexican 1% Puerto Rican 7% Cuban 2% Dominican 1%
- Common ancestry
- Romanian 4% Italian 3% Slovak 2%
- Foreign-born
- 9% · Canada, Dominican Republic, Jamaica
- Languages at home
- 85% English-only · Spanish 11% Other Indo-European 2% Other Asian/Pacific 1%
Political lean MEDSL · Lake
- 2024 margin
- Strong R (+24.7) · D 37.3% · R 62.0%
- 2008→2024 swing
- -11.2pp toward R · 2008: -13.5pp · 2024: -24.7pp
- All cycles
- 2024: R+24.7 2020: R+20.0 2016: R+23.1 2012: R+17.1 2008: R+13.5
Not yet ingested
- Civics
- —
Market trends
- HPI YoY
- ▼ -88.07%
- Current HPI
- 288.7123
- Rent YoY
- ▲ 4.05%
- Metro
- Orlando-Kissimmee-Sanford, FL
- State GDP YoY
- ▲ 3.28%
- F500 in state
- 36
Industry mix (Fortune 500 HQ in FL)
| Industry | F500 HQs | Revenue |
|---|---|---|
| Industrial Technology | 2 | $29B |
|
||
| Insurance | 2 | $17B |
|
||
| Retail | 1 | $60B |
|
||
| Technology Distribution | 1 | $58B |
|
||
| Homebuilding | 1 | $35B |
|
||
| Technology Manufacturing | 1 | $35B |
|
||
Price history
-75.8% since first listed12 events — show timeline
- 2026-04-30 Price Changed $288,000 Stellar MLS as Distributed by MLS Grid
- 2026-04-16 Price Changed $294,000 Stellar MLS as Distributed by MLS Grid
- 2026-03-30 Listed $303,000 Stellar MLS as Distributed by MLS Grid
- 2017-12-29 Sold (MLS) $188,900 Stellar MLS as Distributed by MLS Grid
- 2017-12-20 Pending — Stellar MLS as Distributed by MLS Grid
- 2017-12-20 Listed $188,900 Stellar MLS as Distributed by MLS Grid
- 2017-11-06 Pending — Stellar MLS as Distributed by MLS Grid
- 2017-11-04 Listing Removed — Stellar MLS as Distributed by MLS Grid
- 2017-11-02 Listed $188,900 Stellar MLS as Distributed by MLS Grid
- 2016-04-04 Sold (Public Records) $575,600 Public Records
- 2014-08-11 Sold (Public Records) $2,580,600 Public Records
- 2009-01-29 Sold (Public Records) $1,190,700 Public Records
Property tax history
+25.9%/yrLatest (2025): $2,726 · +2.3% YoY. Source: county tax records.
Cash-flow waterfall
monthlySold comps — $/sqft
last 12 mo · ≤1 miLoading sold comps…