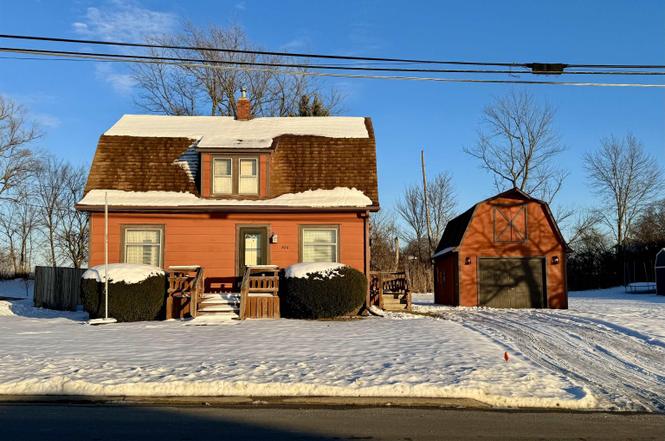
626 S 1st St · Chariton, IA
Flood risk 1/10 · Minimal
- FEMA flood zone
- X (unshaded)
- Chance of flooding over 30 yrs
- 0.0%
- Est. flood insurance / yr
- $473 – $860
Fire risk 5/10 · Moderate
- Est. fire insurance / yr
- $902 – $1,676
Heat risk 3/10 · Minor
- Hot days now (above 104°F)
- 7 days/yr
- Hot days in 30 yrs
- 15 days/yr
Wind risk 2/10 · Minimal
- Chance of severe wind over 30 yrs
- —
Air-quality risk 2/10 · Minimal
- Unhealthy air days now
- 1 days/yr
- Unhealthy air days in 30 yrs
- 2 days/yr
Risk factors via First Street. Map © Google.
Why this score? — see what drove the B+ grade
The composite is a weighted blend of 9 inputs, each scored 0–100. Each bar is that input's sub-score; the figure is the points it added to the 100-point composite (weight × sub-score).
- Cash flow +30.0/30.0
- ARV discount +15.0/15.0
- DSCR +10.0/10.0
- 1% rule +9.2/10.0
- Schools +5.1/10.0
- Livability +4.0/5.0
- Rent growth +2.5/5.0
- Condition / age +2.5/5.0
- Appreciation +0.0/10.0
$90,000
🖨 Deal sheet (PDF) 📄 Offer letter ✓ Due diligence
Listing remarks
This character-filled 1.5-story home in Chariton offers 4 bedrooms upstairs, 2 bathrooms, a 1-car detached garage, and a deck with a spacious and secluded backyard to enjoy. All appliances remain with the property; stackable washer and dryer is located on the main floor with additional hookups for washer and dryer in basement as well. This house used to be a duplex and has been converted to a single family home, therefore has two staircases on both sides of the living room and a small hallway connecting upstairs bedrooms. Home has a full and well-maintained concrete block basement. The garage was built in 1995 and has an upper level that was designed to be a usable small workshop space. Pro
Key facts
- Spacious backyard
- Converted duplex
- Two staircases
Tags
Neighborhood map
What this means for you Summary
Snapshot
- This is a 4-bed/2.0-bath single-family listed at $90k.
Deal economics
- At list price, monthly cash flow is $401 ($5k/yr) — positive.
- The deal already cash-flows at list — no discount required.
- Meets the 1% rule at list price ($1k rent vs $90k).
- Recommended offer: $79k (12.0% below list) — sets the bar for market timing.
- Cap rate 11.6% vs local median 4.1% in Chariton — top-decile yield for the area; either an underpriced asset or a hidden risk that comps aren't pricing in. Stress-test before assuming the spread holds.
Location & tenants
- Location reads 80/100 on livability (#84 in IA, #1,703 nationally) — a professional / high-income tenant draw. Strengths: cost of living A+, housing A+, health & safety A+; Watch: employment C-, amenities F, commute F.
- Chariton Community School District (town): math 57% / reading 65% proficiency, ranked #241 of 289 in IA (top 83%) — acceptable for families but not a draw, mixed tenant base, ~2y average lease.
- Zoned schools: Columbus Elementary School (284 students, 58% FRL); Chariton Middle School (math 63% / reading 70%, grade A-, #148 of 246 statewide, top 61%, 285 students, 56% FRL); Chariton High School (math 57% / reading 73%, grade B, #208 of 336 statewide, top 62%, 392 students, 50% FRL).
- Market conditions: 81 active listings in the ZIP; 3 units permitted in Lucas County in 2024 (0 in 5+ unit buildings).
Forward outlook
- Local home prices are declining (-3.0%/yr); year-one equity from $622 of loan paydown is wiped out by about $3k of value loss. Plan a longer hold.
- Lucas County population projected at -23% by 2050 — secular population decline; favor cash flow + early exit over multi-decade hold.
- At projected returns (-3.0% appreciation + 3.0% rent growth), your $25k cash investment doubles in ~7 years — after that, you're playing with house money.
Negotiation context
- It's been on market 122 days — a 12% lower offer ($79k) is reasonable based on typical stale-listing flexibility.
Risks & watch-outs
- Watch-outs: built in 1900 — expect roof / HVAC / electrical / plumbing capex.
- Climate carrying-cost: moderate wildfire risk — expect insurance premiums to compound above CPI over the hold.
Questions for the listing agent
- It's been on market 122 days. Have you received any prior offers? Is the seller open to a 12% concession, seller financing, or rate buy-down credit?
- Built in 1900 — when were the roof, HVAC, electrical panel, plumbing, and water heater last replaced?
- Why hasn't it sold? Are there any deal-killer items the seller is aware of (foundation, flood, title, zoning, code violations)?
- Is there a deadline driving the sale (1031 exchange, divorce, estate, relocation)? That informs how much negotiation room exists.
- Schools are A-rated — typically a magnet for longer-tenancy family renters. What's the average tenant stay here, and is there a school-zone premium baked into asking?
- What's the average days-on-market for RENTAL listings here right now (not sales)? A rising rental-DOM trend means longer vacancies and softer asking-rent achievability than the comps imply.
- What's the recent tenant-quality profile in this submarket — average credit score on applications, eviction rate, late-payment / NSF rate, and stable-employment percentage? A property-management company in the area should have these aggregated.
- How much new for-sale + rental construction is in the pipeline within 1–3 miles? Heavy new supply typically softens prices + rents 12–24 months out; constrained supply supports both.
Investment metrics
- 1% rule
- 1.42% ✓
- Cap rate
- 11.64%
- Cash-on-cash
- 19.11%
- DSCR
- 1.85
- GRM
- 5.9
CMA / ARV
- ARV (on-the-fly)
- $141,132
- Comps found
- 2
Show comp detail 2 sales within ~0.75 mi
| Address | Dist | Beds/Ba | Sqft | Sold | Price | $/sf | Match |
|---|---|---|---|---|---|---|---|
| 626 S 1st St | 0.00mi | 4/2.0 | 1,238 (0%) | 1mo | $77,000 | $62 | 99 |
| 456 S 8th Street St | 0.60mi | 4/2.5 | 1,409 (+14%) | 14mo | $160,000 | $114 | 35 |
Match score weights: distance 35% · size 25% · config 20% · recency 20%. Top-matched comps best support the ARV.
Projected returns pro-forma
-3.0% appreciation · 3.0% rent growth · sell at horizon
- IRR
- 11.0%
- Equity multiple
- 1.44×
- Total profit
- $10,988
- Equity at exit
- $13,419
- IRR
- 20.1%
- Equity multiple
- 2.69×
- Total profit
- $42,527
- Equity at exit
- $7,782
Cash invested: $25,200 (down + closing). Projections, not guarantees.
Landlord ↔ Tenant lean methodology
- Overall (STATE)
- 83 Strongly Landlord-Friendly
- State Iowa
- 83 Strongly Landlord-Friendly · R+6
- County
- — inherits STATE
- City
- — inherits STATE
ZIP-level market 50049
- Home prices YoY
- -4.4%
- Active inventory
- 81
- Price-to-rent
- 5.9×
Monthly cashflow live
- Estimated rent
- $1,279 medium interval (Pro) →
- Mortgage (P&I)
- −$472
- Tax from tax record
- −$100 /mo · $1,196/yr
- Insurance
- −$38
- HOA
- −$0
- Vacancy / Maint / Mgmt
- −$269
- Net cashflow
- $401
Break-even live
Sensitivity live
| Price | -10% $452 | -5% $427 | +0% $401 | +5% $376 | +10% $350 |
|---|---|---|---|---|---|
| Rent | -10% $300 | -5% $351 | +0% $401 | +5% $452 | +10% $502 |
| Rate | -1.0pp $447 | -0.5pp $424 | base $401 | +0.5pp $378 | +1.0pp $354 |
UW: 25.0% down · 7.5% · 30yr · 1.5% tax · 5.0% vac · 8.0% maint · 8.0% mgmt
Financing live
Cash to close
- Down payment
- $22,500
- Closing costs
- $2,700
- Reserves months
- —
- Total cash needed
- —
Loan-product check · same deal, 3 products live
Conventional
25% down · 7.5% · 30yr
- Down + closing
- —
- Monthly P&I
- —
- Monthly cashflow
- —
- DSCR
- —
- Eligible?
- —
Personal DTI + credit; lowest rate.
DSCR
20% down · 8.5% · 30yr
- Down + closing
- —
- Monthly P&I
- —
- Monthly cashflow
- —
- DSCR
- —
- Eligible?
- —
No personal income docs; deal must DSCR.
Hard money
10% down · 12.0% · 12mo
- Down + closing
- —
- Monthly P&I
- —
- Monthly cashflow
- —
- DSCR
- —
- Eligible?
- —
Short-term bridge; refi at stabilization.
Listing history 2 events
-
2026-04-07status Pending
-
2025-12-06$90,000 Active
ⓘ Source: listings_history table (triggers on properties + properties_extension) + one-shot
backfill from property_details.listing_events for pre-trigger history.
Tax reassessment forecast IA · Partial reset (capped growth)
- Current annual tax
- $1,196 · $100/mo
- Projected year-2 tax
- $1,304 · $109/mo
- Expected delta
- +$108/yr (+$9/mo · 9.1%)
ⓘ Screening estimate from a state-policy table — verify with the county assessor before closing.
Climate risk First Street
- Flood 1/10 Low FEMA zone X (unshaded) · 0% chance over 30 yrs
- Wildfire 5/10 Major
- Heat 3/10 Moderate 7 d/yr ≥104°F today · 15 d/yr by 30 yrs out
- Wind 2/10 Low
- Air quality 2/10 Low 1 unhealthy d/yr today · 2 by 30 yrs out
Nearby sold comps map
Loading sold comps map…
Walkable amenities ~0.75 mi
Loading nearby amenities…
Taxation est. · year 1
- Rental income
- $15,349
- − Mortgage interest
- −$5,041
- − Property taxes
- −$1,196
- − Insurance
- −$450
- − Repairs & maintenance
- −$1,228
- − Management
- −$1,228
- − Depreciation
- −$2,618
- Taxable income
- $3,587
- Est. tax owed @ 24.0%
- −$861
- After-tax cash flow
- $3,955/yr
For passive investors: Depreciation is non-cash, so a rental often shows a tax loss while cash-flowing — sheltering income. Rental losses are passive: they offset passive income freely, and up to $25,000/yr can offset ordinary (W-2) income if you actively participate and your MAGI is under $100k (phasing out to $0 by $150k); unused losses carry forward. On sale, claimed depreciation is recaptured at up to 25%, and gains may owe capital-gains tax (a 1031 exchange can defer both). Figures are a year-1 estimate at your 24.0% rate — not tax advice; consult a CPA.
Schools (NCES district)
- District
- Chariton Community School District
- NCES district ID
- 1907050
- Math proficiency
- 57% ▼ -11.00%
- Reading proficiency
- 65% ▼ -6.00%
- Median HH income
- $44,415
- Composite
- 51.35/100
- National rank
- #1738
- State rank
- #241 of 289 in IA
Livability — Chariton
- Score
- 80/100
- State rank
- #84
- US rank
- #1703
Category grades
Schools grade is shown separately in the Schools card above.
Census & demographics
- Census place
- Chariton, IA
- Population (ZIP)
- 6,425
Population outlook (Lucas County) Hauer SSP2
- Today (2025)
- 8,106 people
- By 2030
- 7,755 · -4.3%
- By 2040
- 7,007 · -13.6%
- By 2050
- 6,265 · -22.7%
- By 2075
- 4,926 · -39.2%
- By 2100
- 3,792 · -53.2%
Race, ethnicity, and origin ACS 2023
- Neighborhood character
- Predominantly White (95%)
- Race & ethnicity
- White 95% Two or more races 3% Hispanic / Latino 2% Asian 1%
- Common ancestry
- Iranian 3% Italian 2% Slovak 2%
- Foreign-born
- 2% · Canada
- Languages at home
- 95% English-only · German/W. Germanic 2% Spanish 2% Other Asian/Pacific 1%
Political lean MEDSL · Lucas
- 2024 margin
- Solid R (+48.1) · D 25.2% · R 73.3% · Other 1.5%
- 2008→2024 swing
- -41.4pp toward R · 2008: -6.7pp · 2024: -48.1pp
- All cycles
- 2024: R+48.1 2020: R+43.3 2016: R+38.1 2012: R+6.3 2008: R+6.7
Not yet ingested
- Civics
- —
Market trends
- HPI YoY
- ▼ -10.20%
- Current HPI
- 220.0223
- Rent YoY
- —
- Metro
- —
- State GDP YoY
- ▲ 2.48%
- F500 in state
- 4
Industry mix (Fortune 500 HQ in IA)
| Industry | F500 HQs | Revenue |
|---|---|---|
| Financial Services | 1 | $16B |
|
||
| Retail / Convenience | 1 | $15B |
|
||
Price history
2 events — show timeline
- 2026-04-07 Pending — IAR
- 2025-12-06 Listed $90,000 IAR
Property tax history
-0.5%/yrLatest (2025): $1,196 · -5.2% YoY. Source: county tax records.
Cash-flow waterfall
monthlySold comps — $/sqft
last 12 mo · ≤1 miLoading sold comps…