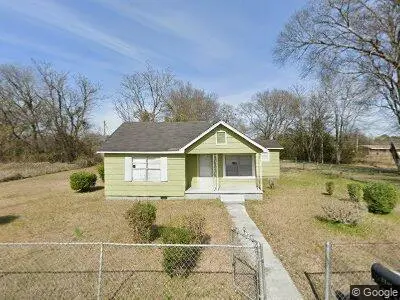
2215 10th Ave S · Columbus, MS
Flood risk 1/10 · Minimal
- FEMA flood zone
- AE
- Chance of flooding over 30 yrs
- 0.0%
- Est. flood insurance / yr
- $1,737 – $8,500
Fire risk 3/10 · Minor
- Est. fire insurance / yr
- $1,241 – $2,305
Heat risk 7/10 · Major
- Hot days now (above 109°F)
- 7 days/yr
- Hot days in 30 yrs
- 21 days/yr
Wind risk 6/10 · Moderate
- Chance of severe wind over 30 yrs
- 57.0%
Air-quality risk 2/10 · Minimal
- Unhealthy air days now
- 0 days/yr
- Unhealthy air days in 30 yrs
- 1 days/yr
Risk factors via First Street. Map © Google.
Why this score? — see what drove the B- grade
The composite is a weighted blend of 9 inputs, each scored 0–100. Each bar is that input's sub-score; the figure is the points it added to the 100-point composite (weight × sub-score).
- Cash flow +30.0/30.0
- 1% rule +10.0/10.0
- DSCR +10.0/10.0
- ARV discount +7.5/15.0
- Livability +3.0/5.0
- Rent growth +2.5/5.0
- Condition / age +2.5/5.0
- Schools +1.0/10.0
- Appreciation +0.0/10.0
$68,000
🖨 Deal sheet (PDF) 📄 Offer letter ✓ Due diligence
Listing remarks
Just minutes from downtown! Located on a dead end street, this home offers backyard privacy, fenced all around with a rear deck for those who love to grill and entertain. A great house for outdoor living while still being in the city. Come check it out!
Key facts
- Backyard privacy
- Fenced all around
- Rear deck
Tags
Neighborhood map
What this means for you Summary
Snapshot
- This is a 2-bed/1.0-bath single-family listed at $68k.
Deal economics
- At list price, monthly cash flow is $124 ($1k/yr) — positive.
- The deal already cash-flows at list — no discount required.
- Meets the 1% rule at list price ($1k rent vs $68k).
- Recommended offer: $66k (3.0% below list) — sets the bar for market timing.
Location & tenants
- Location reads 60/100 on livability (#219 in MS) — a middle-class / working-renter tenant base. Strengths: cost of living A+, housing A, crime B+; Watch: health & safety D, amenities F, commute F.
- Columbus Municipal School District (town): math 9% / reading 17% proficiency, ranked #113 of 130 in MS (top 87%) — low school quality limits family demand, transient renter base, plan for 1-2y turnover; 84% free/reduced lunch — lower-income household profile, screen leases tightly.
- Zoned schools: Cook Elementary School (math 8% / reading 22%, grade F, #274 of 375 statewide, top 74%, 388 students, 100% FRL); Columbus Middle School (math 8% / reading 15%, grade F, #149 of 179 statewide, top 84%, 667 students, 100% FRL); Columbus High School (math 10% / reading 16%, grade F, #155 of 197 statewide, top 80%, 898 students, 100% FRL) — zoned schools average 100% FRL vs 84% district-wide (16 pts higher); higher-poverty schools than district average — tighter screening recommended.
- Market conditions: 4 active listings in the ZIP; 2 comparable units currently listed for rent nearby; lower-income renter base — watch delinquency; 130 units permitted in Lowndes County in 2024 (0 in 5+ unit buildings).
- At $1,236/mo this rent would consume 46% of the median local household income ($33k/yr) (locally 775% of renters already pay >50% of income on rent) — very limited rent-growth headroom before tenants either downsize or default.
Forward outlook
- Local home prices are declining (-3.0%/yr); year-one equity from $470 of loan paydown is wiped out by about $2k of value loss. Plan a longer hold.
- Lowndes County population projected to shrink 9% by 2050 — rents likely to lag national; underwrite the cash flow, not the appreciation.
Negotiation context
- It's been on market 41 days — a 3% lower offer ($66k) is reasonable based on typical stale-listing flexibility.
Risks & watch-outs
- Watch-outs: flood insurance adds $427/mo; built in 1950 — expect roof / HVAC / electrical / plumbing capex.
- Climate carrying-cost: in FEMA flood zone AE (mandatory federal flood insurance); major wind risk, 57% chance of damaging wind over 30y; extreme-heat days projected 7→21/yr by 2055 (HVAC capex compounding) — expect insurance premiums to compound above CPI over the hold.
Questions for the listing agent
- It's been on market 41 days. Have you received any prior offers? Is the seller open to a 3% concession, seller financing, or rate buy-down credit?
- Built in 1950 — when were the roof, HVAC, electrical panel, plumbing, and water heater last replaced?
- What's the actual annual flood-insurance premium (NFIP or private), and is the property in a SFHA with mandatory coverage?
- Is there a deadline driving the sale (1031 exchange, divorce, estate, relocation)? That informs how much negotiation room exists.
- Schools are F-rated, which usually means shorter tenancies and higher turnover. Who's the typical renter profile here, and what's been the actual vacancy rate?
- What's the average days-on-market for RENTAL listings here right now (not sales)? A rising rental-DOM trend means longer vacancies and softer asking-rent achievability than the comps imply.
- What's the recent tenant-quality profile in this submarket — average credit score on applications, eviction rate, late-payment / NSF rate, and stable-employment percentage? A property-management company in the area should have these aggregated.
- How much new for-sale + rental construction is in the pipeline within 1–3 miles? Heavy new supply typically softens prices + rents 12–24 months out; constrained supply supports both.
Investment metrics
- 1% rule
- 1.82% ✓
- Cap rate
- 16.01%
- Cash-on-cash
- 34.69%
- DSCR
- 2.54
- GRM
- 4.6
CMA / ARV
No comps found within radius.
Projected returns pro-forma
-3.0% appreciation · 3.0% rent growth · sell at horizon
- IRR
- -4.0%
- Equity multiple
- 0.85×
- Total profit
- $-2,873
- Equity at exit
- $10,139
- IRR
- 6.0%
- Equity multiple
- 1.46×
- Total profit
- $8,691
- Equity at exit
- $5,879
Cash invested: $19,040 (down + closing). Projections, not guarantees.
Landlord ↔ Tenant lean methodology
- Overall (STATE)
- 90 Strongly Landlord-Friendly
- State Mississippi
- 90 Strongly Landlord-Friendly · R+11
- County
- — inherits STATE
- City
- — inherits STATE
ZIP-level market 39701
- Home prices YoY
- -33.9%
- Active inventory
- 4
- Price-to-rent
- 4.6×
Monthly cashflow live
- Estimated rent
- $1,236 medium interval (Pro) →
- Mortgage (P&I)
- −$357
- Tax from tax record
- −$41 /mo · $496/yr
- Insurance
- −$28
- Flood insurance flood zone
- −$427 /mo · $5,118/yr
- HOA
- −$0
- Vacancy / Maint / Mgmt
- −$260
- Net cashflow
- $124
Break-even live
Sensitivity live
| Price | -10% $162 | -5% $143 | +0% $124 | +5% $105 | +10% $85 |
|---|---|---|---|---|---|
| Rent | -10% $26 | -5% $75 | +0% $124 | +5% $173 | +10% $222 |
| Rate | -1.0pp $158 | -0.5pp $141 | base $124 | +0.5pp $106 | +1.0pp $88 |
UW: 25.0% down · 7.5% · 30yr · 1.5% tax · 5.0% vac · 8.0% maint · 8.0% mgmt
Financing live
Cash to close
- Down payment
- $17,000
- Closing costs
- $2,040
- Reserves months
- —
- Total cash needed
- —
Loan-product check · same deal, 3 products live
Conventional
25% down · 7.5% · 30yr
- Down + closing
- —
- Monthly P&I
- —
- Monthly cashflow
- —
- DSCR
- —
- Eligible?
- —
Personal DTI + credit; lowest rate.
DSCR
20% down · 8.5% · 30yr
- Down + closing
- —
- Monthly P&I
- —
- Monthly cashflow
- —
- DSCR
- —
- Eligible?
- —
No personal income docs; deal must DSCR.
Hard money
10% down · 12.0% · 12mo
- Down + closing
- —
- Monthly P&I
- —
- Monthly cashflow
- —
- DSCR
- —
- Eligible?
- —
Short-term bridge; refi at stabilization.
Rent comps 2 comps
| Address | Beds | Baths | Sqft | Rent | $/sqft | DOM | Units | Dist |
|---|---|---|---|---|---|---|---|---|
| 224 5th St S Columbus, MS | 1.0–2.0 | 1.0–2.0 | 774 | $1,795 | $2.32 | 45d | 3 | 1.33mi |
| 815 13th St N Columbus, MS | 1.0–3.0 | 1.0 | 610 | $680 | $1.11 | 45d | 1 | 1.46mi |
Listing history 20 events
-
2026-06-22days on market $68,000 Active 41 DOM
-
2026-06-21days on market $68,000 Active 40 DOM
-
2026-06-19days on market $68,000 Active 38 DOM
-
2026-06-18days on market $68,000 Active 37 DOM
-
2026-06-17days on market $68,000 Active 36 DOM
-
2026-06-16days on market $68,000 Active 35 DOM
-
2026-06-15days on market $68,000 Active 34 DOM
-
2026-06-14days on market $68,000 Active 32 DOM
-
2026-06-12days on market $68,000 Active 31 DOM
-
2026-06-09days on market $68,000 Active 28 DOM
-
2026-06-08days on market $68,000 Active 27 DOM
-
2026-06-07days on market $68,000 Active 26 DOM
-
2026-06-05days on market $68,000 Active 23 DOM
-
2026-06-03days on market $68,000 Active 22 DOM
-
2026-06-02days on market $68,000 Active 21 DOM
-
2026-06-01days on market $68,000 Active 20 DOM
-
2026-05-31days on market $68,000 Active 19 DOM
-
2026-05-30days on market $68,000 Active 18 DOM
-
2026-05-12$68,000 Active 253-char remark
-
2017-04-07soldstatus
ⓘ Source: listings_history table (triggers on properties + properties_extension) + one-shot
backfill from property_details.listing_events for pre-trigger history.
Tax reassessment forecast MS · Resets to sale price
- Current annual tax
- $496 · $41/mo
- Projected year-2 tax
- $537 · $45/mo
- Expected delta
- +$41/yr (+$3/mo · 8.4%)
ⓘ Screening estimate from a state-policy table — verify with the county assessor before closing.
Climate risk First Street
- Flood 1/10 Low FEMA zone AE · 0% chance over 30 yrs
- Wildfire 3/10 Moderate
- Heat 7/10 Severe 7 d/yr ≥109°F today · 21 d/yr by 30 yrs out
- Wind 6/10 Major 57% chance of damaging wind over 30 yrs
- Air quality 2/10 Low 0 unhealthy d/yr today · 1 by 30 yrs out
Nearby sold comps map
Loading sold comps map…
Walkable amenities ~0.75 mi
Loading nearby amenities…
Taxation est. · year 1
- Rental income
- $14,836
- − Mortgage interest
- −$3,809
- − Property taxes
- −$496
- − Insurance
- −$5,458
- − Repairs & maintenance
- −$1,187
- − Management
- −$1,187
- − Depreciation
- −$1,978
- Taxable income
- $721
- Est. tax owed @ 24.0%
- −$173
- After-tax cash flow
- $1,314/yr
For passive investors: Depreciation is non-cash, so a rental often shows a tax loss while cash-flowing — sheltering income. Rental losses are passive: they offset passive income freely, and up to $25,000/yr can offset ordinary (W-2) income if you actively participate and your MAGI is under $100k (phasing out to $0 by $150k); unused losses carry forward. On sale, claimed depreciation is recaptured at up to 25%, and gains may owe capital-gains tax (a 1031 exchange can defer both). Figures are a year-1 estimate at your 24.0% rate — not tax advice; consult a CPA.
Schools (NCES district)
- District
- Columbus Municipal School District
- NCES district ID
- 2801200
- Math proficiency
- 9% ▼ -11.00%
- Reading proficiency
- 17% ▼ -6.00%
- Median HH income
- $33,376
- Composite
- 10.49/100
- National rank
- #9782
- State rank
- #113 of 130 in MS
Livability — Columbus
- Score
- 60/100
- State rank
- #219
- US rank
- #18952
Category grades
Schools grade is shown separately in the Schools card above.
Census & demographics
- Census place
- Columbus, MS
- County
- Lowndes County · 35,442 people
- City population
- 35,442
- Metro
- Columbus, MS
- Population (ZIP)
- 11,958
- Household income
- $32,599
- Rent vs Own
- Severe rent burden
- 775.0
Population outlook (Lowndes County) Hauer SSP2
- Today (2025)
- 59,842 people
- By 2030
- 59,312 · -0.9%
- By 2040
- 57,282 · -4.3%
- By 2050
- 54,348 · -9.2%
- By 2075
- 45,423 · -24.1%
- By 2100
- 34,724 · -42.0%
Race, ethnicity, and origin ACS 2023
- Neighborhood character
- Majority Black (63%)
- Race & ethnicity
- Black 63% White 32% Two or more races 4% Hispanic / Latino 2%
- Common ancestry
- Italian 1% Serbian 1% Slovak 1%
- Foreign-born
- 2% · Canada
- Languages at home
- 97% English-only · Spanish 2% French/Haitian/Cajun 1%
Political lean MEDSL · Lowndes
- 2024 margin
- Lean R (+8.2) · D 45.4% · R 53.6%
- 2008→2024 swing
- -5.3pp toward R · 2008: -2.9pp · 2024: -8.2pp
- All cycles
- 2024: R+8.2 2020: R+2.6 2016: R+6.3 2012: R+1.5 2008: R+2.9
Not yet ingested
- Civics
- —
Market trends
- HPI YoY
- ▼ -66.88%
- Current HPI
- 130.6468
- Rent YoY
- —
- Metro
- Columbus, MS
- State GDP YoY
- —
- F500 in state
- 0
Price history
2 events — show timeline
- 2026-05-12 Listed $68,000 FSBO.com
- 2017-04-07 Sold (Public Records) — Public Records
Property tax history
+3.9%/yrLatest (2025): $496 · +1.2% YoY. Source: county tax records.
Cash-flow waterfall
monthlySold comps — $/sqft
last 12 mo · ≤1 miLoading sold comps…